
Before you decide to relocate to Indiana, it’s important to research the exact cost of living around the state. And that’s what we’re going to help you do.
These are the places in Indiana that cost a pretty penny — the most expensive cities in the state.
We used Saturday Night Science to compare the 2019-2023 American Community Survey on cost of living for the 120 places in Indiana with more than 5,000 people.
After we saved up for months and could finally afford it, we landed on this list of the ten most expensive cities in Indiana for 2025.
Table Of Contents: Top Ten | Methodology | Summary | Table
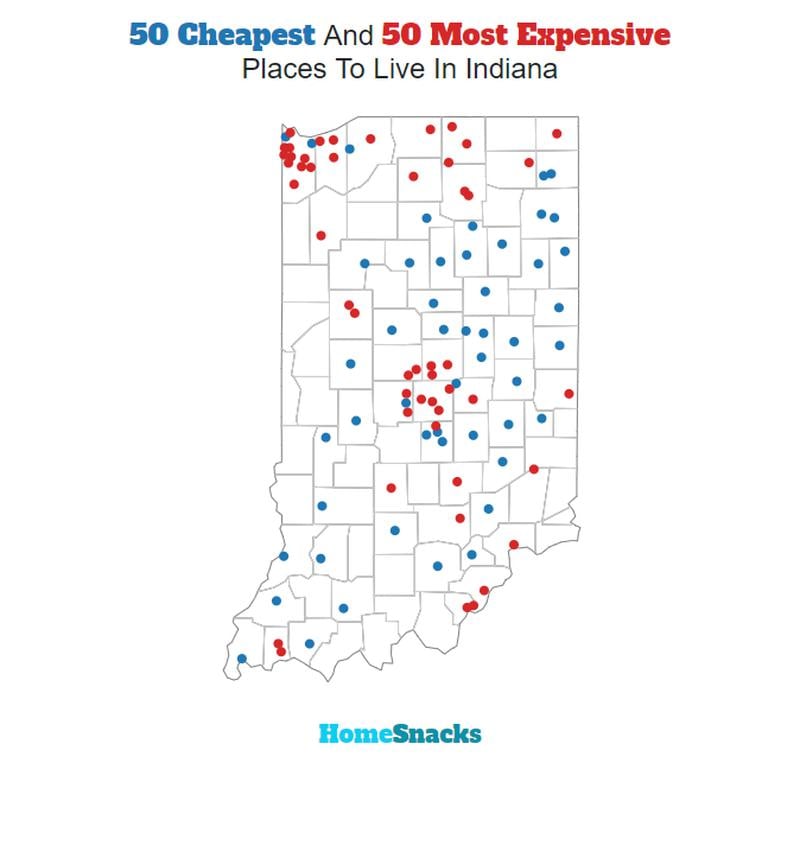
The 10 Most Expensive Places To Live In Indiana For 2025
What’s the most expensive place to live in Indiana? Well, HomeSnacks crunched the numbers and discovered that Zionsville is the most expensive place to live in Indiana.
Connersville (the cheapest place to live in Indiana) can show these guys how to live on a budget in the coming years. Read on for how these places had costs rise faster than inflation.
And if you already knew these places were expensive, check out some more reading about Indiana and the most expensive cities in the country:
The 10 Most Expensive Places To Live In Indiana For 2025

/10
Population: 31,442
Cost Of Living Index: 119
Median Income: $159,126
Average Home Price: $543,800
Home Price To Income Ratio: 3.4x
More on Zionsville: Data
The overall cost of living in Zionsville is 119. The median income in Zionsville comes in at $159,126 and the average home value is $543,800 for 2025.
/10
Population: 7,501
Cost Of Living Index: 119
Median Income: $128,980
Average Home Price: $401,200
Home Price To Income Ratio: 3.1x
More on Winfield: Data
The overall cost of living in Winfield is 119. The median income in Winfield comes in at $128,980 and the average home value is $401,200 for 2025.

/10
Population: 100,501
Cost Of Living Index: 111
Median Income: $134,602
Average Home Price: $455,500
Home Price To Income Ratio: 3.4x
More on Carmel: Data
The overall cost of living in Carmel is 111. The median income in Carmel comes in at $134,602 and the average home value is $455,500 for 2025.

/10
Population: 23,733
Cost Of Living Index: 111
Median Income: $105,764
Average Home Price: $312,000
Home Price To Income Ratio: 2.9x
More on Munster: Data
The overall cost of living in Munster is 111. The median income in Munster comes in at $105,764 and the average home value is $312,000 for 2025.

/10
Population: 16,400
Cost Of Living Index: 108
Median Income: $101,183
Average Home Price: $288,700
Home Price To Income Ratio: 2.9x
More on Dyer: Data
The overall cost of living in Dyer is 108. The median income in Dyer comes in at $101,183 and the average home value is $288,700 for 2025.
/10
Population: 5,208
Cost Of Living Index: 107
Median Income: $74,155
Average Home Price: $259,700
Home Price To Income Ratio: 3.5x
More on Porter: Data
The overall cost of living in Porter is 107. The median income in Porter comes in at $74,155 and the average home value is $259,700 for 2025.

/10
Population: 29,627
Cost Of Living Index: 106
Median Income: $86,020
Average Home Price: $294,600
Home Price To Income Ratio: 3.4x
More on Schererville: Data
The overall cost of living in Schererville is 106. The median income in Schererville comes in at $86,020 and the average home value is $294,600 for 2025.

/10
Population: 21,639
Cost Of Living Index: 106
Median Income: $127,449
Average Home Price: $370,800
Home Price To Income Ratio: 2.9x
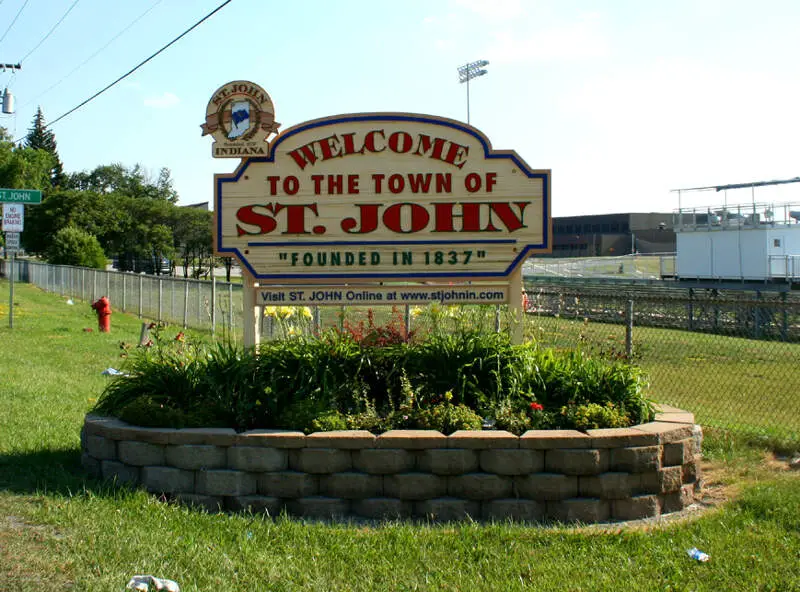
More on St. John: Data
The overall cost of living in St. John is 106. The median income in St. John comes in at $127,449 and the average home value is $370,800 for 2025.

/10
Population: 14,326
Cost Of Living Index: 105
Median Income: $88,536
Average Home Price: $280,400
Home Price To Income Ratio: 3.2x
More on Chesterton: Data
The overall cost of living in Chesterton is 105. The median income in Chesterton comes in at $88,536 and the average home value is $280,400 for 2025.
10. Westfield

/10
Population: 51,109
Cost Of Living Index: 104
Median Income: $119,598
Average Home Price: $391,900
Home Price To Income Ratio: 3.3x
More on Westfield:
The overall cost of living in Westfield is 104. The median income in Westfield comes in at $119,598 and the average home value is $391,900 for 2025.
Methodology: How We Determined The Most Expensive Places To Live In The Hoosier State For 2025
The two most important things to think about when it comes to being able to afford a city in Indiana are:
- How much money do I make?
- How much do I have to spend to live there?
You need to understand your costs in the context of how much money you make.
For example, if the median household earns $100,000 and spends $40,000 on housing, it’s actually cheaper to live there than a place with a median income of $50,000 and housing costs of $21,000. You might spend more on housing, but you have more money overall to play with.
With that example in mind, we derived several statistics from the latest Census American Community Survey 2019-2023 around incomes and costs. They are:
- Overall Cost Of Living Index
- Median Home Price / Median Income (lower is better)
- Median Income / Median Rent (Higher is better)
- Median Home Price
You can then compare these metrics in each of the places in Indiana to figure out which is the most expensive.
You are left with a “Cost of Living Index” by taking the average rank of each of these metrics for each city.
So we used that cost of living index to rank all of the 120 places in Indiana that have more than 5,000 people.
The place with the highest cost of living in Indiana according to the data is Zionsville. We updated this article for 2025. This article is our tenth time ranking the most expensive places to live in Indiana.
Summary: Taking A Chunk Out Of Your Paycheck In Indiana For 2025
Well, there you have it, the places in Indiana that have the highest cost of living, with Zionsville ranking as the most expensive city in the Hoosier State.
The most expensive cities in Indiana are Zionsville, Winfield, Carmel, Munster, Dyer, Porter, Schererville, St. John, Chesterton, and Westfield.
Here’s a look at the most affordable cities in Indiana according to the data:
- Connersville
- Rushville
- Richmond
For more Indiana reading, check out:
- Best Places To Live In Indiana
- Cheapest Places To Live In Indiana
- Most Dangerous Cities In Indiana
- Best Places To Raise A Family In Indiana
- Safest Places In Indiana
- Worst Places To Live In Indiana
Most Expensive Cities In Indiana
| Rank | City | Cost Of Living | Population | Median Income | Average Home Price | Home/Income Ratio |
|---|---|---|---|---|---|---|
| 1 | Zionsville | 119 | 31,442 | $159,126 | $543,800 | 3.4x |
| 2 | Winfield | 119 | 7,501 | $128,980 | $401,200 | 3.1x |
| 3 | Carmel | 111 | 100,501 | $134,602 | $455,500 | 3.4x |
| 4 | Munster | 111 | 23,733 | $105,764 | $312,000 | 2.9x |
| 5 | Dyer | 108 | 16,400 | $101,183 | $288,700 | 2.9x |
| 6 | Porter | 107 | 5,208 | $74,155 | $259,700 | 3.5x |
| 7 | Schererville | 106 | 29,627 | $86,020 | $294,600 | 3.4x |
| 8 | St. John | 106 | 21,639 | $127,449 | $370,800 | 2.9x |
| 9 | Chesterton | 105 | 14,326 | $88,536 | $280,400 | 3.2x |
| 10 | Westfield | 104 | 51,109 | $119,598 | $391,900 | 3.3x |
| 11 | McCordsville | 103 | 9,700 | $113,495 | $327,900 | 2.9x |
| 12 | White | 102 | 11,276 | $118,884 | $343,900 | 2.9x |
| 13 | Merrillville | 101 | 36,343 | $64,791 | $194,000 | 3.0x |
| 14 | Valparaiso | 101 | 34,377 | $67,664 | $250,500 | 3.7x |
| 15 | Sellersburg | 101 | 10,215 | $69,851 | $213,300 | 3.1x |
| 16 | Highland | 100 | 23,749 | $76,219 | $219,500 | 2.9x |
| 17 | Portage | 99 | 37,951 | $72,833 | $210,800 | 2.9x |
| 18 | Hobart | 99 | 29,646 | $71,680 | $203,400 | 2.8x |
| 19 | Batesville | 99 | 6,842 | $66,806 | $215,900 | 3.2x |
| 20 | Noblesville | 98 | 71,940 | $102,319 | $321,800 | 3.1x |
| 21 | Griffith | 98 | 16,228 | $76,009 | $200,400 | 2.6x |
| 22 | West Lafayette | 97 | 44,802 | $33,497 | $318,100 | 9.5x |
| 23 | Crown Point | 96 | 34,042 | $95,757 | $272,800 | 2.8x |
| 24 | Brownsburg | 96 | 30,310 | $105,435 | $282,800 | 2.7x |
| 25 | Avon | 96 | 22,683 | $97,589 | $300,600 | 3.1x |
| 26 | Bloomington | 95 | 78,791 | $48,918 | $289,700 | 5.9x |
| 27 | Hammond | 95 | 77,098 | $53,950 | $141,700 | 2.6x |
| 28 | Lawrenceburg | 95 | 5,155 | $52,778 | $191,400 | 3.6x |
| 29 | Columbus | 94 | 51,104 | $76,856 | $231,000 | 3.0x |
| 30 | Plainfield | 94 | 35,783 | $85,074 | $263,900 | 3.1x |
| 31 | Bargersville | 94 | 10,163 | $104,160 | $405,100 | 3.9x |
| 32 | Jeffersonville | 93 | 50,176 | $70,157 | $208,500 | 3.0x |
| 33 | Clarksville | 93 | 22,121 | $58,518 | $172,700 | 3.0x |
| 34 | Cumberland | 93 | 6,154 | $84,167 | $241,200 | 2.9x |
| 35 | Greenwood | 92 | 64,237 | $78,765 | $248,700 | 3.2x |
| 36 | Lawrence | 92 | 49,284 | $73,455 | $220,400 | 3.0x |
| 37 | Cedar Lake | 92 | 14,686 | $79,177 | $259,900 | 3.3x |
| 38 | Lake Station | 92 | 13,109 | $56,306 | $124,800 | 2.2x |
| 39 | Lowell | 92 | 10,911 | $83,125 | $236,900 | 2.8x |
| 40 | Scottsburg | 92 | 7,338 | $38,027 | $123,900 | 3.3x |
| 41 | Jasper | 91 | 16,421 | $65,283 | $203,300 | 3.1x |
| 42 | Madison | 91 | 12,277 | $57,050 | $186,600 | 3.3x |
| 43 | New Whiteland | 91 | 5,641 | $89,196 | $185,000 | 2.1x |
| 44 | Indianapolis | 90 | 882,043 | $62,995 | $207,000 | 3.3x |
| 45 | New Albany | 90 | 37,589 | $54,152 | $169,600 | 3.1x |
| 46 | East Chicago | 90 | 26,158 | $41,071 | $92,400 | 2.2x |
| 47 | Danville | 90 | 11,049 | $93,080 | $269,400 | 2.9x |
| 48 | Ellettsville | 90 | 6,653 | $82,238 | $224,400 | 2.7x |
| 49 | Winona Lake | 90 | 5,073 | $97,813 | $242,400 | 2.5x |
| 50 | Franklin | 89 | 25,999 | $77,305 | $212,500 | 2.7x |
| 51 | Seymour | 89 | 21,536 | $63,388 | $153,300 | 2.4x |
| 52 | Warsaw | 89 | 16,592 | $57,170 | $175,300 | 3.1x |
| 53 | Angola | 89 | 9,383 | $59,355 | $186,900 | 3.1x |
| 54 | Charlestown | 89 | 8,118 | $77,548 | $191,200 | 2.5x |
| 55 | Salem | 89 | 6,484 | $51,786 | $136,800 | 2.6x |
| 56 | Cicero | 89 | 5,441 | $75,278 | $251,000 | 3.3x |
| 57 | Fort Wayne | 88 | 266,235 | $60,293 | $169,700 | 2.8x |
| 58 | Evansville | 88 | 116,441 | $52,251 | $129,100 | 2.5x |
| 59 | Lafayette | 88 | 70,650 | $52,946 | $157,600 | 3.0x |
| 60 | Gary | 88 | 68,604 | $37,380 | $85,300 | 2.3x |
| 61 | Goshen | 88 | 34,374 | $55,436 | $175,200 | 3.2x |
| 62 | Greenfield | 88 | 24,308 | $74,949 | $205,800 | 2.7x |
| 63 | Auburn | 88 | 13,464 | $62,339 | $172,800 | 2.8x |
| 64 | Tell City | 88 | 7,490 | $50,702 | $121,200 | 2.4x |
| 65 | Rensselaer | 88 | 5,369 | $61,648 | $149,100 | 2.4x |
| 66 | Shelbyville | 87 | 19,866 | $58,532 | $151,100 | 2.6x |
| 67 | Martinsville | 87 | 11,913 | $56,186 | $140,400 | 2.5x |
| 68 | Greensburg | 87 | 11,585 | $63,235 | $181,000 | 2.9x |
| 69 | Mooresville | 87 | 9,608 | $70,228 | $194,300 | 2.8x |
| 70 | Nappanee | 87 | 7,040 | $66,944 | $209,000 | 3.1x |
| 71 | Boonville | 87 | 6,681 | $62,500 | $143,100 | 2.3x |
| 72 | Mount Vernon | 87 | 6,431 | $61,527 | $164,200 | 2.7x |
| 73 | Muncie | 86 | 64,739 | $43,395 | $92,000 | 2.1x |
| 74 | Beech Grove | 86 | 15,082 | $49,452 | $169,500 | 3.4x |
| 75 | Speedway | 86 | 13,622 | $57,158 | $209,400 | 3.7x |
| 76 | Columbia City | 86 | 9,975 | $65,000 | $184,300 | 2.8x |
| 77 | Princeton | 86 | 8,347 | $57,234 | $117,100 | 2.0x |
| 78 | Gas City | 86 | 6,097 | $57,106 | $122,800 | 2.2x |
| 79 | Lebanon | 85 | 17,575 | $63,773 | $179,200 | 2.8x |
| 80 | New Castle | 85 | 17,356 | $48,977 | $95,100 | 1.9x |
| 81 | Huntington | 85 | 17,026 | $51,220 | $104,300 | 2.0x |
| 82 | Greencastle | 85 | 9,863 | $54,217 | $154,000 | 2.8x |
| 83 | North Vernon | 85 | 7,214 | $48,235 | $107,900 | 2.2x |
| 84 | Huntingburg | 85 | 6,504 | $52,327 | $126,500 | 2.4x |
| 85 | Portland | 85 | 6,341 | $45,431 | $90,600 | 2.0x |
| 86 | Alexandria | 85 | 5,145 | $60,616 | $92,700 | 1.5x |
| 87 | Kokomo | 84 | 59,375 | $54,195 | $126,500 | 2.3x |
| 88 | Terre Haute | 84 | 58,491 | $41,960 | $109,500 | 2.6x |
| 89 | Frankfort | 84 | 15,536 | $53,522 | $122,800 | 2.3x |
| 90 | Bedford | 84 | 13,824 | $50,253 | $136,900 | 2.7x |
| 91 | Washington | 84 | 12,192 | $50,000 | $130,700 | 2.6x |
| 92 | Bluffton | 84 | 10,539 | $57,929 | $136,800 | 2.4x |
| 93 | Kendallville | 84 | 10,094 | $60,909 | $130,600 | 2.1x |
| 94 | Decatur | 84 | 9,769 | $58,867 | $132,900 | 2.3x |
| 95 | Anderson | 83 | 54,930 | $47,221 | $104,300 | 2.2x |
| 96 | Vincennes | 83 | 16,676 | $50,238 | $98,700 | 2.0x |
| 97 | New Haven | 83 | 15,339 | $67,121 | $151,200 | 2.3x |
| 98 | Wabash | 83 | 10,378 | $54,199 | $115,000 | 2.1x |
| 99 | Brazil | 83 | 8,064 | $49,331 | $105,900 | 2.1x |
| 100 | Rochester | 83 | 6,244 | $60,304 | $135,900 | 2.3x |