
We all know that the Empire State is one of most expensive states in the country, so trust us when we say that the cities on this list are mind-bogglingly pricey.
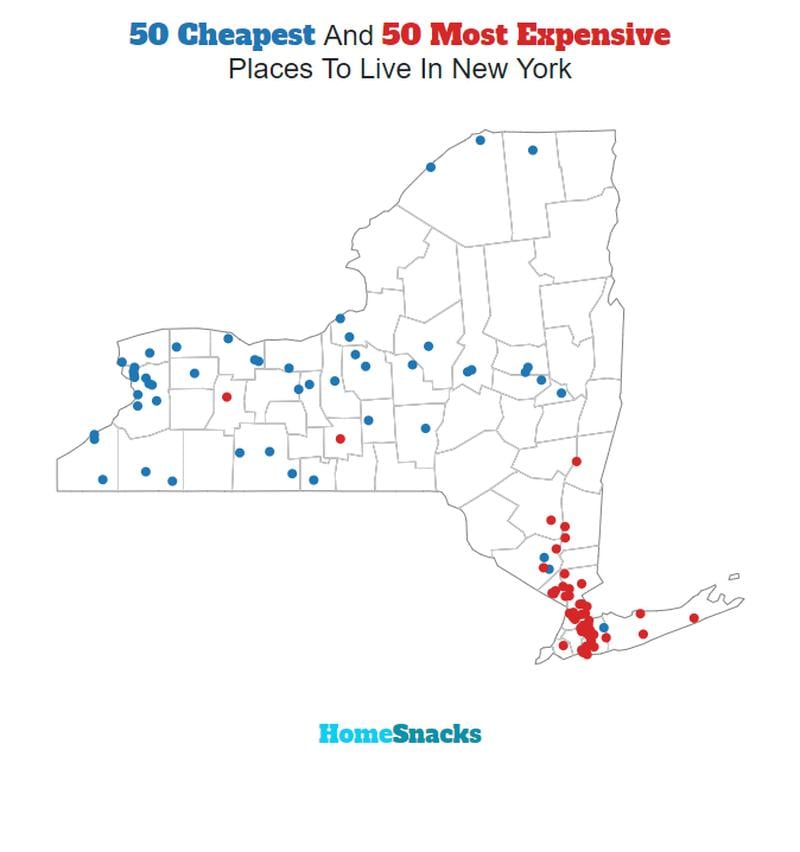
But where are these extra-expensive cities in New York?
We used Saturday Night Science to narrow our search to only New York cities with a population of at least 5,000, leaving us with 167 cities to rank. We then used data from the American Community Survey to find out where the cost of living is the highest.
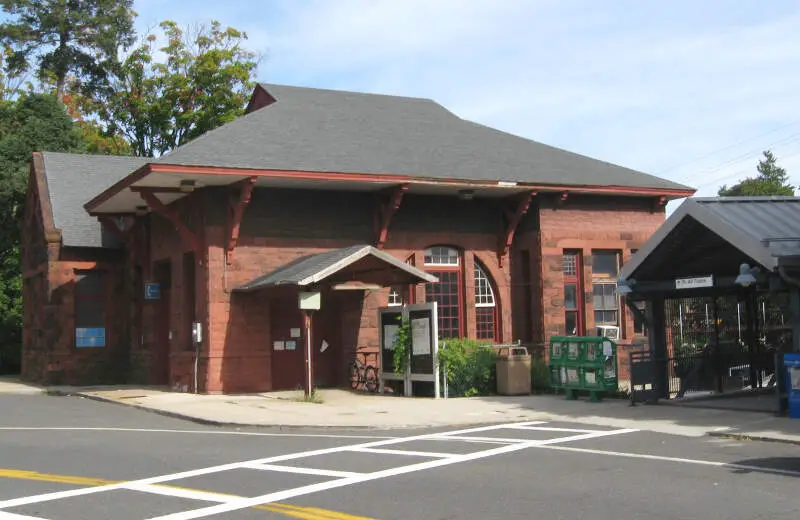
It should come as no shock that one of the most expensive cities in America, New York City, is featured on this list. Equally unsurprising is the inclusion of Long Island’s bastions of “old money” on the North Shore, like Manorhaven and Glen Cove. Most places on this list are within spitting distance of NYC.
Table Of Contents: Top Ten | Methodology | Summary | Table
The 10 Most Expensive Places To Live In New York For 2025
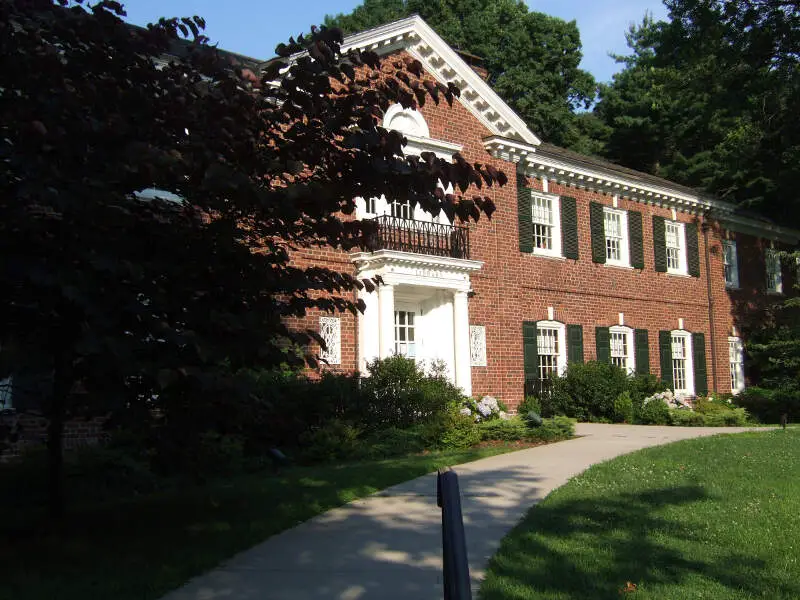
What’s the most expensive place to live in New York? Well, HomeSnacks crunched the numbers and discovered that Kings Point is the most expensive place to live in New York.
Niagara Falls (the cheapest place to live in New York) can show these guys how to live on a budget in the coming years. Read on for how these places had costs rise faster than inflation.
And if you already knew these places were expensive, check out some more reading about New York and the most expensive cities in the country:
The 10 Most Expensive Places To Live In New York For 2025
/10
Population: 5,614
Cost Of Living Index: 363
Median Income: $185,811
Average Home Price: $1,917,200
Home Price To Income Ratio: 10.3x
More on Kings Point: Data
The overall cost of living in Kings Point is 363. The median income in Kings Point comes in at $185,811 and the average home value is $1,917,200 for 2025.

/10
Population: 18,005
Cost Of Living Index: 268
Median Income: $250,001
Average Home Price: $1,703,800
Home Price To Income Ratio: 6.8x
More on Scarsdale: Data
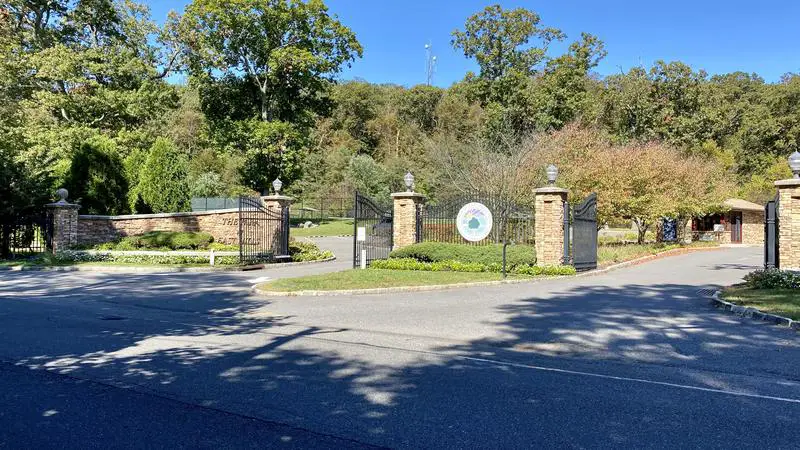
The overall cost of living in Scarsdale is 268. The median income in Scarsdale comes in at $250,001 and the average home value is $1,703,800 for 2025.

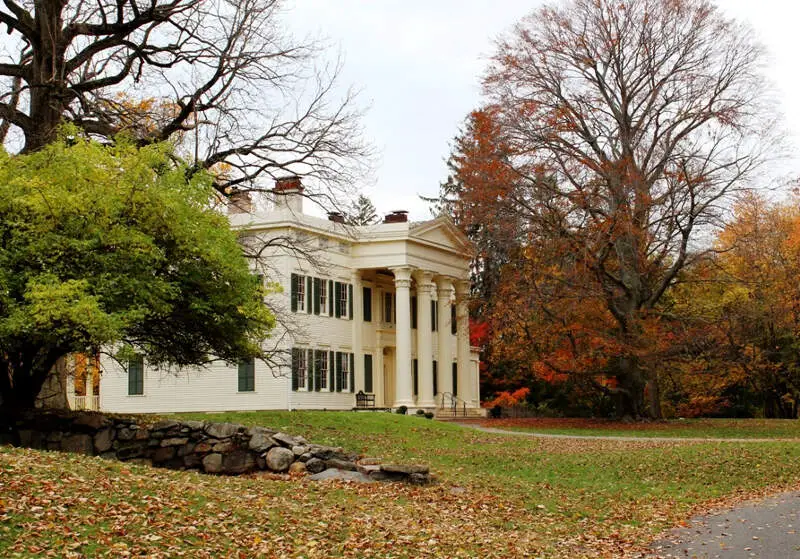
/10
Population: 16,410
Cost Of Living Index: 227
Median Income: $237,727
Average Home Price: $1,785,400
Home Price To Income Ratio: 7.5x
More on Rye: Data
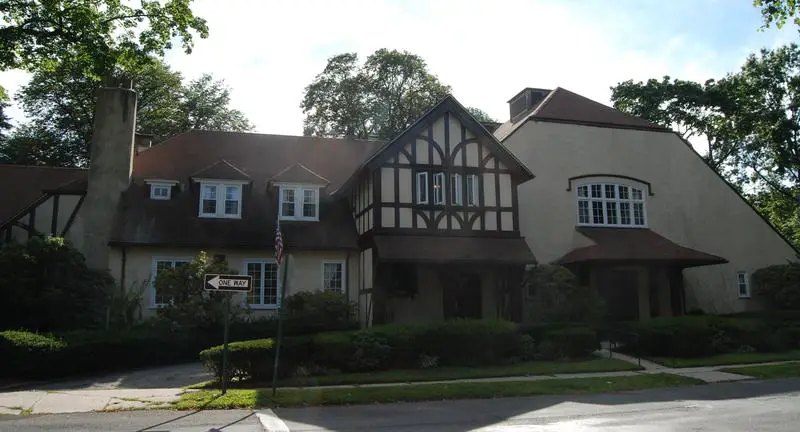
The overall cost of living in Rye is 227. The median income in Rye comes in at $237,727 and the average home value is $1,785,400 for 2025.

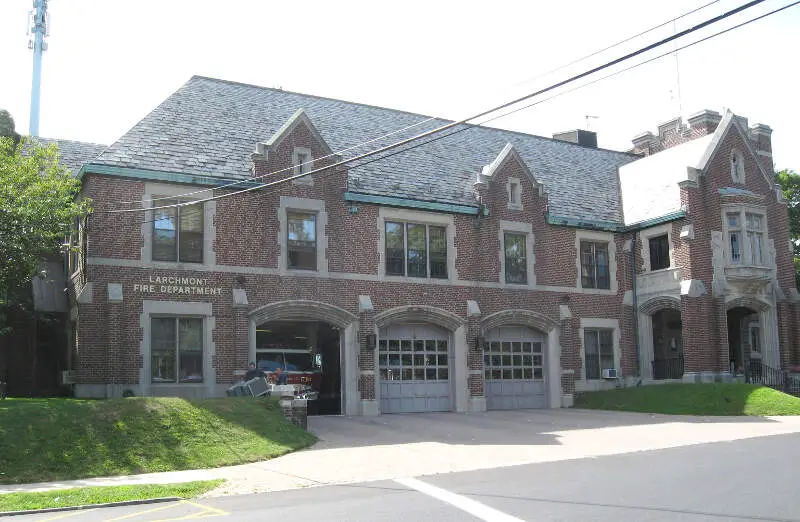
/10
Population: 6,542
Cost Of Living Index: 221
Median Income: $160,526
Average Home Price: $1,384,700
Home Price To Income Ratio: 8.6x
More on Larchmont: Data
The overall cost of living in Larchmont is 221. The median income in Larchmont comes in at $160,526 and the average home value is $1,384,700 for 2025.

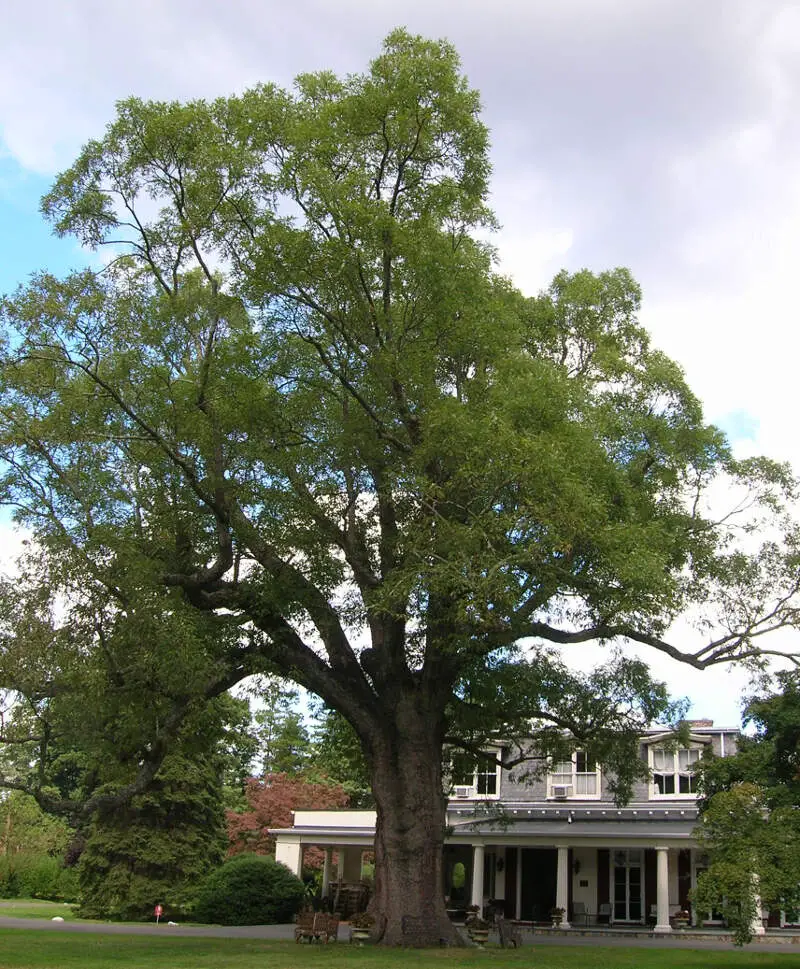
/10
Population: 6,539
Cost Of Living Index: 219
Median Income: $215,726
Average Home Price: $1,137,700
Home Price To Income Ratio: 5.3x
More on Bronxville: Data
The overall cost of living in Bronxville is 219. The median income in Bronxville comes in at $215,726 and the average home value is $1,137,700 for 2025.

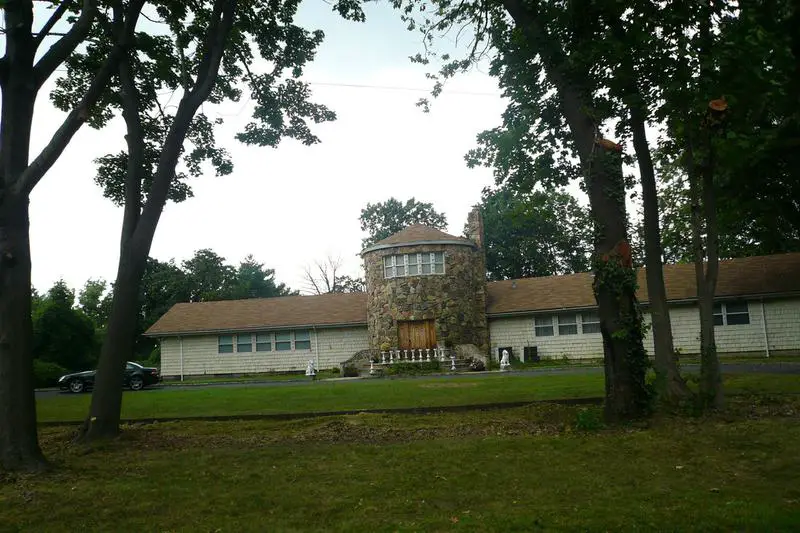
/10
Population: 5,419
Cost Of Living Index: 206
Median Income: $196,938
Average Home Price: $1,212,900
Home Price To Income Ratio: 6.2x
More on North Hills: Data
The overall cost of living in North Hills is 206. The median income in North Hills comes in at $196,938 and the average home value is $1,212,900 for 2025.

/10
Population: 7,249
Cost Of Living Index: 205
Median Income: $250,001
Average Home Price: $1,371,600
Home Price To Income Ratio: 5.5x
More on East Hills: Data
The overall cost of living in East Hills is 205. The median income in East Hills comes in at $250,001 and the average home value is $1,371,600 for 2025.

/10
Population: 5,648
Cost Of Living Index: 195
Median Income: $250,001
Average Home Price: $1,075,300
Home Price To Income Ratio: 4.3x
More on Pelham Manor: Data
The overall cost of living in Pelham Manor is 195. The median income in Pelham Manor comes in at $250,001 and the average home value is $1,075,300 for 2025.

/10
Population: 29,279
Cost Of Living Index: 193
Median Income: $153,273
Average Home Price: $1,001,900
Home Price To Income Ratio: 6.5x
More on Harrison: Data
The overall cost of living in Harrison is 193. The median income in Harrison comes in at $153,273 and the average home value is $1,001,900 for 2025.
/10
Population: 22,866
Cost Of Living Index: 190
Median Income: $228,807
Average Home Price: $1,063,300
Home Price To Income Ratio: 4.6x
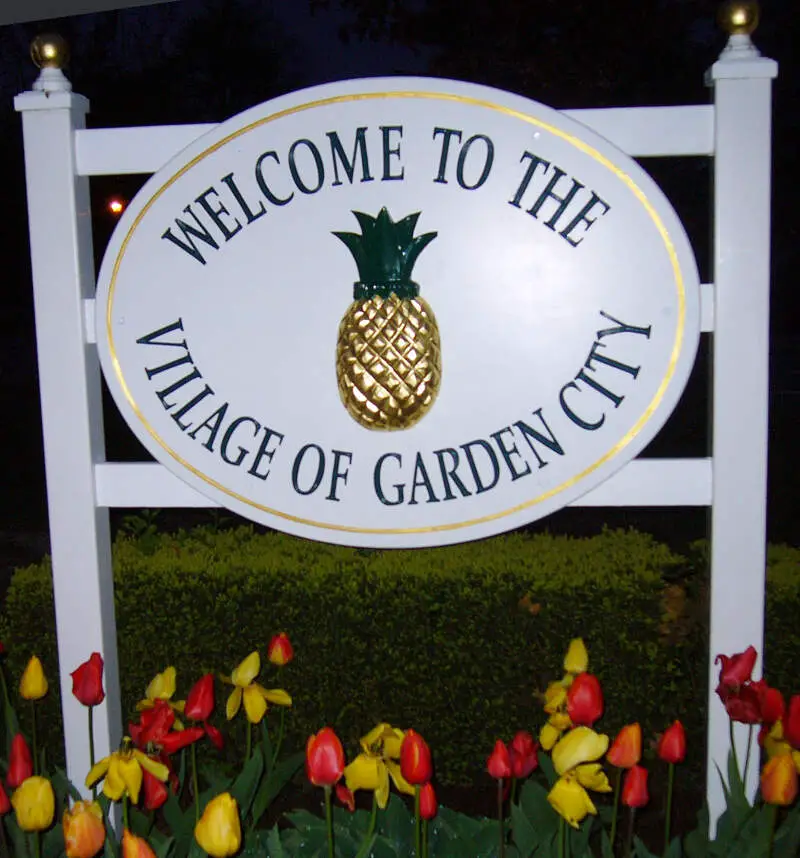
More on Garden City: Data
The overall cost of living in Garden City is 190. The median income in Garden City comes in at $228,807 and the average home value is $1,063,300 for 2025.
Methodology: How We Determined The Most Expensive Places To Live In The Empire State For 2025
The two most important things to think about when it comes to being able to afford a city in New York are:
- How much money do I make?
- How much do I have to spend to live there?
You need to understand your costs in the context of how much money you make.
For example, if the median household earns $100,000 and spends $40,000 on housing, it’s actually cheaper to live there than a place with a median income of $50,000 and housing costs of $21,000. You might spend more on housing, but you have more money overall to play with.
With that example in mind, we derived several statistics from the latest Census American Community Survey 2019-2023 around incomes and costs. They are:
- Overall Cost Of Living Index
- Median Home Price / Median Income (lower is better)
- Median Income / Median Rent (Higher is better)
- Median Home Price
You can then compare these metrics in each of the places in New York to figure out which is the most expensive.
You are left with a “Cost of Living Index” by taking the average rank of each of these metrics for each city.
So we used that cost of living index to rank all of the 167 places in New York that have more than 5,000 people.
The place with the highest cost of living in New York according to the data is Kings Point. We updated this article for 2025. This article is our tenth time ranking the most expensive places to live in New York.
Summary: Taking A Chunk Out Of Your Paycheck In New York For 2025
Well, there you have it, the places in New York that have the highest cost of living, with Kings Point ranking as the most expensive city in the Empire State.
The most expensive cities in New York are Kings Point, Scarsdale, Rye, Larchmont, Bronxville, North Hills, East Hills, Pelham Manor, Harrison, and Garden City.
Here’s a look at the most affordable cities in New York according to the data:
- Niagara Falls
- Salamanca
- Buffalo
For more New York reading, check out:
- Best Places To Live In New York
- Cheapest Places To Live In New York
- Most Dangerous Places In New York
- Best Places To Raise A Family In New York
- Safest Places In New York According To Science
- Worst Places To Live In New York State
Most Expensive Cities In New York
| Rank | City | Cost Of Living | Population | Median Income | Average Home Price | Home/Income Ratio |
|---|---|---|---|---|---|---|
| 1 | Kings Point | 363 | 5,614 | $185,811 | $1,917,200 | 10.3x |
| 2 | Scarsdale | 268 | 18,005 | $250,001 | $1,703,800 | 6.8x |
| 3 | Rye | 227 | 16,410 | $237,727 | $1,785,400 | 7.5x |
| 4 | Larchmont | 221 | 6,542 | $160,526 | $1,384,700 | 8.6x |
| 5 | Bronxville | 219 | 6,539 | $215,726 | $1,137,700 | 5.3x |
| 6 | North Hills | 206 | 5,419 | $196,938 | $1,212,900 | 6.2x |
| 7 | East Hills | 205 | 7,249 | $250,001 | $1,371,600 | 5.5x |
| 8 | Pelham Manor | 195 | 5,648 | $250,001 | $1,075,300 | 4.3x |
| 9 | Harrison | 193 | 29,279 | $153,273 | $1,001,900 | 6.5x |
| 10 | Garden City | 190 | 22,866 | $228,807 | $1,063,300 | 4.6x |
| 11 | Lawrence | 188 | 6,771 | $174,787 | $1,231,800 | 7.0x |
| 12 | Great Neck | 186 | 11,068 | $137,095 | $953,400 | 7.0x |
| 13 | Rye Brook | 183 | 9,884 | $236,968 | $970,900 | 4.1x |
| 14 | Hastings-on-Hudson | 172 | 8,449 | $181,528 | $872,500 | 4.8x |
| 15 | Pelham | 171 | 7,247 | $179,561 | $891,900 | 5.0x |
| 16 | Irvington | 171 | 6,541 | $169,411 | $889,800 | 5.3x |
| 17 | Sea Cliff | 171 | 5,037 | $185,650 | $926,500 | 5.0x |
| 18 | Dobbs Ferry | 170 | 11,397 | $167,927 | $719,300 | 4.3x |
| 19 | Briarcliff Manor | 170 | 7,333 | $226,053 | $850,500 | 3.8x |
| 20 | Manorhaven | 170 | 6,934 | $93,322 | $669,700 | 7.2x |
| 21 | Mamaroneck | 164 | 19,840 | $125,459 | $705,200 | 5.6x |
| 22 | Pleasantville | 163 | 7,395 | $177,591 | $830,900 | 4.7x |
| 23 | Wesley Hills | 163 | 6,150 | $179,000 | $893,200 | 5.0x |
| 24 | Sleepy Hollow | 161 | 10,592 | $101,652 | $756,700 | 7.4x |
| 25 | New Rochelle | 160 | 81,591 | $103,813 | $667,300 | 6.4x |
| 26 | Rockville Centre | 160 | 25,770 | $144,516 | $796,100 | 5.5x |
| 27 | White Plains | 158 | 59,818 | $115,586 | $624,100 | 5.4x |
| 28 | New Hempstead | 157 | 5,431 | $131,293 | $707,300 | 5.4x |
| 29 | Northport | 156 | 7,320 | $141,378 | $708,400 | 5.0x |
| 30 | Tuckahoe | 156 | 6,990 | $127,344 | $625,600 | 4.9x |
| 31 | Kaser | 156 | 5,568 | $28,295 | $831,000 | 29.4x |
| 32 | Williston Park | 155 | 7,508 | $152,656 | $731,700 | 4.8x |
| 33 | Croton-on-Hudson | 154 | 8,205 | $185,718 | $702,600 | 3.8x |
| 34 | Cedarhurst | 154 | 7,306 | $98,958 | $815,800 | 8.2x |
| 35 | Bayville | 154 | 6,744 | $143,571 | $670,500 | 4.7x |
| 36 | Massapequa Park | 152 | 16,985 | $170,470 | $626,300 | 3.7x |
| 37 | New Hyde Park | 152 | 10,208 | $146,571 | $700,400 | 4.8x |
| 38 | Port Jefferson | 152 | 8,029 | $143,125 | $628,500 | 4.4x |
| 39 | Glen Cove | 151 | 28,101 | $91,355 | $654,500 | 7.2x |
| 40 | Babylon | 150 | 12,182 | $143,856 | $622,100 | 4.3x |
| 41 | Port Chester | 147 | 31,162 | $99,916 | $563,900 | 5.6x |
| 42 | Mineola | 147 | 21,082 | $138,385 | $624,300 | 4.5x |
| 43 | Nyack | 147 | 7,469 | $118,889 | $619,300 | 5.2x |
| 44 | New York | 146 | 8,516,202 | $79,713 | $751,700 | 9.4x |
| 45 | Floral Park | 145 | 16,025 | $150,350 | $754,300 | 5.0x |
| 46 | Westbury | 145 | 15,789 | $136,917 | $599,700 | 4.4x |
| 47 | East Rockaway | 145 | 10,064 | $112,415 | $623,500 | 5.5x |
| 48 | Elmsford | 145 | 5,183 | $116,779 | $568,000 | 4.9x |
| 49 | Long Beach | 143 | 34,741 | $130,795 | $661,500 | 5.1x |
| 50 | Lake Grove | 143 | 11,050 | $119,558 | $550,700 | 4.6x |
| 51 | Chestnut Ridge | 142 | 10,464 | $113,750 | $668,000 | 5.9x |
| 52 | Airmont | 141 | 10,082 | $101,868 | $649,300 | 6.4x |
| 53 | Amityville | 141 | 9,513 | $103,684 | $539,600 | 5.2x |
| 54 | Farmingdale | 141 | 8,450 | $134,037 | $530,100 | 4.0x |
| 55 | Ossining | 139 | 26,979 | $100,997 | $444,200 | 4.4x |
| 56 | Lynbrook | 139 | 20,251 | $138,866 | $592,400 | 4.3x |
| 57 | Mount Kisco | 139 | 10,782 | $93,057 | $485,800 | 5.2x |
| 58 | Malverne | 138 | 8,496 | $146,585 | $637,300 | 4.3x |
| 59 | Yonkers | 137 | 209,529 | $81,816 | $478,000 | 5.8x |
| 60 | Lindenhurst | 137 | 27,106 | $129,033 | $484,800 | 3.8x |
| 61 | Great Neck Plaza | 136 | 7,503 | $106,549 | $381,900 | 3.6x |
| 62 | Mount Vernon | 134 | 72,528 | $77,171 | $449,600 | 5.8x |
| 63 | Kiryas Joel | 134 | 36,572 | $43,171 | $685,800 | 15.9x |
| 64 | Valley Stream | 133 | 40,278 | $127,426 | $605,000 | 4.7x |
| 65 | New Square | 133 | 9,712 | $28,880 | $618,800 | 21.4x |
| 66 | Monroe | 131 | 9,466 | $110,806 | $404,200 | 3.6x |
| 67 | Woodbury | 130 | 11,437 | $141,607 | $417,700 | 2.9x |
| 68 | Freeport | 129 | 44,102 | $118,755 | $479,700 | 4.0x |
| 69 | Hempstead | 128 | 58,569 | $82,454 | $442,100 | 5.4x |
| 70 | Patchogue | 128 | 12,368 | $104,423 | $446,700 | 4.3x |
| 71 | Peekskill | 127 | 25,484 | $91,042 | $376,800 | 4.1x |
| 72 | Haverstraw | 126 | 12,273 | $67,447 | $361,800 | 5.4x |
| 73 | West Haverstraw | 126 | 10,663 | $86,167 | $368,600 | 4.3x |
| 74 | New Paltz | 126 | 8,028 | $59,375 | $397,800 | 6.7x |
| 75 | Spring Valley | 124 | 32,995 | $56,151 | $351,500 | 6.3x |
| 76 | Suffern | 122 | 11,395 | $100,737 | $350,200 | 3.5x |
| 77 | Beacon | 121 | 14,629 | $93,347 | $422,000 | 4.5x |
| 78 | Saratoga Springs | 120 | 28,542 | $100,485 | $445,100 | 4.4x |
| 79 | Wappingers Falls | 119 | 5,694 | $58,455 | $277,000 | 4.7x |
| 80 | Goshen | 118 | 5,751 | $99,464 | $383,100 | 3.9x |
| 81 | Washingtonville | 118 | 5,723 | $101,080 | $344,200 | 3.4x |
| 82 | Walden | 116 | 6,871 | $89,652 | $328,300 | 3.7x |
| 83 | Warwick | 113 | 6,625 | $81,250 | $405,700 | 5.0x |
| 84 | Poughkeepsie | 112 | 31,778 | $60,050 | $259,200 | 4.3x |
| 85 | Newburgh | 112 | 28,649 | $51,006 | $221,100 | 4.3x |
| 86 | Colonie | 108 | 7,705 | $100,396 | $270,800 | 2.7x |
| 87 | Ballston Spa | 108 | 5,080 | $82,341 | $281,600 | 3.4x |
| 88 | Middletown | 105 | 30,227 | $77,174 | $271,000 | 3.5x |
| 89 | Ithaca | 104 | 31,792 | $48,617 | $330,100 | 6.8x |
| 90 | Oneonta | 104 | 14,467 | $65,031 | $187,800 | 2.9x |
| 91 | Canton | 103 | 7,222 | $62,438 | $182,900 | 2.9x |
| 92 | Hudson | 103 | 5,900 | $55,394 | $324,400 | 5.9x |
| 93 | Kingston | 102 | 23,942 | $65,413 | $277,900 | 4.2x |
| 94 | Albany | 101 | 100,081 | $59,485 | $223,000 | 3.7x |
| 95 | Troy | 101 | 51,054 | $57,688 | $192,500 | 3.3x |
| 96 | Saranac Lake | 101 | 5,099 | $60,494 | $188,900 | 3.1x |
| 97 | Watertown | 100 | 24,574 | $49,692 | $149,800 | 3.0x |
| 98 | Plattsburgh | 100 | 19,878 | $53,962 | $189,600 | 3.5x |
| 99 | Glens Falls | 100 | 14,678 | $70,089 | $195,800 | 2.8x |
| 100 | Watervliet | 100 | 10,285 | $55,897 | $176,200 | 3.2x |