Most Hispanic/Latino cities in Pennsylvania research summary. We used Saturday Night Science to analyze Pennsylvania’s most recent Census data to determine the most Hispanic/Latino cities based on the percentage of Hispanic/Latino residents.
70.8% Hispanic · #1 most Hispanic in Pennsylvania
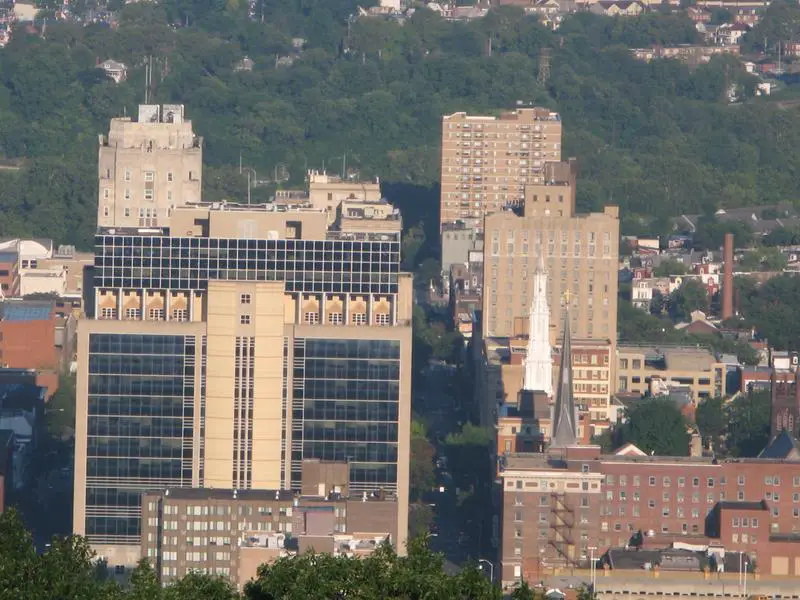
Reading is a city in and the county seat of Berks County, Pennsylvania, United States. With a population of 87,575, it is the fifth-largest city in Pennsylvania. Located in the southeastern part of the state, it is the principal city of the Greater Reading Area.
Data | Crime | Cost of living | Movers

63.4% Hispanic · #2 most Hispanic in Pennsylvania
Hazleton is a city in Luzerne County, Pennsylvania, United States. The population was 25,340 at the 2010 census. The population of Greater Hazleton was 77,187. Hazleton is the second largest city in Luzerne County and the seventeenth largest city in Pennsylvania. It was incorporated as a borough on January 5, 1857, and as a city on December 4, 1891.
Data | Crime | Cost of living | Movers
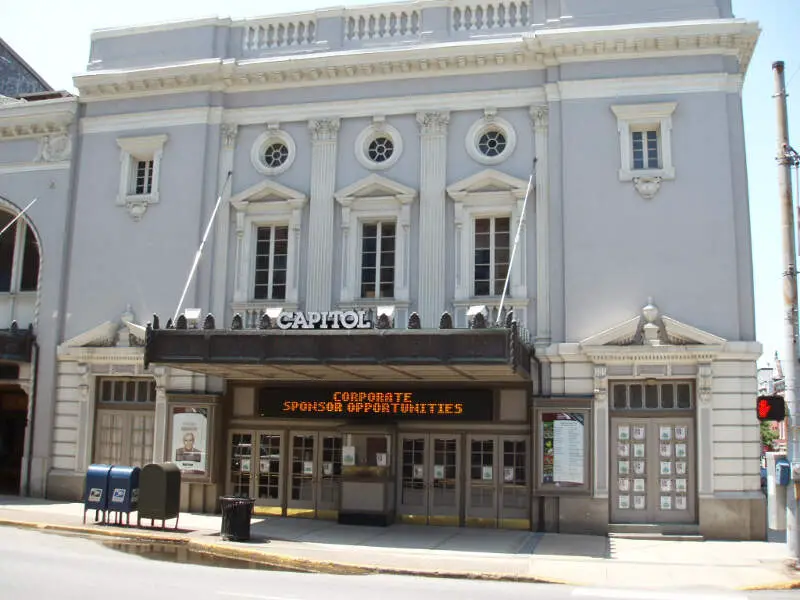
56.3% Hispanic · #3 most Hispanic in Pennsylvania
Allentown is a city located in Lehigh County, Pennsylvania, United States. It is Pennsylvania’s third most populous city and the 224th largest city in the United States. As of the 2010 census, the city had a total population of 118,032 and is currently the fastest growing city in all of Pennsylvania. It is the largest city in the metropolitan area known as the Lehigh Valley, which had a population of 821,623 residents as of 2010. Allentown constitutes a portion of the New York City Combined Statistical Area and is the county seat of Lehigh County. In 2012, the city celebrated the 250th anniversary of its founding in 1762.
Data | Crime | Cost of living | Movers
46.1% Hispanic · #4 most Hispanic in Pennsylvania
Kennett Square is a borough in Chester County, Pennsylvania, United States. It is known as the Mushroom Capital of the World because mushroom farming in the region produces over a million pounds of mushrooms a day. To celebrate this heritage, Kennett Square has an annual Mushroom Festival, where the town shuts down to have a parade, tour mushroom farms, and buy and sell food and other goods. It is also home to the corporate headquarters of Genesis HealthCare which administers elderly care facilities. The local high school is Kennett High School. Its population was 6,072 at the 2010 census.
Data | Crime | Cost of living | Movers
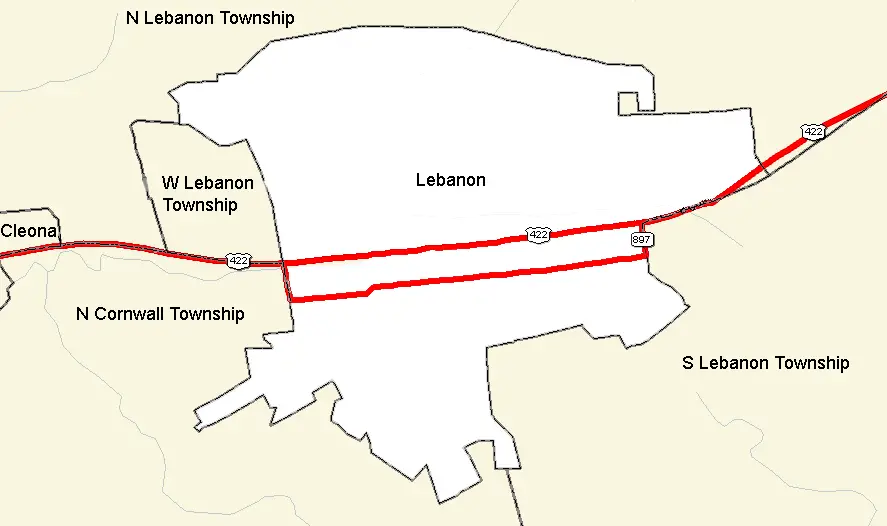
45.4% Hispanic · #5 most Hispanic in Pennsylvania
Lebanon, is a city in and the county seat of Lebanon County, Pennsylvania, United States. The population was 25,477 at the 2010 census, a 4.2% increase from the 2000 count of 24,461. Lebanon is located in the central part of the Lebanon Valley, 26 miles east of Harrisburg and 29 miles west of Reading.
Data | Crime | Cost of living | Movers
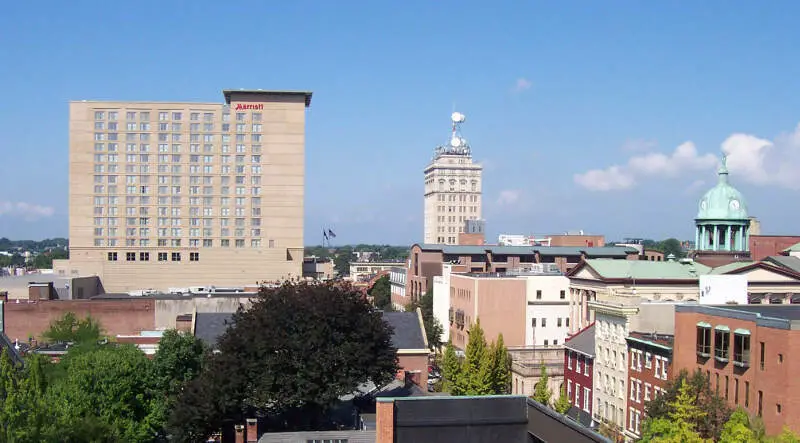
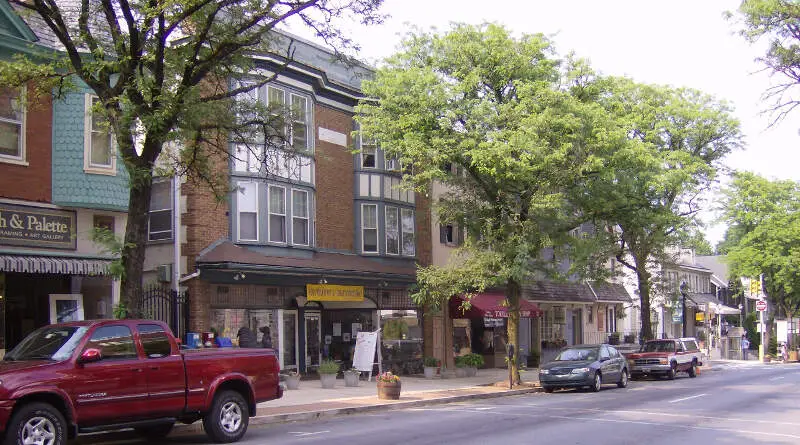
40.6% Hispanic · #6 most Hispanic in Pennsylvania
Lancaster is a city located in South Central Pennsylvania which serves as the seat of Pennsylvania’s Lancaster County and one of the oldest inland towns in the United States. With a population of 59,322, it ranks eighth in population among Pennsylvania’s cities. The Lancaster metropolitan area population is 507,766, making it the 101st largest metropolitan area in the U.S. and second largest in the South Central Pennsylvania area.
Data | Crime | Cost of living | Movers
36.6% Hispanic · #7 most Hispanic in Pennsylvania
York, known as the White Rose City, is the county seat of York County, Pennsylvania, United States, located in the south-central region of the state. The population within York’s city limits was 43,718 at the 2010 census, a 7.0% increase from the 2000 count of 40,862. When combined with the adjacent boroughs of West York and North York and surrounding Spring Garden, West Manchester, and Springettsbury townships, the population of Greater York was 108,386. York is the 11th largest city in Pennsylvania.
Data | Crime | Cost of living | Movers
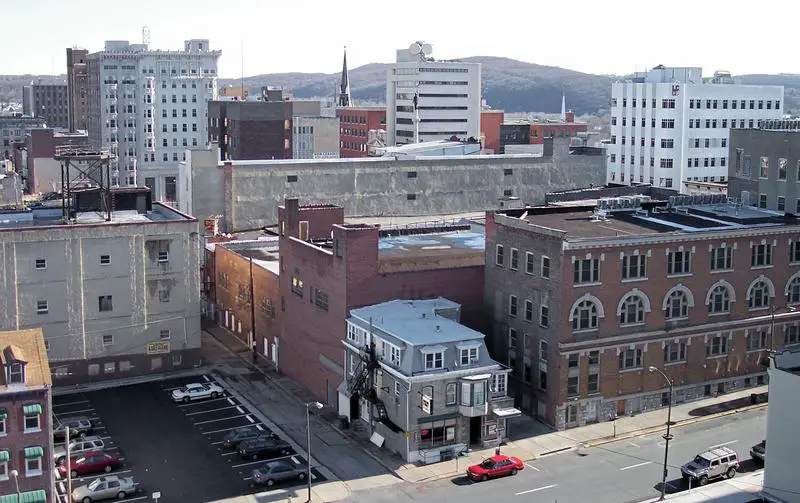
34.8% Hispanic · #8 most Hispanic in Pennsylvania
Data | Crime | Cost of living | Movers
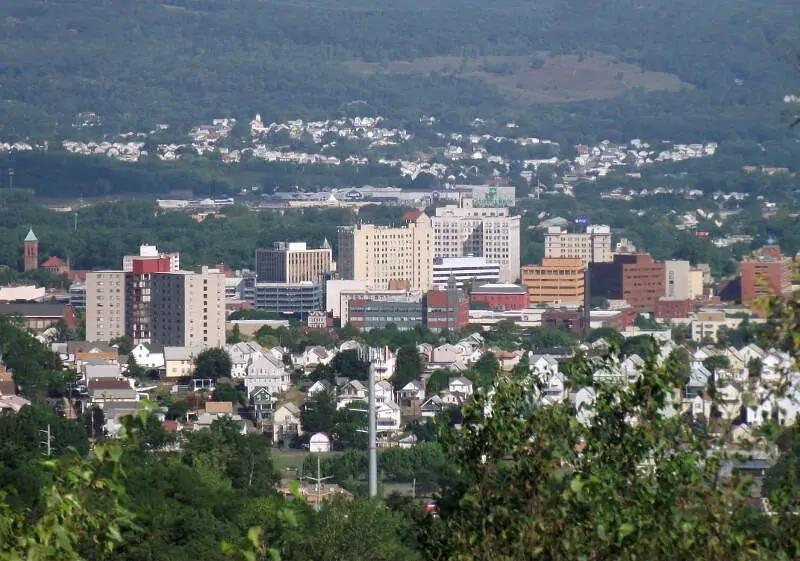
33.8% Hispanic · #9 most Hispanic in Pennsylvania
Wilkes-Barre is a city in the Commonwealth of Pennsylvania and the county seat of Luzerne County. It is one of the principal cities in the Scranton-Wilkes-Barre-Hazleton, PA Metropolitan Statistical Area. Located at the center of the Wyoming Valley, it is second in size to the nearby city of Scranton. The Scranton-Wilkes-Barre-Hazleton, PA Metropolitan Statistical Area had a population of 563,631 as of the 2010 Census, making it the fourth-largest metro/statistical area in the state of Pennsylvania. Wilkes-Barre and the surrounding Wyoming Valley are framed by the Pocono Mountains to the east, the Endless Mountains to the west, and the Lehigh Valley to the south. The Susquehanna River flows through the center of the valley and defines the northwestern border of the city.
Data | Crime | Cost of living | Movers
30.2% Hispanic · #10 most Hispanic in Pennsylvania
Coatesville is a city in Chester County, Pennsylvania, United States. The population was 13,100 at the 2010 census. Coatesville is approximately 39 miles west of Philadelphia. It developed along Lancaster Turnpike, beginning in the late 18th century. It spans Rt. 30, the “Main Line” highway that runs west of Philadelphia.
Data | Crime | Cost of living | Movers
The receipts
Compare the top ten
Pick a metric. The bars rescale. The red line is Pennsylvania’s statewide median.
On the map
Where Pennsylvania’s Hispanic and Latino communities live
Saturday Night Science
Methodology: How We Determined The Cities In Pennsylvania With The Largest Hispanic Population For 2026
We used Saturday Night Science to compare data on race from the US Census for every city in Pennsylvania.
Pennsylvania’s most recently available data comes from the 2020-2024 American Community Survey.
Specifically, we looked at table B03002: Hispanic OR LATINO ORIGIN BY RACE. Here are the category names as defined by the Census:
- Hispanic or Latino
- White alone*
- Black or African American alone*
- American Indian and Alaska Native alone*
- Asian alone*
- Native Hawaiian and Other Pacific Islander alone*
- Some other race alone*
- Two or more races*
Our particular column of interest here was the number of people who identified as Hispanic or Latino.
We limited our analysis to places in Pennsylvania with a population greater than 5,000 people. That left us with 184 cities.
We then calculated the percentage of Hispanic or Latino residents in each Pennsylvania city. The percentages ranked from 70.8% to 0.1%.
Finally, we ranked each city based on the percentage of the Hispanic or Latino population, with a higher percentage being more Hispanic or Latino. Reading was the most Hispanic or Latino, while Brentwood was the least Hispanic or Latino city.
We updated this article for 2026. This article represents our eleventh time ranking the cities in Pennsylvania with the largest Hispanic/Latino population.
The full plate
Cities In Pennsylvania By Hispanic Population
Click any column to sort. Search by city name.
| Rank | City | Population | Hispanic Population | % Hispanic |
|---|---|---|---|---|
| 1 | Reading | 95,242 | 67,414 | 70.8% |
| 2 | Hazleton | 30,111 | 19,105 | 63.4% |
| 3 | Allentown | 125,976 | 70,952 | 56.3% |
| 4 | Kennett Square | 6,243 | 2,881 | 46.1% |
| 5 | Lebanon | 26,536 | 12,037 | 45.4% |
| 6 | Lancaster | 57,719 | 23,424 | 40.6% |
| 7 | York | 44,938 | 16,439 | 36.6% |
| 8 | Norri | 35,893 | 12,481 | 34.8% |
| 9 | Wilkes-Barre | 44,423 | 14,997 | 33.8% |
| 10 | Coatesville | 13,353 | 4,034 | 30.2% |
| 11 | Bethlehem | 77,956 | 22,391 | 28.7% |
| 12 | Harrisburg | 50,287 | 13,281 | 26.4% |
| 13 | Easton | 29,739 | 7,400 | 24.9% |
| 14 | Wilson | 8,183 | 1,924 | 23.5% |
| 15 | Columbia | 10,278 | 2,354 | 22.9% |
| 16 | Chambersburg | 22,319 | 5,044 | 22.6% |
| 17 | Stroudsburg | 5,894 | 1,302 | 22.1% |
| 18 | Shillington | 5,492 | 1,162 | 21.2% |
| 19 | Steelton | 6,296 | 1,273 | 20.2% |
| 20 | East Stroudsburg | 9,319 | 1,750 | 18.8% |
| 21 | Scranton | 76,033 | 13,644 | 17.9% |
| 22 | Catasauqua | 6,541 | 1,157 | 17.7% |
| 23 | Bristol | 9,902 | 1,658 | 16.7% |
| 24 | Helle | 6,118 | 1,014 | 16.6% |
| 25 | Gettysburg | 8,254 | 1,366 | 16.5% |
| 26 | Souderton | 7,181 | 1,173 | 16.3% |
| 27 | Taylor | 6,265 | 1,012 | 16.2% |
| 28 | Philadelphia | 1,579,706 | 245,882 | 15.6% |
| 29 | Palmyra | 7,755 | 1,077 | 13.9% |
| 30 | Quake | 9,319 | 1,273 | 13.7% |
| 31 | Mount Joy | 8,344 | 1,099 | 13.2% |
| 32 | Pittston | 7,626 | 987 | 12.9% |
| 33 | Millersville | 8,982 | 1,159 | 12.9% |
| 34 | Morrisville | 9,752 | 1,255 | 12.9% |
| 35 | Tamaqua | 6,924 | 882 | 12.7% |
| 36 | Hanover | 16,584 | 2,106 | 12.7% |
| 37 | Northampton | 10,400 | 1,320 | 12.7% |
| 38 | Pott | 23,476 | 2,937 | 12.5% |
| 39 | Plymouth | 5,770 | 686 | 11.9% |
| 40 | Milton | 6,534 | 758 | 11.6% |
| 41 | Bangor | 5,163 | 574 | 11.1% |
| 42 | Chester | 33,619 | 3,730 | 11.1% |
| 43 | Olyphant | 5,381 | 594 | 11.0% |
| 44 | Sunbury | 9,617 | 1,061 | 11.0% |
| 45 | New Holland | 5,780 | 630 | 10.9% |
| 46 | Nanticoke | 10,653 | 1,159 | 10.9% |
| 47 | Carbondale | 8,789 | 954 | 10.9% |
| 48 | Old Forge | 8,573 | 900 | 10.5% |
| 49 | Swoyersville | 5,048 | 504 | 10.0% |
| 50 | Middl | 9,632 | 944 | 9.8% |
| 51 | Wyomissing | 11,172 | 1,071 | 9.6% |
| 52 | Schuylkill Haven | 5,253 | 497 | 9.5% |
| 53 | Shamokin | 6,853 | 610 | 8.9% |
| 54 | Pottsville | 13,364 | 1,182 | 8.8% |
| 55 | New Cumberland | 7,580 | 665 | 8.8% |
| 56 | Erie | 93,850 | 8,097 | 8.6% |
| 57 | Bloomsburg | 13,024 | 1,115 | 8.6% |
| 58 | Carlisle | 21,852 | 1,840 | 8.4% |
| 59 | Lansdale | 19,011 | 1,578 | 8.3% |
| 60 | West Chester | 20,666 | 1,712 | 8.3% |
| 61 | Nazareth | 6,043 | 487 | 8.1% |
| 62 | Kingston | 13,397 | 1,060 | 7.9% |
| 63 | Ambridge | 6,890 | 541 | 7.9% |
| 64 | Phoenixville | 19,452 | 1,487 | 7.6% |
| 65 | Emmaus | 11,889 | 877 | 7.4% |
| 66 | Ephrata | 13,772 | 1,008 | 7.3% |
| 67 | Norwood | 5,934 | 434 | 7.3% |
| 68 | Collingdale | 8,897 | 649 | 7.3% |
| 69 | Folcroft | 6,772 | 486 | 7.2% |
| 70 | Ambler | 6,847 | 486 | 7.1% |
| 71 | Lewi | 8,479 | 584 | 6.9% |
| 72 | Jeannette | 8,657 | 590 | 6.8% |
| 73 | Swarthmore | 6,550 | 443 | 6.8% |
| 74 | Downin | 8,255 | 553 | 6.7% |
| 75 | Glenolden | 7,220 | 479 | 6.6% |
| 76 | Waynesboro | 11,047 | 722 | 6.5% |
| 77 | Moosic | 5,973 | 383 | 6.4% |
| 78 | Camp Hill | 8,169 | 517 | 6.3% |
| 79 | Johnstown | 18,087 | 1,128 | 6.2% |
| 80 | State College | 41,050 | 2,505 | 6.1% |
| 81 | Dickson City | 6,023 | 360 | 6.0% |
| 82 | Collegeville | 5,247 | 294 | 5.6% |
| 83 | Palmerton | 5,622 | 310 | 5.5% |
| 84 | Hatboro | 8,283 | 448 | 5.4% |
| 85 | West View | 6,533 | 347 | 5.3% |
| 86 | Wilkinsburg | 14,027 | 739 | 5.3% |
| 87 | Elizabet | 11,925 | 628 | 5.3% |
| 88 | McKees Rocks | 5,786 | 304 | 5.3% |
| 89 | Lititz | 9,619 | 502 | 5.2% |
| 90 | Dunmore | 14,181 | 734 | 5.2% |
| 91 | Coraopolis | 5,417 | 279 | 5.2% |
| 92 | Aliquippa | 9,079 | 466 | 5.1% |
| 93 | Media | 5,870 | 291 | 5.0% |
| 94 | Forest Hills | 6,286 | 303 | 4.8% |
| 95 | Perkasie | 9,216 | 438 | 4.8% |
| 96 | Crafton | 5,961 | 279 | 4.7% |
| 97 | Swissvale | 8,418 | 393 | 4.7% |
| 98 | Ridley Park | 7,261 | 338 | 4.7% |
| 99 | Monaca | 5,519 | 249 | 4.5% |
| 100 | McKeesport | 17,380 | 783 | 4.5% |
Source: U.S. Census ACS 2020-2024. 184 cities with more than 5,000 residents.
Summary
Summary: Hispanic or Latino Populations Across Pennsylvania
According to the most recent data, this is an accurate list if you’re looking for a breakdown of Latino populations for each place across Pennsylvania.
The most Hispanic/Latino cities in Pennsylvania are Reading, Hazleton, Allentown, Kennett Square, Lebanon, Lancaster, York, Norri, Wilkes-Barre, and Coatesville.