
Most Native American places in New York research summary. We used Saturday Night Science to research the New York cities with the highest percentage of Native American residents for 2026. The data comes from the American Community Survey 2020-2024 vintage, which breaks down race by origin.
-
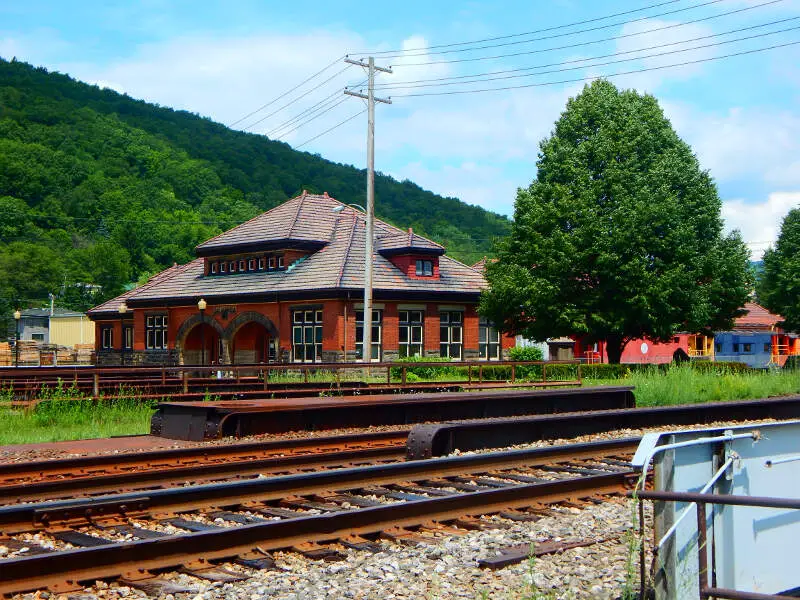
The city with the highest percentage of Native Americans is Salamanca. 16.87% of people in Salamanca are Native Americans.
-
The city with the lowest percentage of Native Americans is Malverne. 0.00% of people in Malverne are Native American.
-
The city with the most Native Americans is New York. 16,347 people in New York are Native American.
-
The city with the fewest Native Americans is Malverne. 0 people in Malverne are Native American.
-
The United States has 1,698,432 Native Americans and is 0.51% Native American.
Table Of Contents: Top Ten | Methodology | Summary | Table
The 10 Cities In New York With The Largest Native American Population For 2026
Which city in New York had the largest Native American population? The place with the largest Native American population in New York for 2026 is Salamanca. 16.87 of Salamanca identify as Native American.
To see where New York ranked as a state on diversity, we have a ranking of the most diverse states in America.
And if you already knew these places were Native American, check out the best places to live in New York or the most diverse places in New York.
Read below to see how we crunched the numbers and how your town ranked.
Cities In New York With The Largest Native American Population For 2026

/10
Population: 5,846
# Of Native American Residents: 986
% Native American: 16.87%
More on Salamanca: Data | Crime | Cost Of Living | Movers

/10
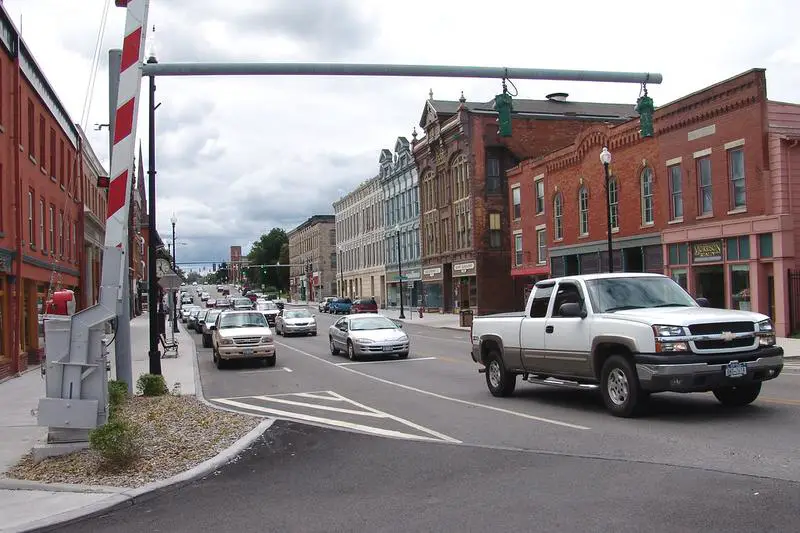
Population: 5,506
# Of Native American Residents: 51
% Native American: 0.93%
More on Albion: Data | Crime | Cost Of Living | Movers

/10
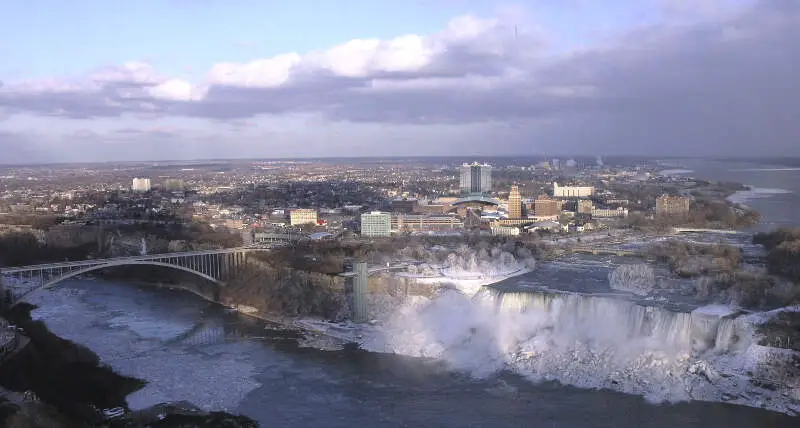
Population: 47,987
# Of Native American Residents: 351
% Native American: 0.73%
More on Niagara Falls: Data | Crime | Cost Of Living | Movers

/10
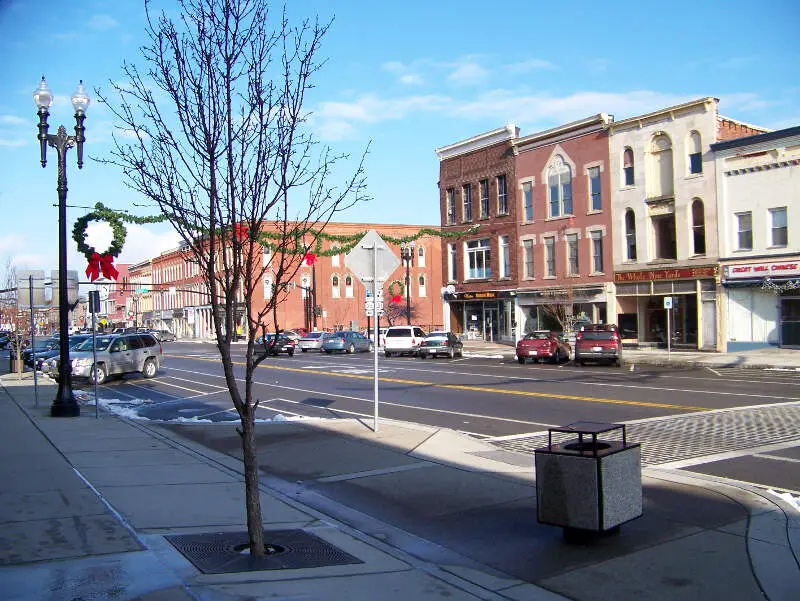
Population: 5,770
# Of Native American Residents: 39
% Native American: 0.68%
More on Medina: Data | Crime | Cost Of Living | Movers

/10
Population: 8,652
# Of Native American Residents: 57
% Native American: 0.66%
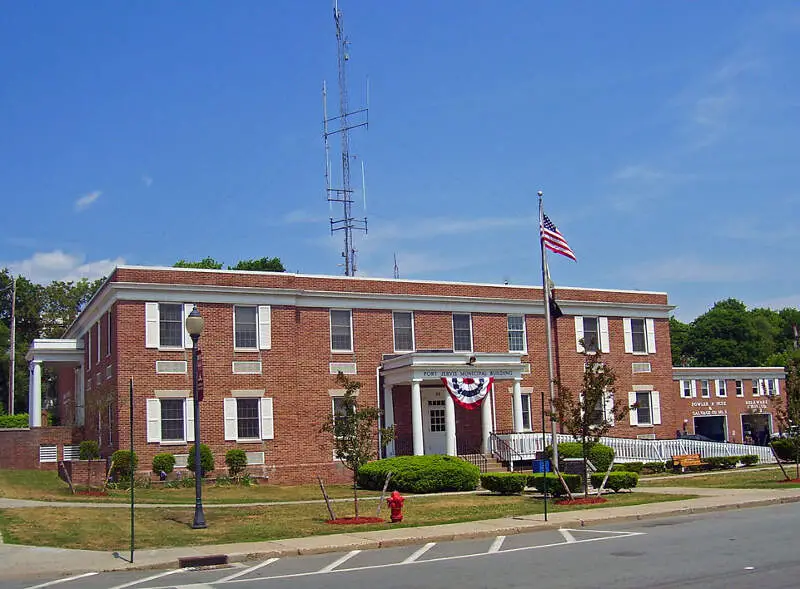
More on Port Jervis: Data | Crime | Cost Of Living | Movers

/10
Population: 19,830
# Of Native American Residents: 117
% Native American: 0.59%
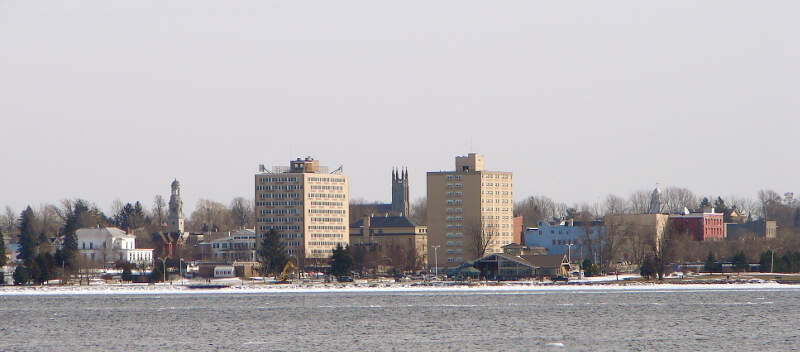
More on Plattsburgh: Data | Cost Of Living | Movers

/10
Population: 10,238
# Of Native American Residents: 59
% Native American: 0.58%
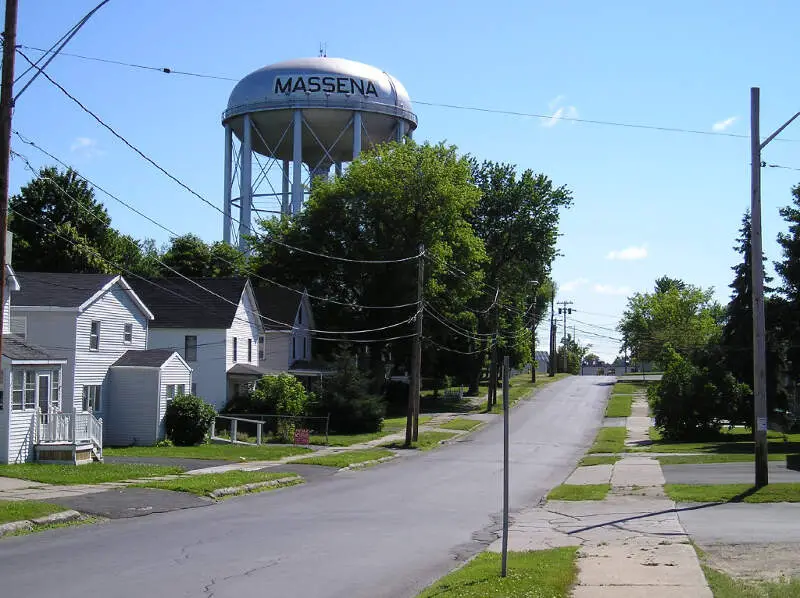
More on Massena: Data | Crime | Cost Of Living | Movers

/10
Population: 9,455
# Of Native American Residents: 47
% Native American: 0.5%
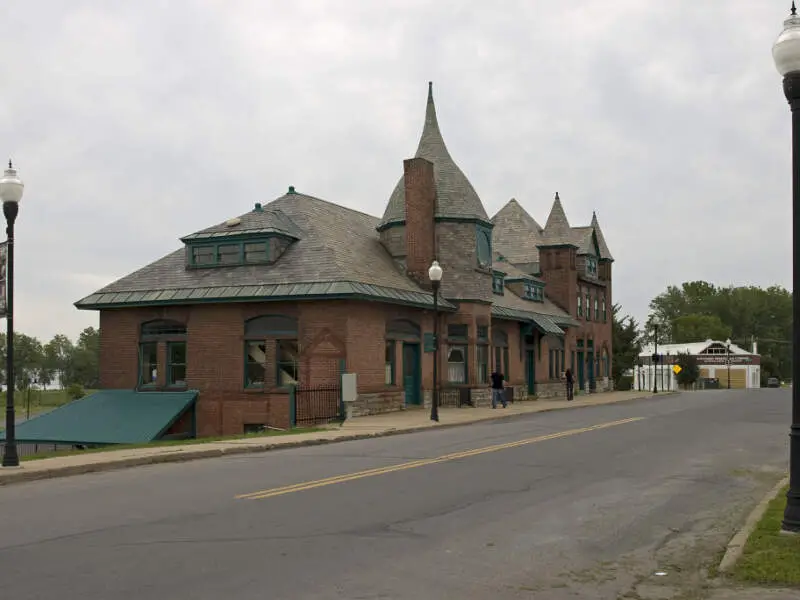
More on Ogdensburg: Data | Crime | Cost Of Living | Movers

/10
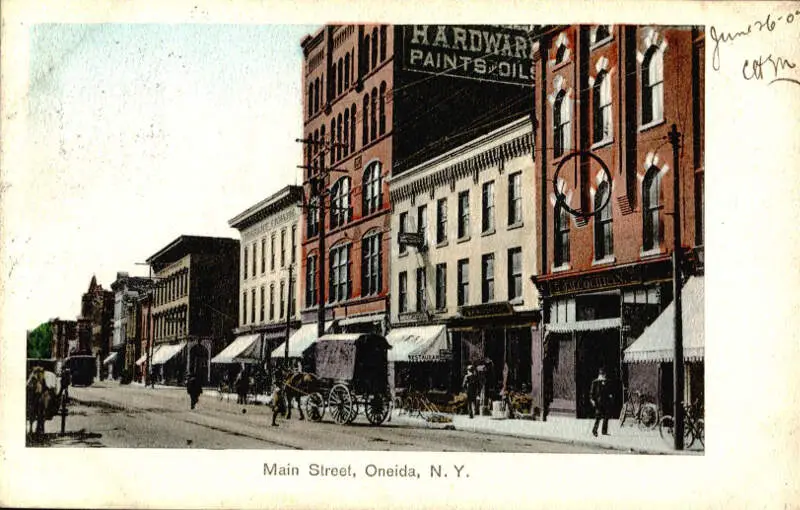
Population: 10,171
# Of Native American Residents: 48
% Native American: 0.47%
More on Oneida: Data | Crime | Cost Of Living | Movers

/10
Population: 15,044
# Of Native American Residents: 69
% Native American: 0.46%
More on Kenmore: Data | Crime | Cost Of Living | Movers
Methodology: How We Determined The Cities In New York With The Largest Native American Population For 2026
We still believe in the accuracy of data — especially from the Census. So that’s where we went to get the race breakdown across New York.
We used Saturday Night Science to analyze the Census’s most recently available data, the 2020-2024 American Community Survey data.
Specifically, we looked at table B03002: Hispanic OR LATINO ORIGIN BY RACE. Here are the category names as defined by the Census:
- Hispanic or Latino
- White alone*
- Black or African American alone*
- American Indian and Alaska Native alone*
- Asian alone*
- Native Hawaiian and Other Pacific Islander alone*
- Some other race alone*
- Two or more races*
Our particular column of interest here was the number of people identifying as American Indian and Alaska Native alone.
We limited our analysis to places with a population greater than 5,000 people. That left us with 162 cities.
We then calculated the percentage of residents that are American Indian and Alaska Native. The percentages ranked from 16.87 to 0.00.
Finally, we ranked each city based on the percentage of the American Indian and Alaska Native population, with a higher score being more American Indian and Alaska Native than a lower score. Salamanca took the distinction of being the most American Indian and Alaska Native, while Malverne was the least Native American city.
We updated this article for 2026. This article is our eleventh time ranking the cities in New York with the largest Native American population.
Summary: Native American Populations Across New York
If you’re looking for a breakdown of Native American populations across New York according to the most recent data, this is an accurate list.
The most Native American cities in New York are Salamanca, Albion, Niagara Falls, Medina, Port Jervis, Plattsburgh, Massena, Ogdensburg, Oneida, and Kenmore.
If you’re curious enough, here are the least Native American places in New York:
- Malverne
- Great Neck
- New Hyde Park
For more New York reading, check out:
- Best Places To Raise A Family In New York
- Best Places To Retire In New York
- Best Counties To Live In New York
Most Native American Places In New York
| Rank | City | Population | Native American Population | % Native American |
|---|---|---|---|---|
| 1 | Salamanca | 5,846 | 986 | 16.87% |
| 2 | Albion | 5,506 | 51 | 0.93% |
| 3 | Niagara Falls | 47,987 | 351 | 0.73% |
| 4 | Medina | 5,770 | 39 | 0.68% |
| 5 | Port Jervis | 8,652 | 57 | 0.66% |
| 6 | Plattsburgh | 19,830 | 117 | 0.59% |
| 7 | Massena | 10,238 | 59 | 0.58% |
| 8 | Ogdensburg | 9,455 | 47 | 0.5% |
| 9 | Oneida | 10,171 | 48 | 0.47% |
| 10 | Kenmore | 15,044 | 69 | 0.46% |
| 11 | Lancaster | 10,113 | 46 | 0.45% |
| 12 | Solvay | 6,544 | 26 | 0.4% |
| 13 | Mamaroneck | 19,826 | 76 | 0.38% |
| 14 | Syracuse | 146,384 | 541 | 0.37% |
| 15 | Larchmont | 6,567 | 21 | 0.32% |
| 16 | Warwick | 6,585 | 20 | 0.3% |
| 17 | Norwich | 6,782 | 20 | 0.29% |
| 18 | Buffalo | 276,854 | 790 | 0.29% |
| 19 | Elmira | 26,257 | 74 | 0.28% |
| 20 | Schenectady | 68,847 | 182 | 0.26% |
| 21 | Ithaca | 32,814 | 85 | 0.26% |
| 22 | Lockport | 20,610 | 51 | 0.25% |
| 23 | Potsdam | 8,427 | 20 | 0.24% |
| 24 | Hilton | 5,968 | 14 | 0.23% |
| 25 | Suffern | 11,441 | 24 | 0.21% |
| 26 | Bath | 5,560 | 11 | 0.2% |
| 27 | Auburn | 26,285 | 52 | 0.2% |
| 28 | New York | 8,483,844 | 16,347 | 0.19% |
| 29 | Jamestown | 28,188 | 54 | 0.19% |
| 30 | Binghamton | 47,151 | 86 | 0.18% |
| 31 | New Hempstead | 5,472 | 9 | 0.16% |
| 32 | Rye | 16,428 | 27 | 0.16% |
| 33 | Rochester | 208,772 | 337 | 0.16% |
| 34 | Lynbrook | 20,325 | 32 | 0.16% |
| 35 | Canton | 7,167 | 11 | 0.15% |
| 36 | New Rochelle | 82,769 | 127 | 0.15% |
| 37 | Lackawanna | 19,753 | 30 | 0.15% |
| 38 | Saratoga Springs | 28,631 | 43 | 0.15% |
| 39 | Yonkers | 209,978 | 315 | 0.15% |
| 40 | Wesley Hills | 6,196 | 9 | 0.15% |
| 41 | Oneonta | 15,045 | 21 | 0.14% |
| 42 | Rome | 31,795 | 44 | 0.14% |
| 43 | Utica | 64,217 | 81 | 0.13% |
| 44 | Amityville | 9,588 | 12 | 0.13% |
| 45 | Tonawanda | 15,030 | 18 | 0.12% |
| 46 | Mechanicville | 5,124 | 6 | 0.12% |
| 47 | Freeport | 44,088 | 46 | 0.1% |
| 48 | Troy | 51,033 | 47 | 0.09% |
| 49 | Westbury | 15,808 | 14 | 0.09% |
| 50 | Massapequa Park | 16,963 | 15 | 0.09% |
| 51 | Port Jefferson | 8,091 | 7 | 0.09% |
| 52 | New Paltz | 8,314 | 7 | 0.08% |
| 53 | Mount Vernon | 72,427 | 60 | 0.08% |
| 54 | Briarcliff Manor | 7,519 | 6 | 0.08% |
| 55 | North Tonawanda | 30,198 | 21 | 0.07% |
| 56 | Hudson Falls | 7,395 | 5 | 0.07% |
| 57 | Beacon | 14,834 | 10 | 0.07% |
| 58 | Newark | 8,991 | 6 | 0.07% |
| 59 | Peekskill | 25,625 | 17 | 0.07% |
| 60 | Lindenhurst | 27,142 | 18 | 0.07% |
| 61 | Fulton | 11,272 | 7 | 0.06% |
| 62 | Cohoes | 18,159 | 11 | 0.06% |
| 63 | Hempstead | 58,801 | 33 | 0.06% |
| 64 | Rensselaer | 9,287 | 5 | 0.05% |
| 65 | Oswego | 17,033 | 9 | 0.05% |
| 66 | East Aurora | 5,993 | 3 | 0.05% |
| 67 | Albany | 100,492 | 49 | 0.05% |
| 68 | Floral Park | 16,169 | 7 | 0.04% |
| 69 | Depew | 15,000 | 6 | 0.04% |
| 70 | Airmont | 10,205 | 4 | 0.04% |
| 71 | Kingston | 23,911 | 9 | 0.04% |
| 72 | Glen Cove | 28,112 | 10 | 0.04% |
| 73 | Amsterdam | 18,166 | 6 | 0.03% |
| 74 | Corning | 10,643 | 3 | 0.03% |
| 75 | Scotia | 7,264 | 2 | 0.03% |
| 76 | Batavia | 15,097 | 4 | 0.03% |
| 77 | Kiryas Joel | 38,916 | 10 | 0.03% |
| 78 | Glens Falls | 14,609 | 3 | 0.02% |
| 79 | Scarsdale | 18,010 | 3 | 0.02% |
| 80 | Watertown | 24,375 | 4 | 0.02% |
| 81 | Poughkeepsie | 31,958 | 5 | 0.02% |
| 82 | Spring Valley | 33,192 | 5 | 0.02% |
| 83 | Fredonia | 9,467 | 1 | 0.01% |
| 84 | Washingtonville | 5,707 | 0 | 0.0% |
| 85 | Croton-On-Hudson | 8,202 | 0 | 0.0% |
| 86 | White Plains | 60,666 | 0 | 0.0% |
| 87 | Colonie | 7,702 | 0 | 0.0% |
| 88 | Williamsville | 5,469 | 0 | 0.0% |
| 89 | Rye Brook | 9,900 | 0 | 0.0% |
| 90 | Cortland | 17,450 | 0 | 0.0% |
| 91 | Rockville Centre | 25,765 | 0 | 0.0% |
| 92 | Dobbs Ferry | 11,443 | 0 | 0.0% |
| 93 | Baldwinsville | 7,715 | 0 | 0.0% |
| 94 | Williston Park | 7,542 | 0 | 0.0% |
| 95 | Dunkirk | 12,549 | 0 | 0.0% |
| 96 | East Hills | 7,257 | 0 | 0.0% |
| 97 | East Rochester | 6,218 | 0 | 0.0% |
| 98 | Port Chester | 31,102 | 0 | 0.0% |
| 99 | Woodbury | 11,334 | 0 | 0.0% |
| 100 | Chestnut Ridge | 10,557 | 0 | 0.0% |