Are you looking for love in Washington?
Or are you just hoping to hook up with a hot Washingtonian?
Either way, we’ve got you covered here.
If you live in Washington, there’s a pretty good chance there are a lot of singles in your area. The Evergreen State has plenty of people over 18 who aren’t married or in a serious relationship.
That’s great news for people who are single and looking to mingle.
So, where are the best cities for singles in Washington? We used Saturday Night Science to find out.
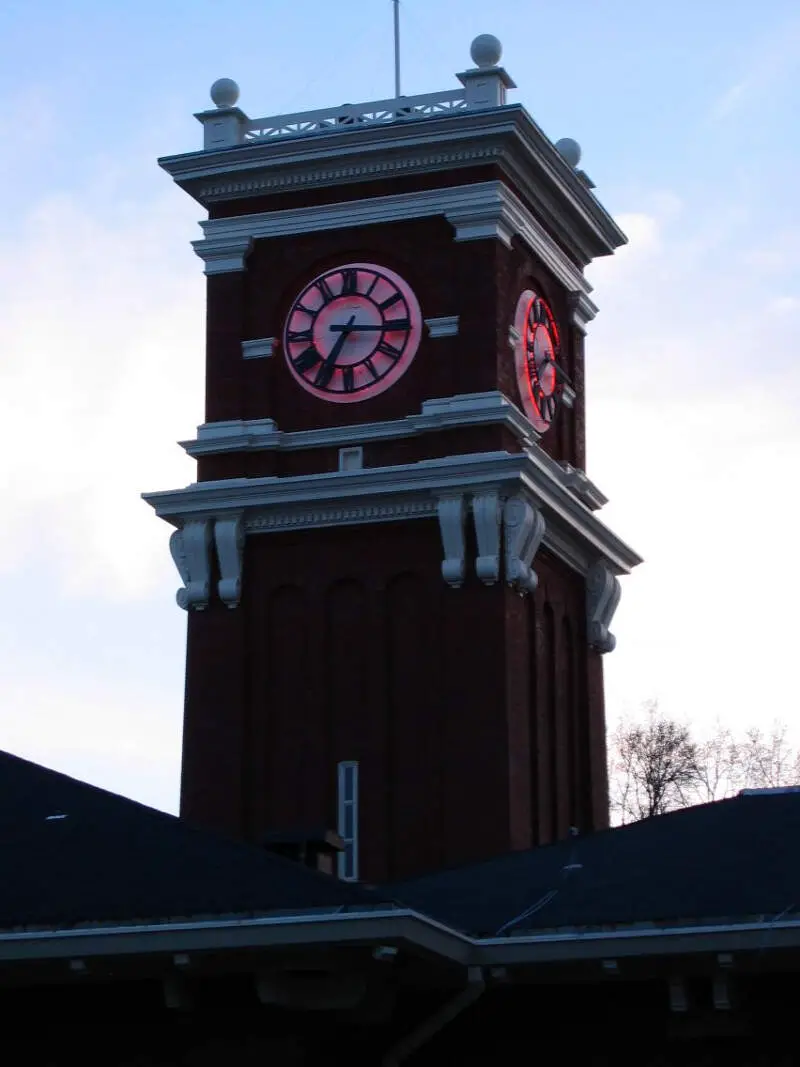
23.2 median age · 7.0% married households
Pullman is the largest city in Whitman County, located in southeastern Washington state within the Palouse region of the Pacific Northwest. The population was 29,799 at the 2010 census, estimated to have reached 31,682 in 2014. Originally incorporated as Three Forks, the city was later renamed after industrialist George Pullman.
Data | Crime | Cost of living | Movers
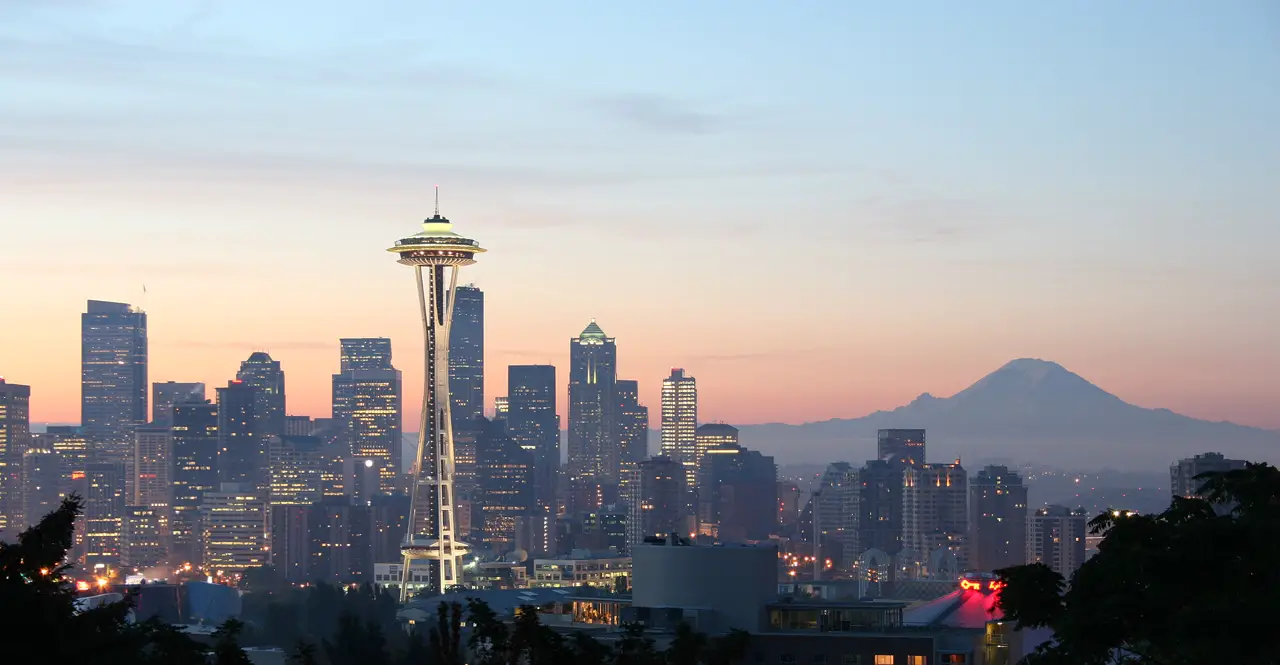
35.6 median age · 9.0% married households
Seattle ) is a seaport city on the west coast of the United States. It is the seat of King County, Washington. With an estimated 704,352 residents as of 2016, Seattle is the largest city in both the state of Washington and the Pacific Northwest region of North America. In July 2013, it was the fastest-growing major city in the United States and remained in the Top 5 in May 2015 with an annual growth rate of 2.1%. In July 2016, Seattle was again the fastest-growing major U.S. city, with a 3.1% annual growth rate. The city is situated on an isthmus between Puget Sound and Lake Washington, about 100 miles south of the Canada-United States border. A major gateway for trade with Asia, Seattle is the fourth-largest port in North America in terms of container handling as of 2015.
Data | Crime | Cost of living | Movers
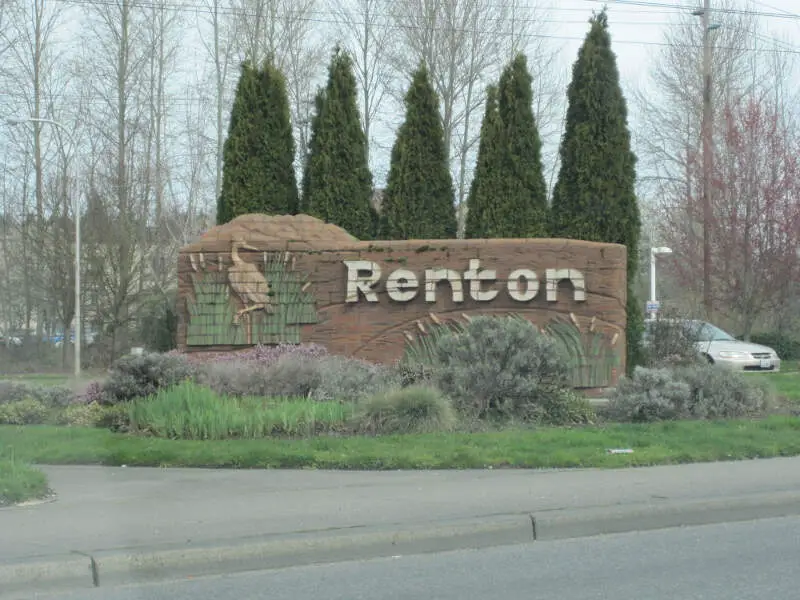
36.5 median age · 12.0% married households
Renton is a city in King County, Washington, United States. Situated 11 miles southeast of downtown Seattle, Washington, Renton straddles the southeast shore of Lake Washington, at the mouth of the Cedar River. While long an important salmon fishing area for Native Americans, Renton was first settled by people of European descent in the 1860s, and its early economy was based on coal mining, clay production, and timber export. Today, Renton is best known as the final assembly point for the Boeing 737 family of commercial airplanes, but it is also home to a growing number of well known manufacturing, technology, and healthcare organizations, including Boeing Commercial Airplanes Division, Paccar, Kaiser Permanente, IKEA, Providence Health & Services, and Wizards of the Coast. As of 2016, the population in Renton is 101,300, up from 90,927 at the 2010 census. Renton currently is the 8th largest city in Washington State, and is the 4th largest in King County. The National Football League’s Seattle Seahawks have a training facility in Renton. It is the second-largest facility in the NFL at 200,000 square feet.
Data | Crime | Cost of living | Movers
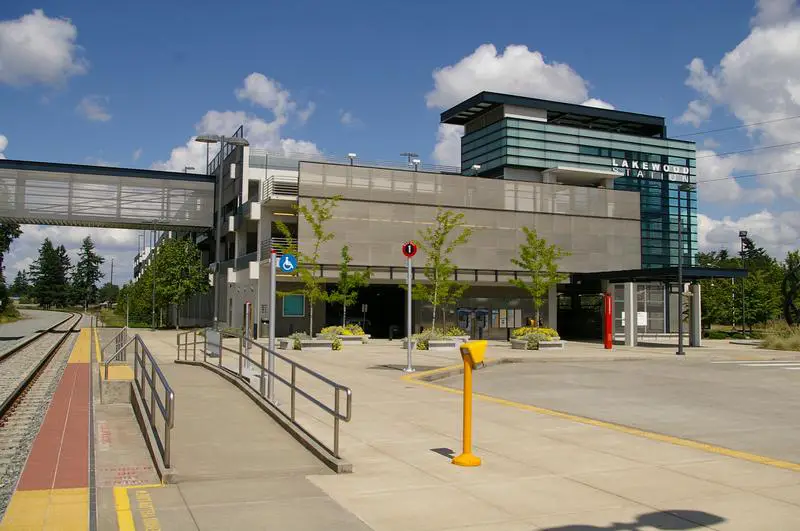
37.4 median age · 11.0% married households
Lakewood is a city in Pierce County, Washington, United States. The population was 58,163 at the 2010 census.
Data | Crime | Cost of living | Movers
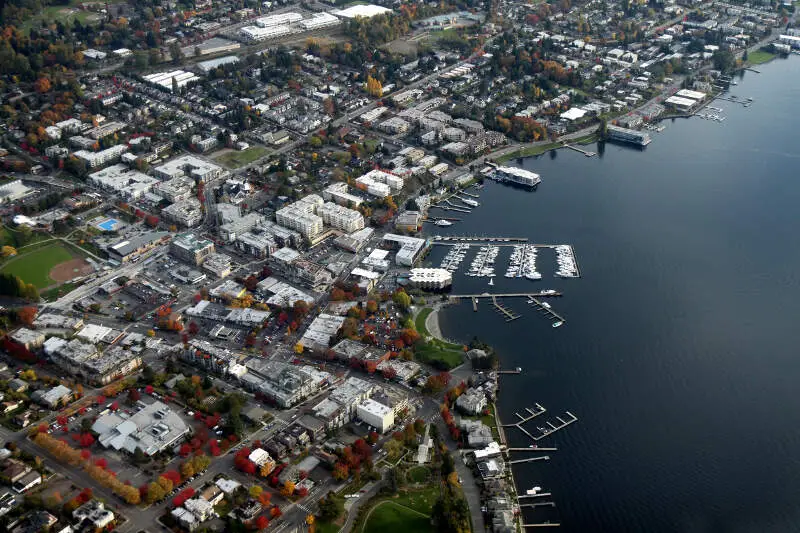
38.3 median age · 13.0% married households
Kirkland is a city in King County, Washington, United States. A suburb east of Seattle, its population was 87,281 at the 2015 census estimate, which made it the sixth largest city in the county and the twelfth largest in the state.
Data | Crime | Cost of living | Movers
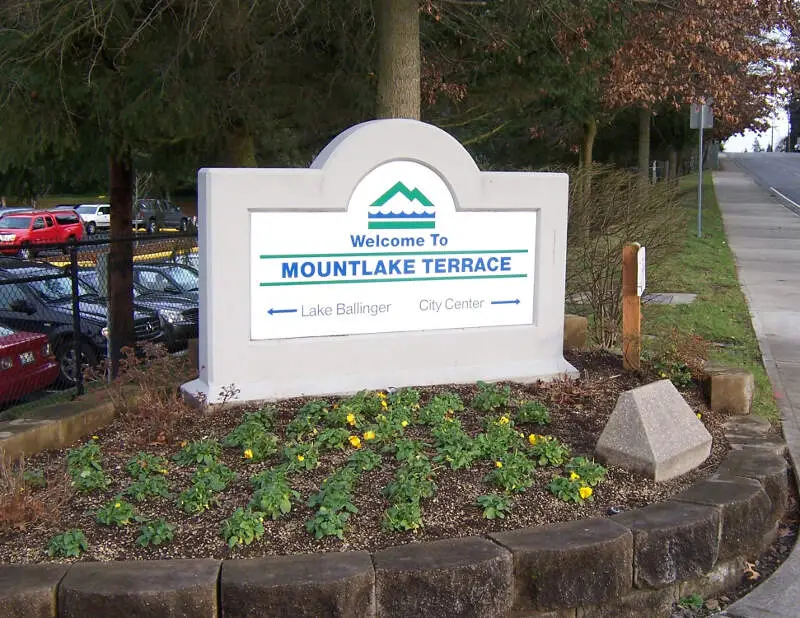
38.3 median age · 14.0% married households
Mountlake Terrace is a city in Snohomish County, Washington, United States. It is a northern suburb of Seattle and lies north of Shoreline and Lake Forest Park, east of Edmonds, south of Lynnwood, and west of Brier. Its southern boundary runs along the King County line. Interstate 5 runs north-south through the city, and services the city via three exits. The population was 19,909 at the 2010 census.
Data | Crime | Cost of living | Movers
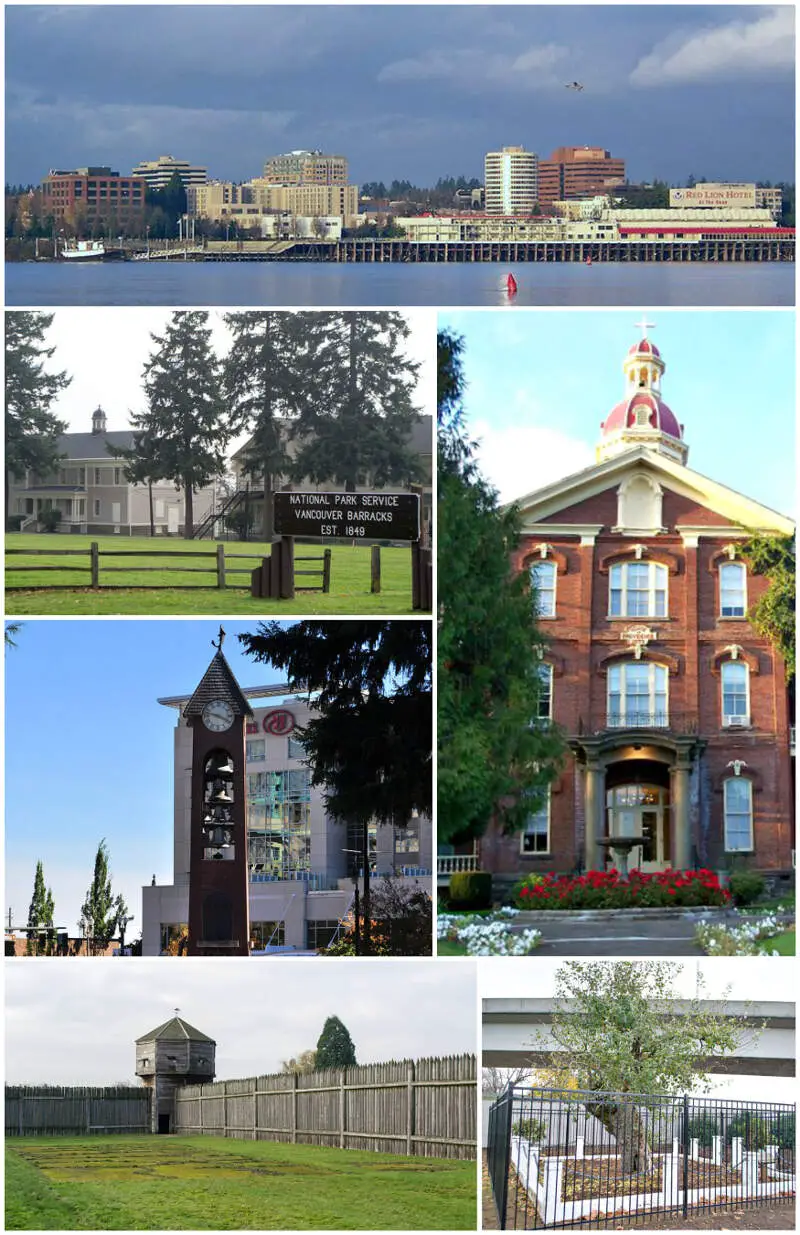
37.9 median age · 9.0% married households
Vancouver is a city on the north bank of the Columbia River in the U.S. State of Washington, and the largest suburb of Portland, Oregon. Incorporated in 1857, it is the fourth largest city in the state, with a population of 161,791 as of April 1, 2010 census. Vancouver is the county seat of Clark County and forms part of the Portland-Vancouver metropolitan area, the 23rd largest metropolitan area in the United States. Originally established in 1825 around Fort Vancouver, a fur-trading outpost, the city is located on the Washington-Oregon border along the Columbia River, directly north of Portland. In 2005, Money magazine named it No. 91 on its list of best places in America to live. In 2016, WalletHub ranks Vancouver the 39th best place in the US for families to live.
Data | Crime | Cost of living | Movers
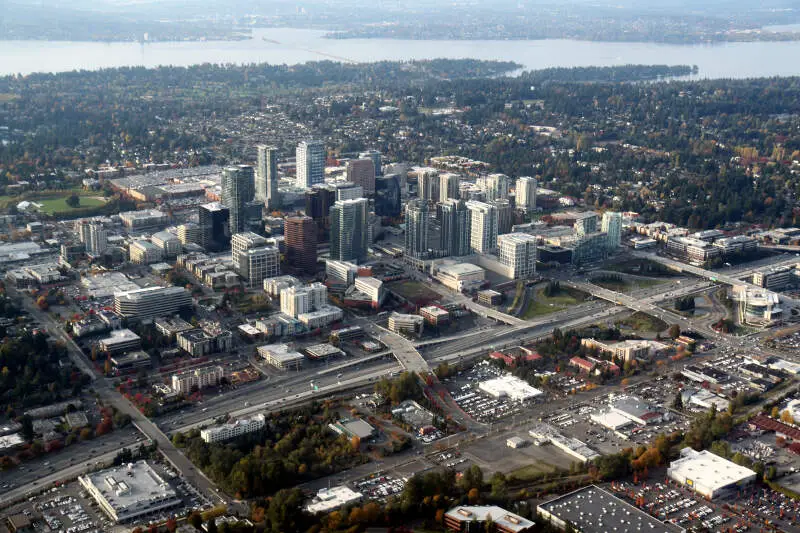
38.5 median age · 8.0% married households
Data | Crime | Cost of living | Movers
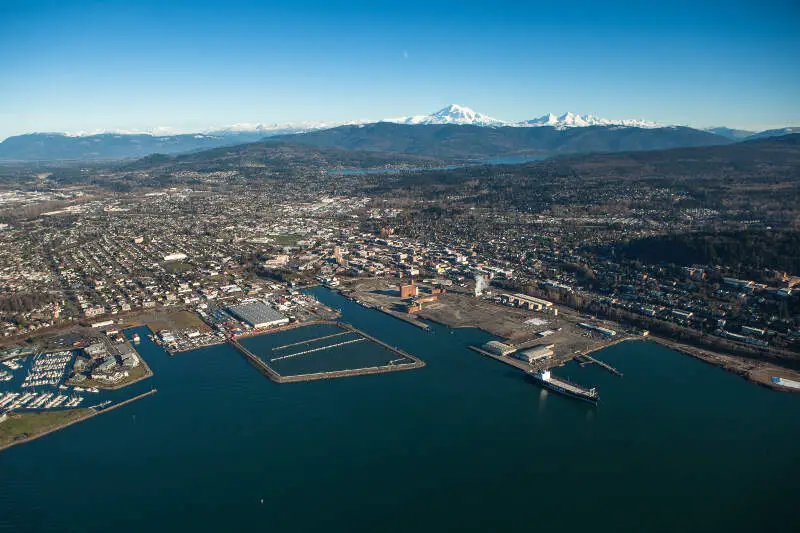
34.1 median age · 12.0% married households
Bellingham is the largest city in and the county seat of Whatcom County in the U.S. state of Washington. It is the thirteenth-largest city in the state, with 80,885 residents as of the 2010 US Census, and is part of the sixth-largest metropolitan area in the state. The boundaries of the city encompass the former towns of Fairhaven, Whatcom, Sehome, and Bellingham.
Data | Crime | Cost of living | Movers
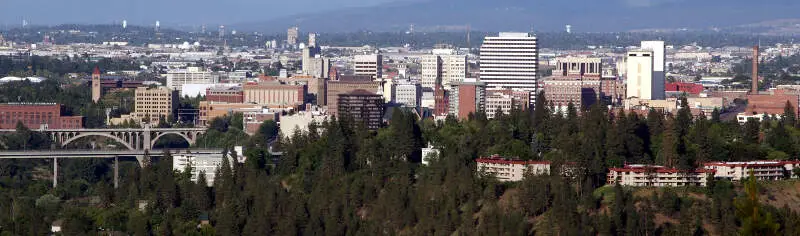
37.2 median age · 18.0% married households
Spokane spoh-KAN) is a city located in the state of Washington in the northwestern United States. It is located along the Spokane River west of the Rocky Mountain foothills in eastern Washington, 92 miles south of the Canada-US border, approximately 20 miles from the Washington-Idaho border, and 280 miles east of Seattle along Interstate 90.
Data | Crime | Cost of living | Movers
The receipts
Compare the top ten
Pick a metric. The bars rescale. The red line is Washington’s statewide median.
On the map
Where Washington’s singles cluster
Saturday Night Science
Methodology: How do you determine which city is best for singles in Washington anyways?
To give you the places in Washington which are best for singles to find one another, we used Saturday Night Science to look at a handful of metrics. Of course, we want to measure the type of people who live in each city and make some assumptions about what single people like.
So we researched the internet for a database that contains all that information.
We threw a lot of criteria at this one to get the best, most complete results possible. Using the 2020-2024 American Community Survey Census data produced for the state of Washington, we looked at every single city in the state. We paid particular attention to:
- Population density
- % of population that’s male vs. female (closer to a 50-50 ratio is better)
- % of households with kids
- Median age
- Number of unmarried people in each city
We then gave each city a “Singles Score.”
The higher the score, the better the city is for singles to find one another. We also limited our results to cities with over 10,000 people. For Washington, that meant a total of 91 cities.
We updated this article for 2026. This is our eleventh time ranking the best cities for singles in Washington.
Read on to see why Pullman is the talk of the town while Edgewood is probably a bit on the bland side.
The full plate
Best Cities For Singles In Washington
Click any column to sort. Search by city name.
| Rank | City | Singles Score | Population | Median Age | % Married Households | % Households w/ Kids |
|---|---|---|---|---|---|---|
| 1 | Pullman | 14.40 | 32,229 | 23.2 | 7.0% | 18.5% |
| 2 | Seattle | 15.00 | 754,195 | 35.6 | 9.0% | 17.4% |
| 3 | Renton | 25.30 | 105,317 | 36.5 | 12.0% | 30.5% |
| 4 | Lakewood | 25.40 | 62,937 | 37.4 | 11.0% | 26.7% |
| 5 | Kirkland | 25.80 | 92,621 | 38.3 | 13.0% | 27.9% |
| 6 | Mountlake Terrace | 25.90 | 23,104 | 38.3 | 14.0% | 24.3% |
| 7 | Vancouver | 26.00 | 195,300 | 37.9 | 9.0% | 26.6% |
| 8 | Bellevue | 26.60 | 151,847 | 38.5 | 8.0% | 29.1% |
| 9 | Bellingham | 28.00 | 93,438 | 34.1 | 12.0% | 18.9% |
| 10 | Spokane | 29.20 | 230,293 | 37.2 | 18.0% | 25.9% |
| 11 | Tacoma | 29.40 | 222,758 | 37.2 | 16.0% | 27.2% |
| 12 | Redmond | 32.50 | 77,353 | 35.0 | 5.0% | 31.1% |
| 13 | Lynnwood | 33.00 | 40,110 | 37.5 | 11.0% | 29.1% |
| 14 | Federal Way | 33.80 | 99,493 | 37.4 | 11.0% | 30.7% |
| 15 | Cheney | 34.20 | 12,804 | 24.4 | 12.0% | 23.7% |
| 16 | Lacey | 34.80 | 57,737 | 37.3 | 11.0% | 27.2% |
| 17 | Grandview | 34.80 | 11,187 | 29.1 | 8.0% | 48.2% |
| 18 | Kent | 35.50 | 135,603 | 35.5 | 11.0% | 35.8% |
| 19 | Ellensburg | 36.20 | 20,874 | 25.0 | 16.0% | 21.8% |
| 20 | Sunnyside | 36.20 | 16,277 | 27.1 | 9.0% | 47.7% |
| 21 | Shoreline | 36.70 | 61,431 | 42.9 | 17.0% | 27.3% |
| 22 | Everett | 37.80 | 111,845 | 37.2 | 13.0% | 26.6% |
| 23 | Fife | 38.00 | 10,949 | 31.3 | 12.0% | 37.7% |
| 24 | Kennewick | 39.30 | 85,295 | 35.7 | 16.0% | 32.3% |
| 25 | Yakima | 39.80 | 96,961 | 34.3 | 18.0% | 35.1% |
| 26 | Bremerton | 40.00 | 44,830 | 33.2 | 10.0% | 26.1% |
| 27 | Oak Harbor | 40.20 | 24,362 | 31.5 | 8.0% | 36.6% |
| 28 | Battle Ground | 40.60 | 21,886 | 33.9 | 12.0% | 40.5% |
| 29 | Tukwila | 40.70 | 21,451 | 35.4 | 9.0% | 27.1% |
| 30 | Wenatchee | 40.80 | 35,484 | 35.9 | 21.0% | 31.1% |
| 31 | Aberdeen | 40.80 | 17,088 | 37.7 | 16.0% | 25.9% |
| 32 | Burien | 41.00 | 51,513 | 40.4 | 13.0% | 29.8% |
| 33 | Issaquah | 41.30 | 39,591 | 37.5 | 11.0% | 29.9% |
| 34 | Des Moines | 41.80 | 32,823 | 38.0 | 14.0% | 30.2% |
| 35 | Olympia | 42.20 | 55,951 | 40.5 | 12.0% | 23.5% |
| 36 | Mill Creek | 42.20 | 20,956 | 39.3 | 18.0% | 32.3% |
| 37 | Port Angeles | 42.60 | 20,118 | 42.6 | 15.0% | 22.3% |
| 38 | Walla Walla | 43.10 | 33,925 | 37.4 | 14.0% | 24.1% |
| 39 | Lake Forest Park | 43.40 | 13,335 | 42.1 | 17.0% | 27.6% |
| 40 | Sedro-Woolley | 43.60 | 12,831 | 34.0 | 21.0% | 35.1% |
| 41 | Auburn | 43.80 | 85,676 | 36.0 | 14.0% | 34.8% |
| 42 | Yelm | 44.00 | 11,102 | 31.0 | 12.0% | 44.9% |
| 43 | Pasco | 44.20 | 79,575 | 30.3 | 15.0% | 48.8% |
| 44 | SeaTac | 45.40 | 32,414 | 36.8 | 9.0% | 31.5% |
| 45 | Kenmore | 46.50 | 23,741 | 39.1 | 14.0% | 28.8% |
| 46 | Lake Stevens | 47.20 | 40,253 | 34.7 | 21.0% | 47.1% |
| 47 | Spokane Valley | 47.30 | 106,365 | 38.3 | 20.0% | 28.4% |
| 48 | Moses Lake | 47.50 | 26,083 | 32.3 | 22.0% | 33.2% |
| 49 | Puyallup | 48.00 | 42,746 | 36.5 | 19.0% | 29.9% |
| 50 | Washougal | 48.00 | 17,490 | 38.4 | 12.0% | 34.7% |
| 51 | Burlington | 48.10 | 10,003 | 35.7 | 15.0% | 31.3% |
| 52 | Covington | 48.60 | 21,233 | 36.4 | 20.0% | 36.0% |
| 53 | Newcastle | 48.60 | 12,989 | 37.5 | 12.0% | 29.9% |
| 54 | Mukilteo | 49.80 | 21,323 | 42.8 | 16.0% | 30.2% |
| 55 | Marysville | 50.50 | 73,002 | 38.0 | 21.0% | 33.1% |
| 56 | Shelton | 50.60 | 10,612 | 32.5 | 15.0% | 34.1% |
| 57 | Camas | 50.80 | 27,007 | 40.7 | 11.0% | 45.2% |
| 58 | Centralia | 51.00 | 18,830 | 39.0 | 16.0% | 26.3% |
| 59 | Longview | 51.30 | 38,069 | 40.1 | 16.0% | 27.0% |
| 60 | Richland | 51.40 | 62,753 | 36.4 | 17.0% | 29.8% |
| 61 | Maple Valley | 51.80 | 28,287 | 36.7 | 19.0% | 51.3% |
| 62 | Anacortes | 51.80 | 17,966 | 50.5 | 18.0% | 23.0% |
| 63 | Sammamish | 51.90 | 66,463 | 39.9 | 10.0% | 51.1% |
| 64 | Mount Vernon | 52.10 | 35,377 | 36.0 | 18.0% | 35.0% |
| 65 | Kelso | 52.30 | 12,684 | 39.9 | 25.0% | 26.8% |
| 66 | Airway Heights | 52.40 | 11,245 | 33.1 | 10.0% | 34.0% |
| 67 | Bothell | 52.50 | 49,610 | 38.6 | 17.0% | 34.2% |
| 68 | Edmonds | 52.60 | 42,735 | 46.9 | 21.0% | 23.4% |
| 69 | Mercer Island | 53.70 | 25,307 | 46.4 | 14.0% | 32.0% |
| 70 | Enumclaw | 54.50 | 12,798 | 42.1 | 28.0% | 26.8% |
| 71 | Arlington | 54.70 | 21,095 | 36.6 | 22.0% | 36.4% |
| 72 | Port Orchard | 55.50 | 17,149 | 35.0 | 15.0% | 34.3% |
| 73 | East Wenatchee | 55.70 | 14,199 | 35.4 | 21.0% | 46.3% |
| 74 | Ferndale | 56.20 | 15,999 | 35.1 | 16.0% | 40.4% |
| 75 | Poulsbo | 58.40 | 12,165 | 43.3 | 18.0% | 27.9% |
| 76 | University Place | 58.50 | 34,911 | 40.1 | 19.0% | 31.4% |
| 77 | Bainbridge Island | 58.60 | 24,631 | 49.0 | 15.0% | 30.1% |
| 78 | Port Townsend | 58.80 | 10,438 | 60.8 | 13.0% | 16.1% |
| 79 | Monroe | 59.50 | 19,755 | 35.7 | 19.0% | 39.0% |
| 80 | Tumwater | 60.50 | 26,956 | 37.1 | 19.0% | 28.5% |
| 81 | Snohomish | 60.50 | 10,239 | 42.5 | 20.0% | 29.0% |
| 82 | Lynden | 60.60 | 16,234 | 35.2 | 23.0% | 34.2% |
| 83 | Woodinville | 62.00 | 13,438 | 40.8 | 15.0% | 31.2% |
| 84 | Ridgefield | 63.10 | 13,408 | 35.7 | 13.0% | 44.0% |
| 85 | Sumner | 64.00 | 10,733 | 37.6 | 21.0% | 32.2% |
| 86 | Gig Harbor | 64.20 | 12,424 | 46.6 | 16.0% | 24.4% |
| 87 | West Richland | 64.40 | 17,586 | 35.5 | 24.0% | 44.0% |
| 88 | Bonney Lake | 65.60 | 22,090 | 36.9 | 27.0% | 46.5% |
| 89 | Snoqualmie | 67.60 | 13,798 | 38.9 | 18.0% | 54.7% |
| 90 | Liberty Lake | 75.20 | 12,737 | 37.1 | 24.0% | 39.5% |
| 91 | Edgewood | 76.30 | 13,032 | 38.8 | 20.0% | 37.3% |
Source: U.S. Census ACS 2020-2024. 91 cities with more than 10,000 residents.
Summary
Summary: The Best Cities For Singles In Washington For 2026
If you’re looking for a breakdown of cities in Washington ranked by criteria that most agree make a place a great spot for finding a single person (and potentially love), this is an accurate list.
The best cities for singles in Washington are Pullman, Seattle, Renton, Lakewood, Kirkland, Mountlake Terrace, Vancouver, Bellevue, Bellingham, and Spokane.