Everyone wants a bit of a blissful breeze or a scoop of sunny sanctuary when looking for a place to live in Indiana.
The more sun, the more you can go outside. The more you go outside, the more you’ll feel at peace. The more you’ll feel at peace, the more you’ll enjoy where you live.
So it makes sense to try and find the places with the best weather in Indiana. We used Saturday Night Science to compare the number of sunny days, total precipitation, and the deviation from the ideal 70-degree weather for 78 places in Indiana over 10,000 people.
Grab your shades and put away your raincoat as we look at the cities with the best weather in Indiana.
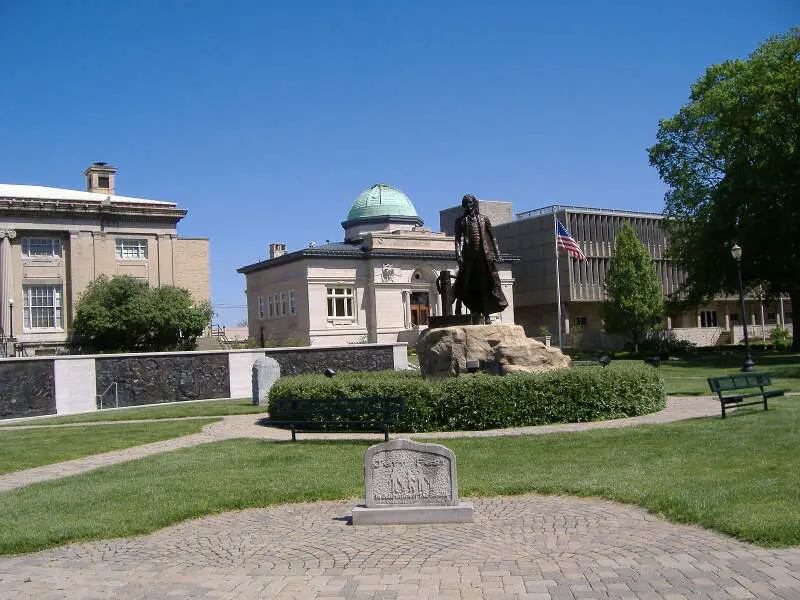
290.8 sunny days · 67.0 degree average high
Jeffersonville is a city in Clark County, Indiana, along the Ohio River. Locally, the city is often referred to by the abbreviated name Jeff. It is directly across the Ohio River to the north of Louisville, Kentucky, along I-65. The population was 44,953 at the 2010 census. The city is the county seat of Clark County.
Data | Crime | Cost of living | Movers
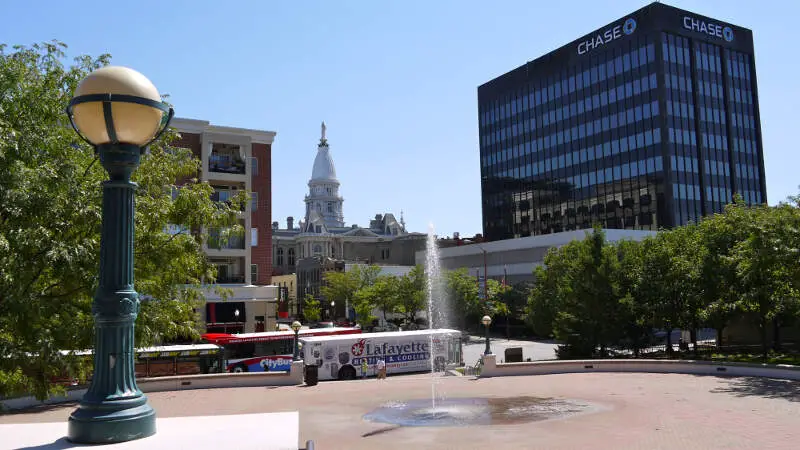
294.4 sunny days · 62.2 degree average high
Lafayette is a city in and the county seat of Tippecanoe County, Indiana, United States, located 63 miles northwest of Indianapolis and 105 miles southeast of Chicago. West Lafayette, on the other side of the Wabash River, is home to Purdue University, which contributes significantly to both communities. Together, Lafayette and West Lafayette form the core of the Lafayette, Indiana Metropolitan Statistical Area. According to the 2010 United States Census, the population of Lafayette was 67,140, roughly a 19% increase from 56,397 in 2000. Meanwhile, the 2010 U.S. Census pegged the year-round population of West Lafayette at 29,596 and a Tippecanoe County population of 172,780.
Data | Crime | Cost of living | Movers
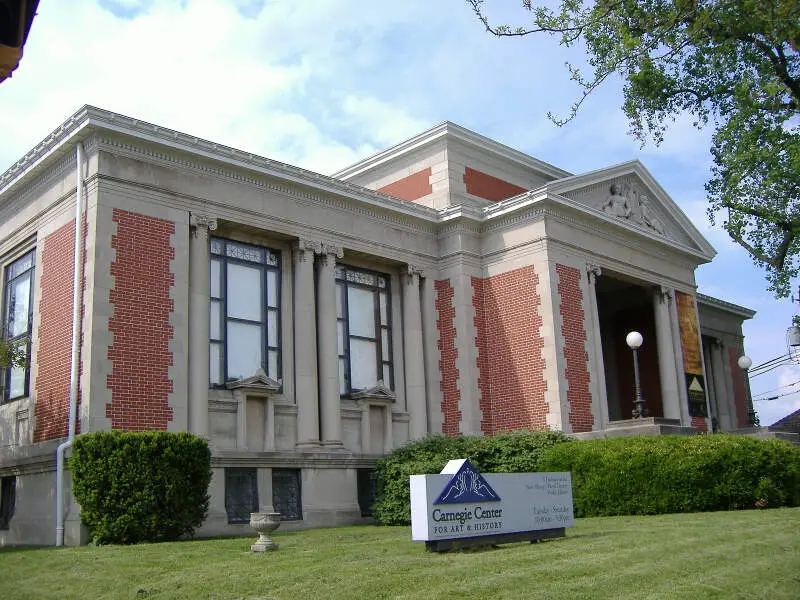
290.2 sunny days · 65.8 degree average high
New Albany is a city in Floyd County, Indiana, United States, situated along the Ohio River opposite Louisville, Kentucky. The population was 36,372 at the 2010 census. The city is the county seat of Floyd County. It is bounded by I-265 to the north and the Ohio River to the south, and is considered part of the Louisville, Kentucky Metropolitan Statistical Area. The mayor of New Albany is Jeff Gahan, a Democrat; he was re-elected in 2015.
Data | Crime | Cost of living | Movers
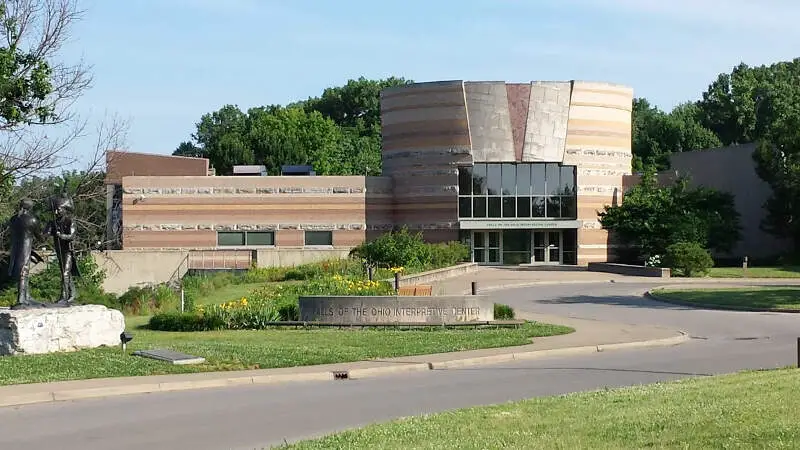
289.9 sunny days · 66.1 degree average high
Clarksville is a town in Clark County, Indiana, United States, along the Ohio River and is a part of the Louisville Metropolitan area. The population was 21,724 at the 2010 census. The town was founded in 1783 by early resident George Rogers Clark at the only seasonal rapids on the entire Ohio River, it is the oldest American town in the former Northwest Territory. The town is home to the Colgate clock, one of the largest clocks in the world and the Falls of the Ohio State Park, home to the world’s largest exposed Devonian period fossil bed.
Data | Crime | Cost of living | Movers
289.9 sunny days · 66.9 degree average high
Evansville is a city in and the county seat of Vanderburgh County, Indiana, United States. The population was 117,429 at the 2010 census, making it the state’s third-most populous city after Indianapolis and Fort Wayne, the largest city in Southern Indiana, and the 232nd-most populous city in the United States. It is the commercial, medical, and cultural hub of Southwestern Indiana and the Illinois-Indiana-Kentucky tri-state area, home to over 911,000 people. The 38th parallel crosses the north side of the city and is marked on Interstate 69.
Data | Crime | Cost of living | Movers
289.6 sunny days · 64.0 degree average high
Data | Crime | Cost of living | Movers
289.4 sunny days · 65.0 degree average high
Washington is a city in Daviess County, Indiana, United States. The population was 11,509 at the 2010 census. The city is the county seat of Daviess County.
Data | Crime | Cost of living | Movers
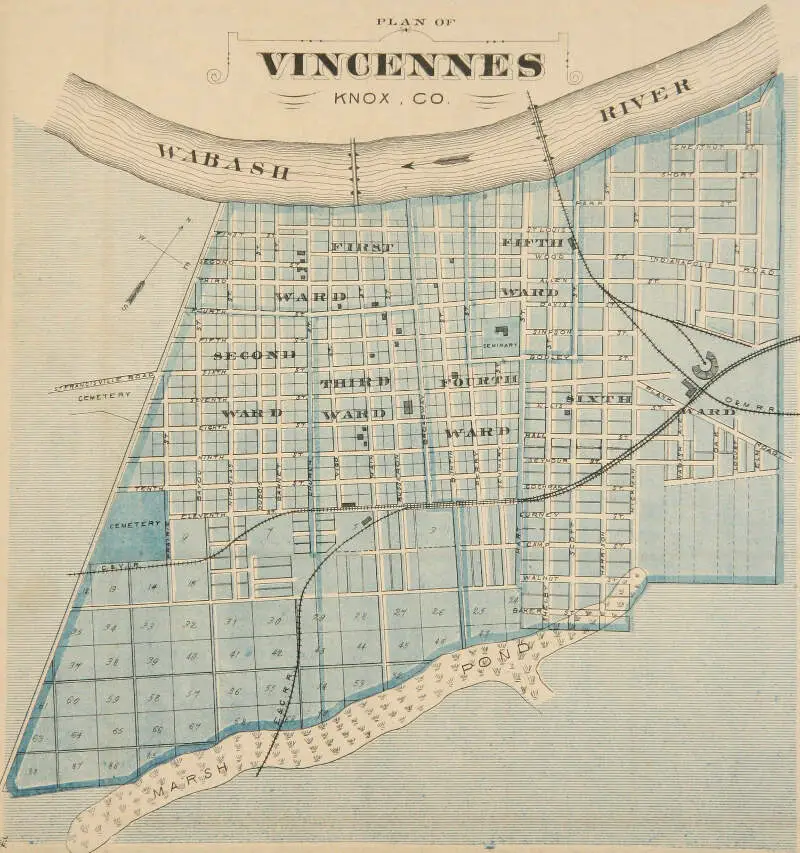
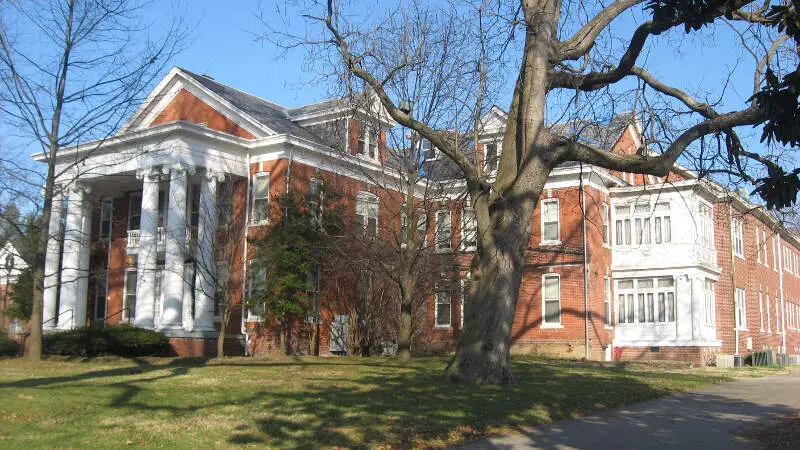
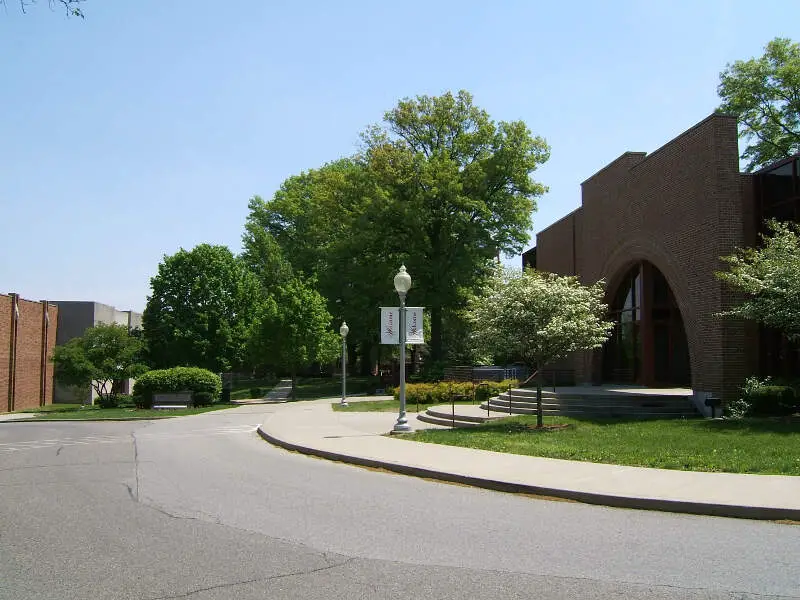
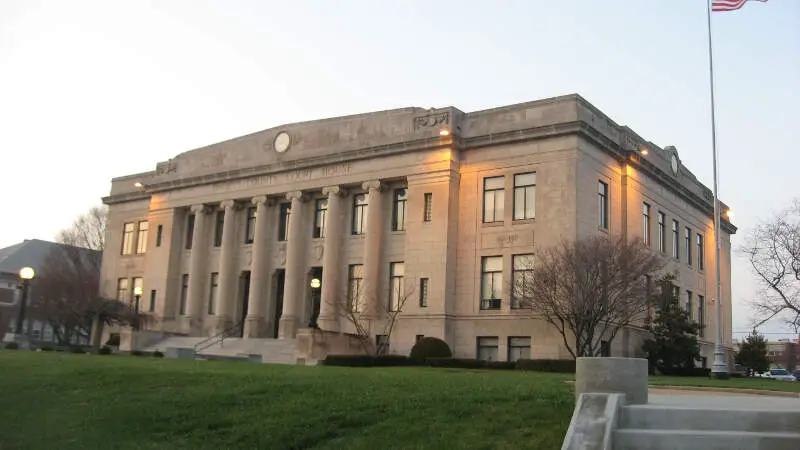
289.3 sunny days · 64.9 degree average high
Vincennes is a city in and the county seat of Knox County, Indiana, United States. It is located on the lower Wabash River in the southwestern part of the state, nearly halfway between Evansville and Terre Haute. Founded in 1732 by French fur traders, notably, Franois-Marie Bissot, Sieur de Vincennes for whom the Fort was named, Vincennes is the oldest continually inhabited European settlement in Indiana and one of the oldest settlements west of the Appalachians.
Data | Crime | Cost of living | Movers
293.5 sunny days · 61.8 degree average high
West Lafayette is a city in Wabash Township, Tippecanoe County, Indiana, United States, about 65 miles northwest of the state capital of Indianapolis and 103 miles southeast of Chicago. West Lafayette is directly across the Wabash River from its sister city, Lafayette. As of the 2016 census estimate, its population was 45,872. It is the most densely populated city in Indiana and is home to Purdue University.
Data | Crime | Cost of living | Movers
287.4 sunny days · 65.6 degree average high
Jasper is a city in, and the county seat of Bainbridge Township, Dubois County, Indiana, United States, located along the Patoka River. The population was 15,038 at the 2010 census making it the 48th largest city in Indiana. On November 4, 2007, Dubois County returned to the Eastern Time Zone, after having moved to the Central Time Zone the previous year. The land uses are mainly agriculture.
Data | Crime | Cost of living | Movers
The receipts
Compare the top ten
Pick a metric. The bars rescale. The red line is Indiana’s statewide median.
On the map
Where Indiana’s best weather is
Saturday Night Science
How We Determined The Cities In Indiana With The Best Weather
To rank the most fair weather cities in Indiana, we used Saturday Night Science and the National Oceanic and Atmospheric Administration (NOAA) database, to see which cities in the Hoosier State get the best weather.
We used the following criteria to find the best weather:
- Number of sunny days
- Highest average low
- Average high deviation from 70 degrees
- Least amount of rain
- Least amount of snow
We ranked each city of over 10,000 people in Indiana from best to worst on each criterion. We then averaged each ranking into a weather quality index. The city with the best index, Jeffersonville, was anointed the city with the best weather in Indiana.
Before we get too far, here are the annual precipitation rates for major cities: Indianapolis (42.2 inches), Fort Wayne (37.0 inches), and Evansville (45.9 inches).
The cities with the best weather in Indiana are Jeffersonville, Lafayette, New Albany, Clarksville, Evansville, Terre Haute, Washington, Vincennes, West Lafayette, and Jasper.
There’s a complete chart at the bottom.
The full plate
Detailed List Of Places With The Best Weather In Indiana
Click any column to sort. Search by city name.
| Rank | City | Population | Sunny Days | Avg. High | Precipitation (Inches) | Snow (Inches) |
|---|---|---|---|---|---|---|
| 1 | Jeffersonville | 46,259 | 290.8 | 67.0 | 45.0 | 7.8 |
| 2 | Lafayette | 70,661 | 294.4 | 62.2 | 38.0 | 19.0 |
| 3 | New Albany | 36,582 | 290.2 | 65.8 | 45.4 | 9.1 |
| 4 | Clarksville | 21,627 | 289.9 | 66.1 | 45.4 | 10.4 |
| 5 | Evansville | 120,212 | 289.9 | 66.9 | 45.9 | 11.2 |
| 6 | Terre Haute | 61,061 | 289.6 | 64.0 | 42.4 | 16.6 |
| 7 | Washington | 11,874 | 289.4 | 65.0 | 46.3 | 10.7 |
| 8 | Vincennes | 18,135 | 289.3 | 64.9 | 45.5 | 11.0 |
| 9 | West Lafayette | 43,999 | 293.5 | 61.8 | 38.6 | 19.0 |
| 10 | Jasper | 15,538 | 287.4 | 65.6 | 47.1 | 10.7 |
| 11 | Columbus | 45,868 | 287.6 | 63.1 | 44.2 | 15.2 |
| 12 | Hammond | 78,983 | 291.2 | 59.7 | 37.4 | 31.0 |
| 13 | Plainfield | 29,710 | 289.5 | 61.8 | 42.1 | 18.7 |
| 14 | East Chicago | 29,178 | 291.1 | 59.3 | 36.4 | 31.2 |
| 15 | Brownsburg | 23,484 | 289.5 | 61.8 | 42.1 | 18.7 |
| 16 | Avon | 15,145 | 289.5 | 61.8 | 42.1 | 18.7 |
| 17 | Beech Grove | 14,000 | 287.4 | 62.1 | 42.7 | 16.0 |
| 18 | Indianapolis | 841,449 | 289.0 | 62.1 | 42.2 | 21.6 |
| 19 | Shelbyville | 19,250 | 287.8 | 62.3 | 43.0 | 17.0 |
| 20 | Madison | 12,054 | 287.1 | 63.9 | 44.9 | 12.6 |
| 21 | Speedway | 12,100 | 288.3 | 62.1 | 42.3 | 21.4 |
| 22 | Noblesville | 58,013 | 288.0 | 61.7 | 41.3 | 19.4 |
| 23 | Franklin | 24,090 | 287.4 | 62.6 | 43.4 | 18.9 |
| 24 | Lebanon | 15,762 | 288.3 | 61.7 | 41.6 | 18.9 |
| 25 | Seymour | 18,861 | 285.0 | 64.4 | 46.1 | 13.1 |
| 26 | Greenwood | 53,828 | 287.4 | 62.3 | 43.1 | 20.3 |
| 27 | Munster | 23,250 | 290.5 | 59.8 | 38.5 | 30.6 |
| 28 | Bloomington | 82,813 | 285.4 | 63.6 | 47.0 | 15.8 |
| 29 | Bedford | 13,371 | 284.8 | 64.7 | 46.6 | 12.5 |
| 30 | New Haven | 15,832 | 293.9 | 60.1 | 36.7 | 28.8 |
| 31 | Martinsville | 11,739 | 287.3 | 62.5 | 43.5 | 19.2 |
| 32 | Highland | 23,285 | 290.5 | 59.7 | 38.4 | 30.6 |
| 33 | Greensburg | 12,054 | 284.5 | 62.9 | 43.9 | 14.2 |
| 34 | Gary | 78,483 | 290.3 | 59.7 | 38.1 | 35.8 |
| 35 | Merrillville | 35,322 | 290.7 | 59.7 | 38.3 | 31.9 |
| 36 | Schererville | 28,987 | 290.7 | 59.7 | 38.3 | 31.9 |
| 37 | Hobart | 28,943 | 290.7 | 59.7 | 38.3 | 31.9 |
| 38 | Griffith | 16,643 | 290.7 | 59.7 | 38.3 | 31.9 |
| 39 | Dyer | 16,257 | 290.7 | 59.7 | 38.3 | 31.9 |
| 40 | Lake Station | 12,268 | 290.7 | 59.7 | 38.3 | 31.9 |
| 41 | Crawfordsville | 15,982 | 288.4 | 61.6 | 41.5 | 18.8 |
| 42 | Anderson | 55,630 | 287.9 | 61.0 | 41.2 | 17.4 |
| 43 | Carmel | 85,367 | 287.1 | 61.7 | 41.9 | 22.7 |
| 44 | Westfield | 33,744 | 287.0 | 61.5 | 41.6 | 22.5 |
| 45 | St. John | 15,789 | 290.5 | 59.4 | 38.9 | 26.5 |
| 46 | Fort Wayne | 257,059 | 288.0 | 60.2 | 37.0 | 31.8 |
| 47 | Zionsville | 25,072 | 285.0 | 61.8 | 41.9 | 22.8 |
| 48 | Lawrence | 47,120 | 285.3 | 61.7 | 43.1 | 22.0 |
| 49 | Huntington | 17,231 | 289.0 | 60.6 | 39.2 | 27.4 |
| 50 | Greencastle | 10,314 | 284.6 | 62.0 | 43.4 | 19.8 |
| 51 | Connersville | 13,241 | 284.0 | 62.4 | 42.4 | 20.9 |
| 52 | Cedar Lake | 11,757 | 290.5 | 59.5 | 39.0 | 26.8 |
| 53 | Marion | 29,075 | 287.5 | 60.7 | 40.6 | 25.1 |
| 54 | Frankfort | 16,467 | 286.4 | 61.2 | 40.4 | 22.8 |
| 55 | Fishers | 83,177 | 283.2 | 61.6 | 42.0 | 21.5 |
| 56 | Muncie | 70,173 | 286.6 | 60.9 | 40.4 | 22.4 |
| 57 | Crown Point | 28,444 | 290.5 | 59.6 | 38.9 | 34.8 |
| 58 | Logansport | 17,716 | 287.4 | 60.2 | 39.8 | 24.4 |
| 59 | Yor | 11,268 | 286.5 | 60.9 | 40.8 | 22.9 |
| 60 | Richmond | 36,291 | 286.4 | 60.9 | 41.6 | 19.3 |
| 61 | Greenfield | 21,179 | 283.6 | 61.4 | 43.2 | 20.7 |
| 62 | Portage | 37,197 | 289.4 | 59.4 | 39.2 | 36.9 |
| 63 | Valparaiso | 32,123 | 289.4 | 59.4 | 39.2 | 36.9 |
| 64 | Chesterton | 14,124 | 289.4 | 59.4 | 39.2 | 36.9 |
| 65 | Auburn | 12,979 | 287.3 | 59.8 | 38.2 | 34.6 |
| 66 | Peru | 11,197 | 286.0 | 60.6 | 40.2 | 27.1 |
| 67 | Warsaw | 14,385 | 287.8 | 59.5 | 38.9 | 33.0 |
| 68 | Wabash | 10,469 | 286.3 | 60.2 | 39.9 | 28.9 |
| 69 | Kokomo | 58,054 | 282.3 | 61.0 | 41.4 | 32.5 |
| 70 | Michigan City | 31,412 | 278.9 | 58.8 | 38.0 | 48.6 |
| 71 | New Castle | 17,755 | 283.6 | 60.7 | 43.0 | 24.2 |
| 72 | Elkhart | 52,354 | 286.9 | 59.2 | 38.8 | 41.7 |
| 73 | Goshen | 32,946 | 286.9 | 59.2 | 38.8 | 41.7 |
| 74 | Plymouth | 10,031 | 286.9 | 59.5 | 40.1 | 44.7 |
| 75 | La Porte | 22,242 | 285.6 | 59.2 | 39.5 | 46.5 |
| 76 | South Bend | 100,590 | 286.5 | 59.1 | 39.3 | 64.3 |
| 77 | Mishawaka | 48,121 | 286.1 | 59.1 | 39.5 | 61.6 |
| 78 | Granger | 30,690 | 284.0 | 59.1 | 39.6 | 63.7 |
Source: NOAA climate data. 78 Indiana cities with more than 10,000 residents.
Summary
Summary: The Cities With The Best Weather In Indiana For 2026
If you’re looking for the Indiana cities with the most sunny days, the least rain and snow, and highs closest to a perfect 70 degrees, this is an accurate list.
The cities with the best weather in Indiana are Jeffersonville, Lafayette, New Albany, Clarksville, Evansville, Terre Haute, Washington, Vincennes, West Lafayette, and Jasper.


