Most Asian cities in New York research summary. We analyzed New York’s most recent Census data to determine the most Asian cities in New York based on the percentage of Asian residents.
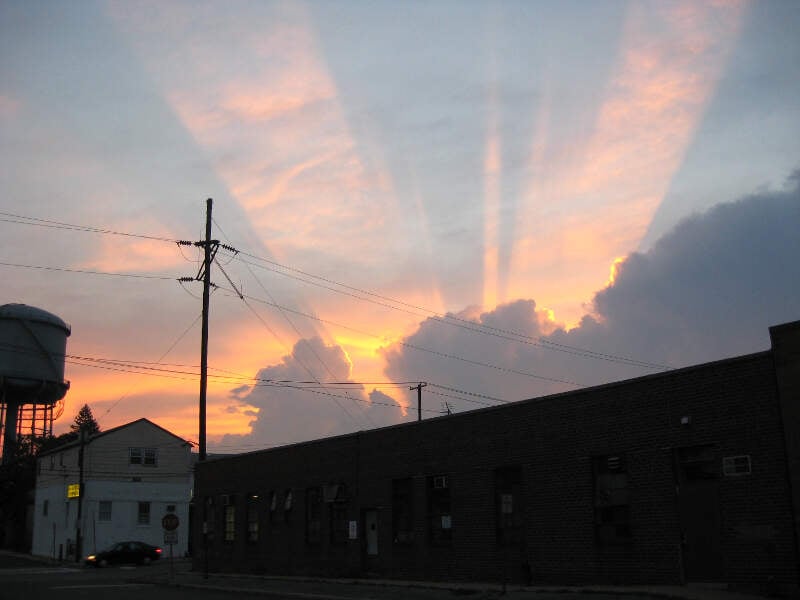
34.2% Asian · #1 most Asian in New York
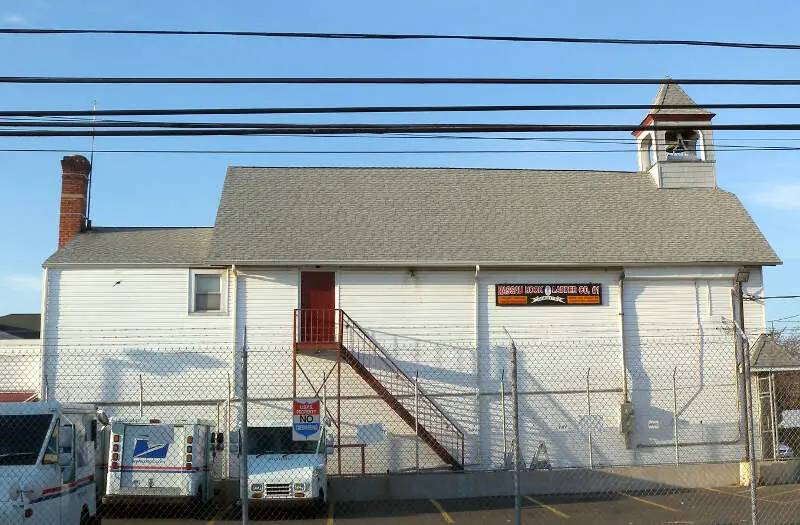
New Hyde Park is an area that includes the incorporated Village of New Hyde Park in Nassau County, Long Island, New York, United States, as well as surrounding unincorporated areas. The place name, New Hyde Park, and its postal codes, 11040-11099, are used to serve all of these areas.
Data | Crime | Cost of living | Movers
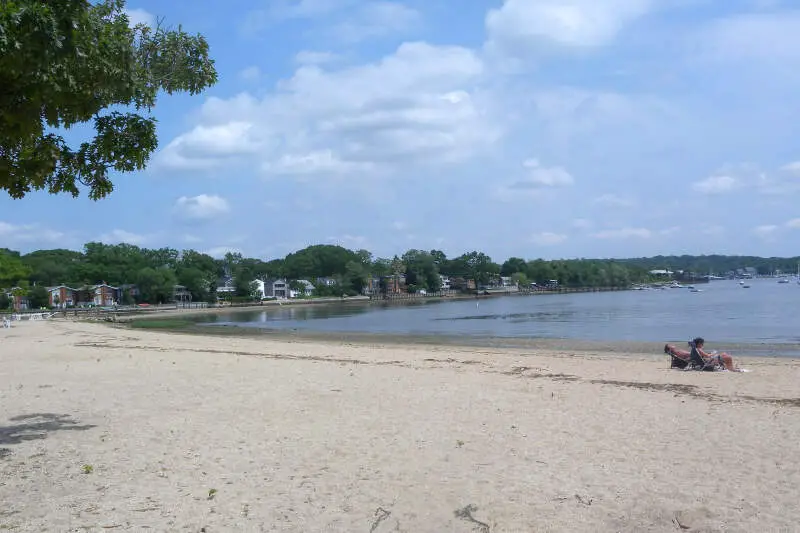
25.1% Asian · #2 most Asian in New York
Data | Crime | Cost of living | Movers
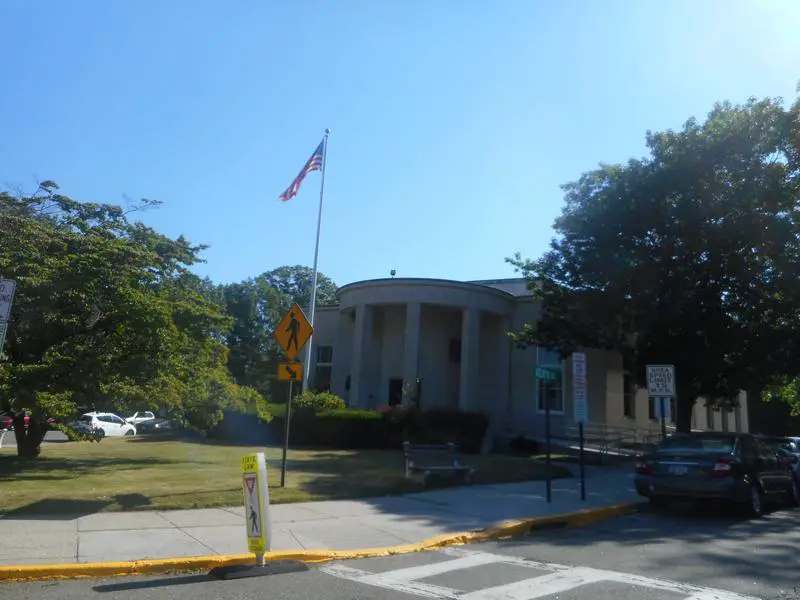
24.0% Asian · #3 most Asian in New York
Great Neck Plaza is a village in the town of North Hempstead in Nassau County, New York in the United States. The population was 6,707 at the 2010 census.
Data | Crime | Cost of living | Movers
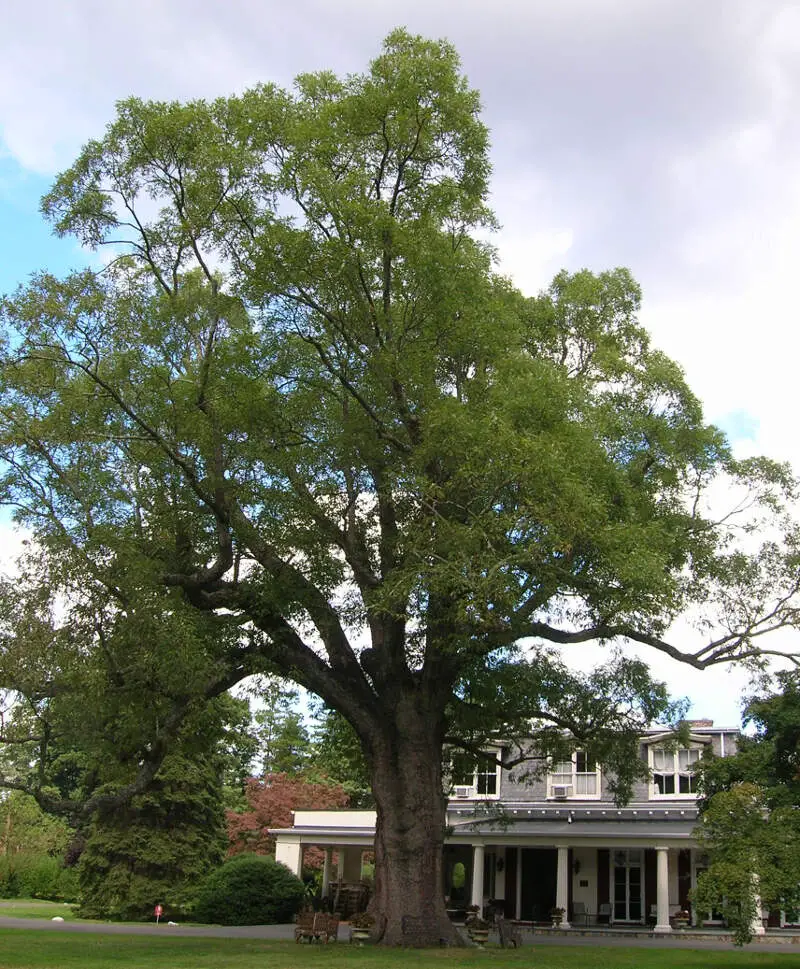
20.3% Asian · #4 most Asian in New York
Scarsdale is a town and village in Westchester County, New York. The Town of Scarsdale is coextensive with the Village of Scarsdale, but the community has opted to operate solely with a village government, one of several villages in the state that have a similar governmental situation. As of the 2010 census, Scarsdale’s population was 17,166.
Data | Crime | Cost of living | Movers
19.6% Asian · #5 most Asian in New York
Valley Stream is a village in Nassau County, New York, United States. The population in the Village of Valley Stream was 37,511 at the 2010 census.
Data | Crime | Cost of living | Movers
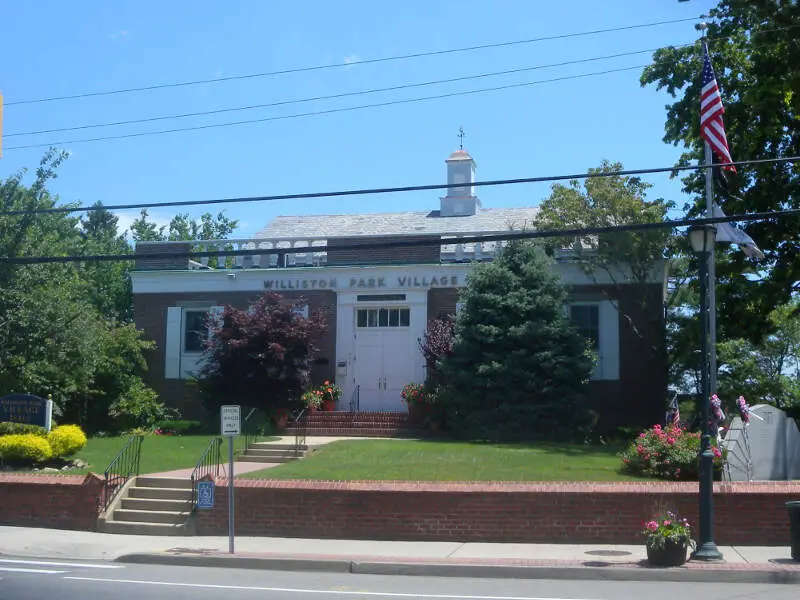
16.6% Asian · #6 most Asian in New York
Williston Park is an incorporated village in Nassau County, New York in the United States. The population was 7,287 at the 2010 census.
Data | Crime | Cost of living | Movers
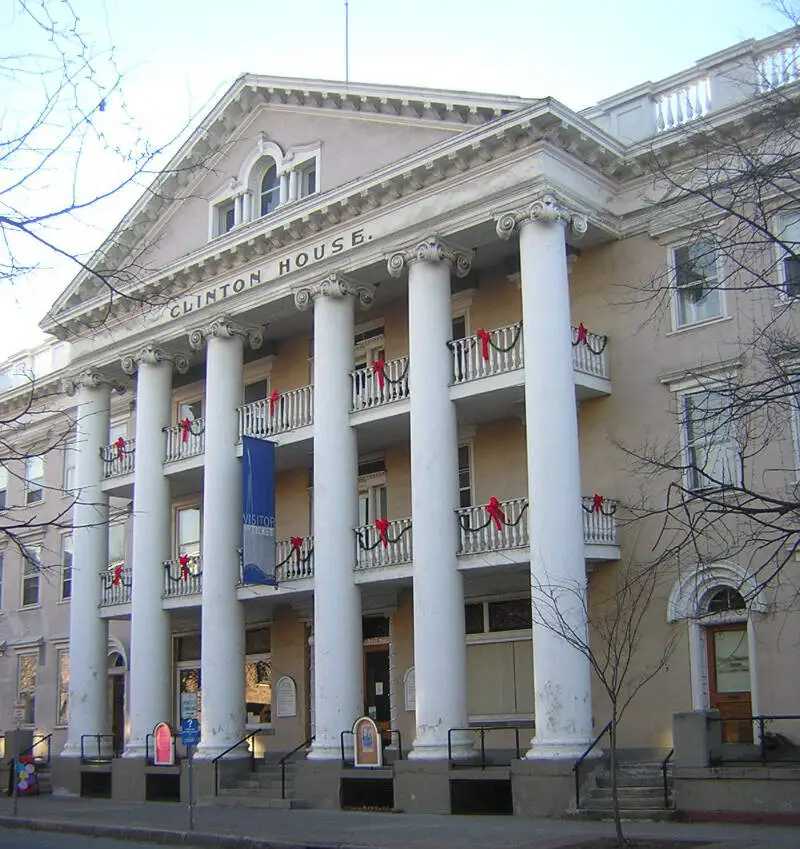
16.5% Asian · #7 most Asian in New York
Ithaca is a city in the Southern Tier-Finger Lakes region of New York. It is the seat of Tompkins County, as well as the largest community in the Ithaca-Tompkins County metropolitan area. This area contains the municipalities of the Town of Ithaca, the village of Cayuga Heights, and other towns and villages in Tompkins County. The city of Ithaca is located on the southern shore of Cayuga Lake, in Central New York. It is named for the Greek island of Ithaca.
Data | Crime | Cost of living | Movers
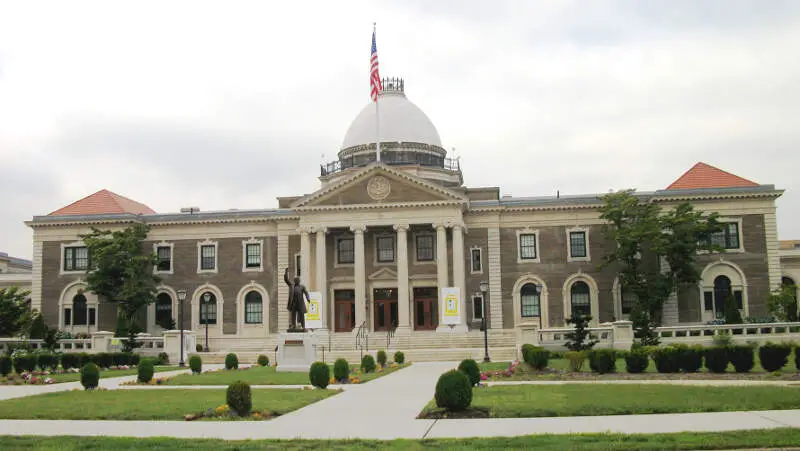
16.2% Asian · #8 most Asian in New York
Mineola is a village in Nassau County, Long Island, New York, USA. The population was 18,799 at the 2010 census. The name is derived from an Algonquin word meaning a “pleasant village”.
Data | Crime | Cost of living | Movers
14.6% Asian · #9 most Asian in New York
The City of New York, often called New York City or simply New York, is the most populous city in the United States. With an estimated 2016 population of 8,537,673 distributed over a land area of about 302.6 square miles, New York City is also the most densely populated major city in the United States. Located at the southern tip of the state of New York, the city is the center of the New York metropolitan area, one of the most populous urban agglomerations in the world with an estimated 23.7million residents as of 2016. A global power city, New York City has been described as the cultural, financial, and media capital of the world, and exerts a significant impact upon commerce, entertainment, research, technology, education, politics, and sports. The city’s fast pace defines the term New York minute. Home to the headquarters of the United Nations, New York is an important center for international diplomacy.
Data | Crime | Cost of living | Movers | Compare
14.5% Asian · #10 most Asian in New York
Data | Crime | Cost of living | Movers
The receipts
Compare the top ten
Pick a metric. The bars rescale. The red line is New York’s statewide median.
On the map
Where New York’s Asian communities live
Saturday Night Science
Methodology: How We Determined The Cities In New York With The Largest Asian Population For 2026
We used Saturday Night Science to compare Census data on race across every place in New York.
The Census’s most recently available data comes from the 2020-2024 American Community Survey.
Specifically, we looked at table B03002: Hispanic OR LATINO ORIGIN BY RACE. Here are the category names as defined by the Census:
- Hispanic or Latino
- White alone*
- Black or African American alone*
- American Indian and Alaska Native alone*
- Asian alone*
- Native Hawaiian and Other Pacific Islander alone*
- Some other race alone*
- Two or more races*
Our particular column of interest here was the number of people who identified as Asian alone.
We limited our analysis to cities with a population greater than 5,000 people. That left us with 162 cities.
We then calculated the percentage of residents that are Asian. The percentages ranked from 34.2% to 0.0%.
Finally, we ranked each city based on the percentage of Asian population, with a higher percentage being more Asian. New Hyde Park took the distinction of being the most Asian, while Cedarhurst was the least Asian city.
We updated this article for 2026. This report reflects our eleventh time ranking the cities in New York with the largest Asian population.
The full plate
Cities In New York By Asian Population
Click any column to sort. Search by city name.
| Rank | City | Population | Asian Population | % Asian |
|---|---|---|---|---|
| 1 | New Hyde Park | 10,220 | 3,492 | 34.2% |
| 2 | Manorhaven | 6,958 | 1,745 | 25.1% |
| 3 | Great Neck Plaza | 7,593 | 1,826 | 24.0% |
| 4 | Scarsdale | 18,010 | 3,655 | 20.3% |
| 5 | Valley Stream | 40,315 | 7,912 | 19.6% |
| 6 | Williston Park | 7,542 | 1,252 | 16.6% |
| 7 | Ithaca | 32,814 | 5,423 | 16.5% |
| 8 | Mineola | 21,211 | 3,430 | 16.2% |
| 9 | New York | 8,483,844 | 1,240,270 | 14.6% |
| 10 | Tuckahoe | 6,973 | 1,009 | 14.5% |
| 11 | Floral Park | 16,169 | 2,189 | 13.5% |
| 12 | Great Neck | 11,087 | 1,481 | 13.4% |
| 13 | Dobbs Ferry | 11,443 | 1,399 | 12.2% |
| 14 | Johnson City | 14,940 | 1,765 | 11.8% |
| 15 | East Hills | 7,257 | 835 | 11.5% |
| 16 | Utica | 64,217 | 7,180 | 11.2% |
| 17 | Lake Grove | 11,061 | 1,214 | 11.0% |
| 18 | Rensselaer | 9,287 | 956 | 10.3% |
| 19 | Hudson | 5,865 | 597 | 10.2% |
| 20 | Westbury | 15,808 | 1,608 | 10.2% |
| 21 | Rye Brook | 9,900 | 1,001 | 10.1% |
| 22 | Briarcliff Manor | 7,519 | 742 | 9.9% |
| 23 | Buffalo | 276,854 | 24,192 | 8.7% |
| 24 | White Plains | 60,666 | 5,245 | 8.6% |
| 25 | Lynbrook | 20,325 | 1,717 | 8.4% |
| 26 | Pelham Manor | 5,644 | 440 | 7.8% |
| 27 | Harrison | 29,961 | 2,323 | 7.8% |
| 28 | Albany | 100,492 | 7,722 | 7.7% |
| 29 | Syracuse | 146,384 | 10,582 | 7.2% |
| 30 | Rye | 16,428 | 1,125 | 6.8% |
| 31 | Irvington | 6,531 | 444 | 6.8% |
| 32 | Binghamton | 47,151 | 3,199 | 6.8% |
| 33 | Garden City | 22,941 | 1,513 | 6.6% |
| 34 | Tarr | 11,784 | 776 | 6.6% |
| 35 | Potsdam | 8,427 | 553 | 6.6% |
| 36 | Port Jefferson | 8,091 | 516 | 6.4% |
| 37 | New Hempstead | 5,472 | 335 | 6.1% |
| 38 | Malverne | 8,477 | 503 | 5.9% |
| 39 | Schenectady | 68,847 | 4,071 | 5.9% |
| 40 | Mamaroneck | 19,826 | 1,155 | 5.8% |
| 41 | Suffern | 11,441 | 656 | 5.7% |
| 42 | New Paltz | 8,314 | 473 | 5.7% |
| 43 | Farmingdale | 8,474 | 478 | 5.6% |
| 44 | Pelham | 7,305 | 412 | 5.6% |
| 45 | Bronxville | 6,510 | 367 | 5.6% |
| 46 | Rockville Centre | 25,765 | 1,440 | 5.6% |
| 47 | Glen Cove | 28,112 | 1,549 | 5.5% |
| 48 | New Rochelle | 82,769 | 4,391 | 5.3% |
| 49 | Yonkers | 209,978 | 11,130 | 5.3% |
| 50 | Geneseo | 7,701 | 385 | 5.0% |
| 51 | Spring Valley | 33,192 | 1,549 | 4.7% |
| 52 | Monticello | 7,279 | 338 | 4.6% |
| 53 | Colonie | 7,702 | 355 | 4.6% |
| 54 | Long Beach | 34,756 | 1,571 | 4.5% |
| 55 | Nyack | 7,393 | 332 | 4.5% |
| 56 | Port Jervis | 8,652 | 370 | 4.3% |
| 57 | Patchogue | 12,396 | 514 | 4.1% |
| 58 | Sleepy Hollow | 10,887 | 449 | 4.1% |
| 59 | Ossining | 26,950 | 1,069 | 4.0% |
| 60 | Troy | 51,033 | 2,000 | 3.9% |
| 61 | Mount Kisco | 10,737 | 418 | 3.9% |
| 62 | Goshen | 5,773 | 220 | 3.8% |
| 63 | Walden | 6,868 | 252 | 3.7% |
| 64 | Woodbury | 11,334 | 399 | 3.5% |
| 65 | Middletown | 30,289 | 1,051 | 3.5% |
| 66 | Brockport | 7,277 | 236 | 3.2% |
| 67 | Plattsburgh | 19,830 | 639 | 3.2% |
| 68 | Rochester | 208,772 | 6,675 | 3.2% |
| 69 | Croton-on-Hudson | 8,202 | 255 | 3.1% |
| 70 | Saratoga Springs | 28,631 | 883 | 3.1% |
| 71 | Wesley Hills | 6,196 | 183 | 3.0% |
| 72 | Kingston | 23,911 | 706 | 3.0% |
| 73 | Hastings-on-Hudson | 8,434 | 249 | 3.0% |
| 74 | Olean | 13,738 | 404 | 2.9% |
| 75 | Beacon | 14,834 | 432 | 2.9% |
| 76 | West Haverstraw | 10,711 | 300 | 2.8% |
| 77 | Hempstead | 58,801 | 1,632 | 2.8% |
| 78 | Bayville | 6,744 | 183 | 2.7% |
| 79 | Wappingers Falls | 5,761 | 156 | 2.7% |
| 80 | Haverstraw | 12,325 | 332 | 2.7% |
| 81 | Lindenhurst | 27,142 | 731 | 2.7% |
| 82 | Hornell | 8,152 | 218 | 2.7% |
| 83 | Corning | 10,643 | 284 | 2.7% |
| 84 | Monroe | 9,515 | 252 | 2.6% |
| 85 | Freeport | 44,088 | 1,146 | 2.6% |
| 86 | Geneva | 12,512 | 315 | 2.5% |
| 87 | Oneonta | 15,045 | 374 | 2.5% |
| 88 | Cohoes | 18,159 | 445 | 2.5% |
| 89 | Niagara Falls | 47,987 | 1,146 | 2.4% |
| 90 | Port Chester | 31,102 | 717 | 2.3% |
| 91 | Canton | 7,167 | 164 | 2.3% |
| 92 | Fredonia | 9,467 | 214 | 2.3% |
| 93 | Webster | 5,718 | 122 | 2.1% |
| 94 | Endicott | 13,387 | 276 | 2.1% |
| 95 | Watertown | 24,375 | 502 | 2.1% |
| 96 | North Syracuse | 6,693 | 132 | 2.0% |
| 97 | Peekskill | 25,625 | 499 | 1.9% |
| 98 | Lawrence | 6,778 | 130 | 1.9% |
| 99 | Mount Vernon | 72,427 | 1,369 | 1.9% |
| 100 | Watervliet | 10,287 | 190 | 1.8% |
Source: U.S. Census ACS 2020-2024. 162 cities with more than 5,000 residents.
Summary
Summary: Asian Populations Across New York
If you’re looking for a breakdown of Asian populations across New York according to the most recent data, this is an accurate list.
The most Asian cities in New York are New Hyde Park, Manorhaven, Great Neck Plaza, Scarsdale, Valley Stream, Williston Park, Ithaca, Mineola, New York, and Tuckahoe. Not sold on New York? Take the two-minute Find Your Place quiz and see which state actually fits you.


