Racial diversity in Ohio is a mixed bag.
There are parts of Ohio where there’s a high level of diversity. But where will you find the most diverse places in Ohio?
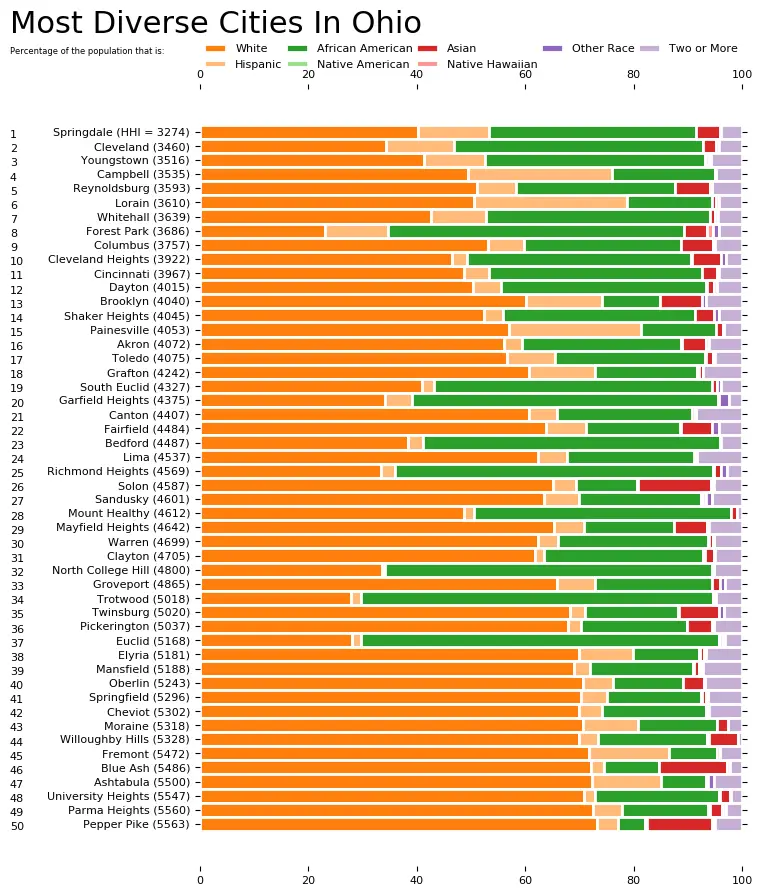
To answer that question, we went to the US Census data. Using Saturday Night Science, we measured the Gini coefficient for all 249 cities in Ohio to rank them from most to least diverse.
Table Of Contents: Top Ten | Methodology | Summary | Table
Here are the 10 most diverse places in Ohio for 2026:
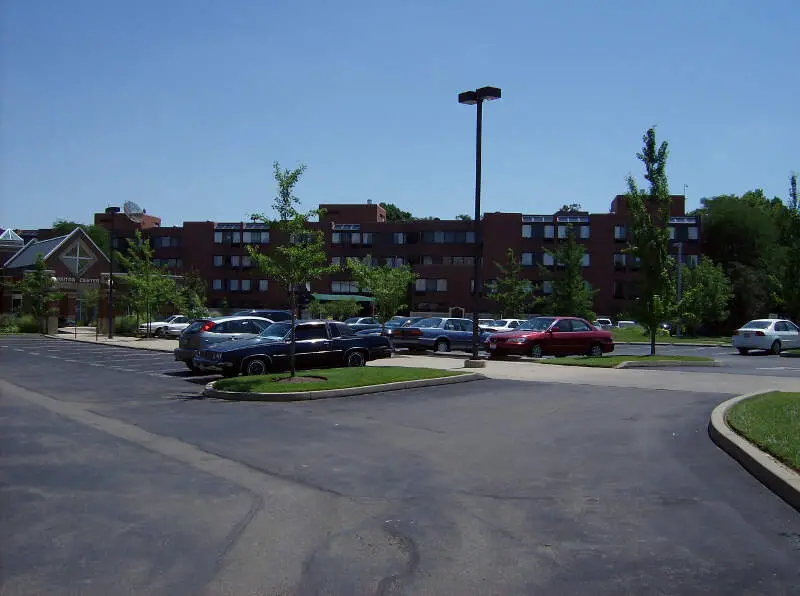
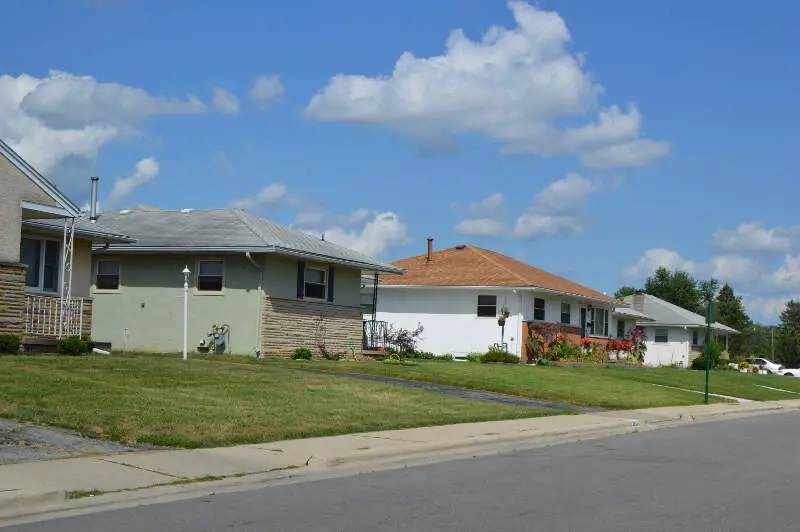
So what city is the most diverse in Ohio? According to the most Census data, Springdale took the number one over all spot for diversity in Ohio.
Read on below to see how we crunched the numbers and how your town ranked. To see where Ohio ranked as a state, we have a ranking of the most diverse states in Ameria.
For more Ohio reading:
The 10 Most Diverse Places In Ohio For 2026

/10
Population: 11,033
HHI: 3,279
% White: 41.8%
% African American: 37.0%
% Hispanic: 10.3%
% Asian: 5.5%
More on Springdale: Data | Crime | Cost Of Living | Movers

/10
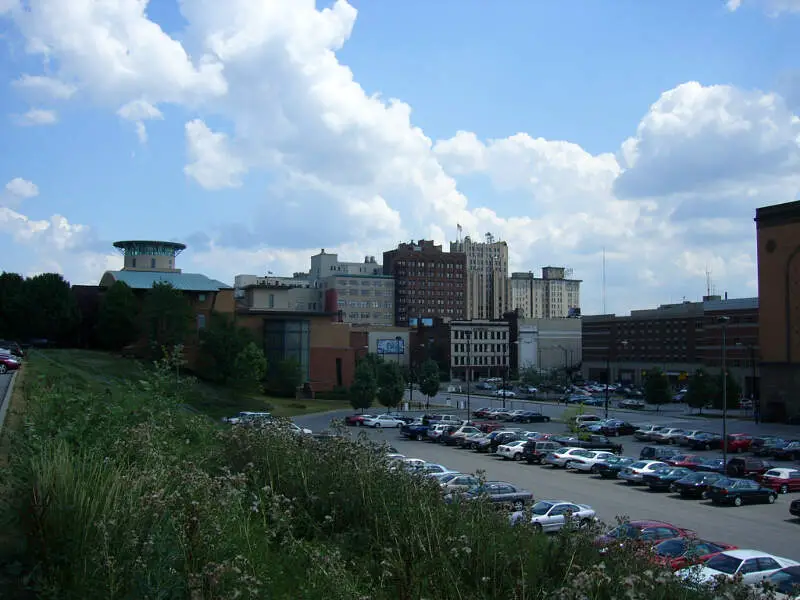
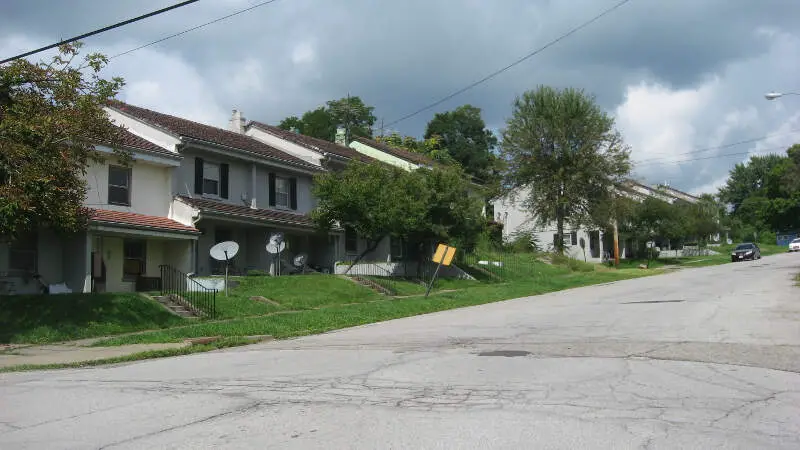
Population: 59,331
HHI: 3,369
% White: 40.3%
% African American: 39.3%
% Hispanic: 12.3%
% Asian: 0.7%
More on Youngstown: Data | Crime | Cost Of Living | Movers

/10
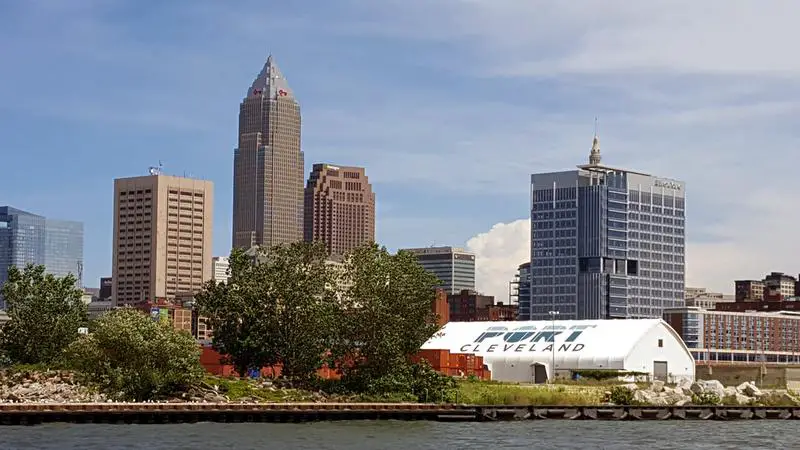
Population: 366,097
HHI: 3,375
% White: 33.7%
% African American: 45.1%
% Hispanic: 13.2%
% Asian: 2.6%
More on Cleveland: Data | Crime | Cost Of Living | Movers

/10
Population: 20,019
HHI: 3,405
% White: 40.8%
% African American: 39.8%
% Hispanic: 10.9%
% Asian: 2.9%
More on Whitehall: Data | Crime | Cost Of Living | Movers

/10
Population: 7,784
HHI: 3,425
% White: 49.1%
% African American: 21.1%
% Hispanic: 22.8%
% Asian: 0.0%
More on Campbell: Data | Crime | Cost Of Living | Movers

/10
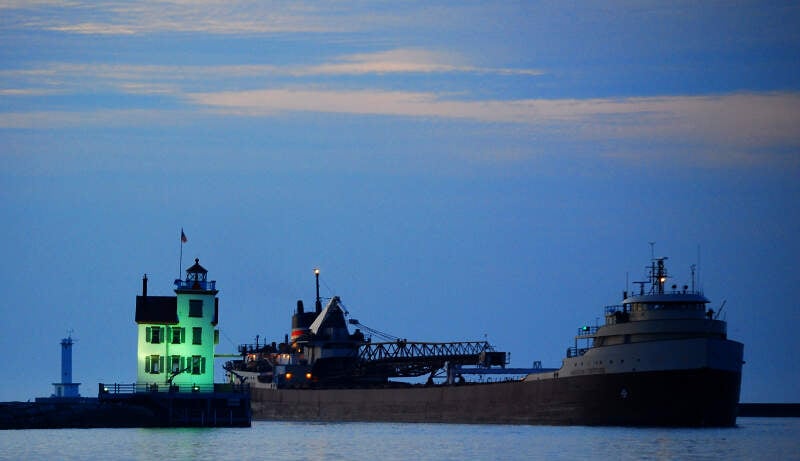
Population: 65,395
HHI: 3,511
% White: 49.1%
% African American: 16.5%
% Hispanic: 28.3%
% Asian: 0.4%
More on Lorain: Data | Crime | Cost Of Living | Movers

/10
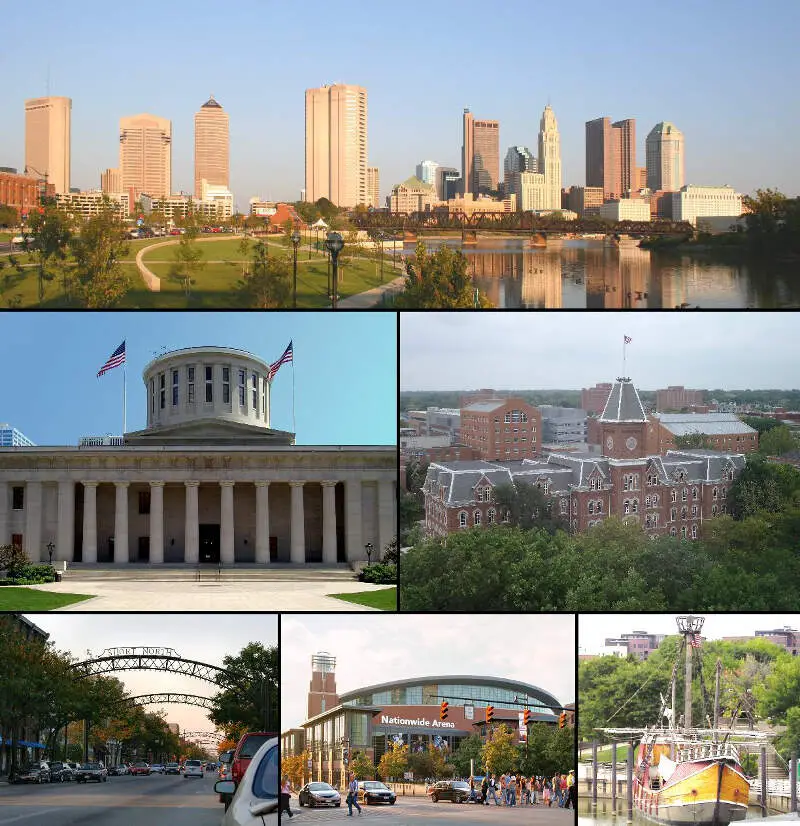
Population: 914,802
HHI: 3,545
% White: 50.7%
% African American: 29.1%
% Hispanic: 8.3%
% Asian: 5.9%
More on Columbus: Data | Crime | Cost Of Living | Movers

/10
Population: 41,224
HHI: 3,547
% White: 50.0%
% African American: 30.4%
% Hispanic: 6.5%
% Asian: 5.7%
More on Reynoldsburg: Data | Crime | Cost Of Living | Movers

/10
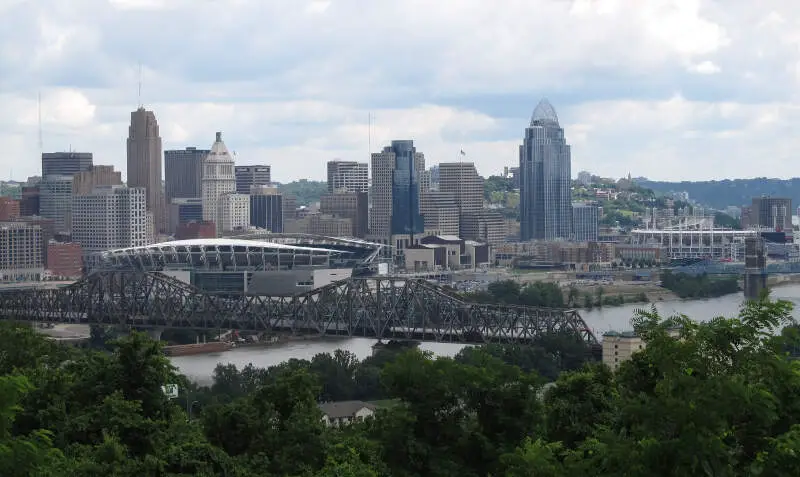
Population: 311,224
HHI: 3,716
% White: 48.2%
% African American: 36.3%
% Hispanic: 6.1%
% Asian: 2.6%
More on Cincinnati: Data | Crime | Cost Of Living | Movers

/10
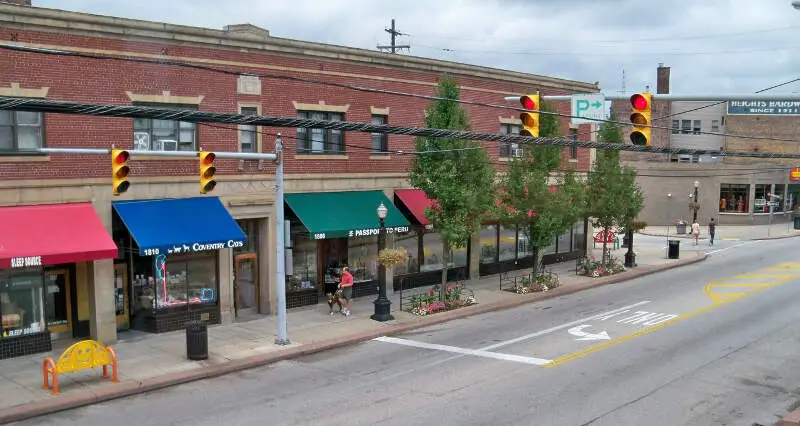
Population: 44,497
HHI: 3,734
% White: 45.8%
% African American: 39.7%
% Hispanic: 3.3%
% Asian: 6.0%
More on Cleveland Heights: Data | Crime | Cost Of Living | Movers
Methodology: How we determined the most diverse cities in Ohio for 2026
We still believe in the accuracy of data — especially from the Census — and Saturday Night Science. So that’s where we went to get the race breakdown across Ohio.
That leads us to the Census’s most recently available data, the 2020-2024 American Community Survey data from the US Census.
Specifically, we looked at table B03002: HISPANIC OR LATINO ORIGIN BY RACE. Here are the category names as defined by the Census:
- White alone*
- Black or African American alone*
- American Indian and Alaska Native alone*
- Asian alone*
- Native Hawaiian and Other Pacific Islander alone*
- Some other race alone*
- Two or more races*
- Hispanic or Latino
We limited our analysis to non-CDPs with a population greater than 5,000 people. That left us with 249 cities.
We then calculated the HHI for each city by finding the racial breakdown of a city in percent terms, squaring them, and then adding the squares together. This left us with scores ranging from 3,279 (Springdale) to 9,554 (Wellston).
Finally, we ranked each city based on the HHI, with a lower score being more diverse than a high score. Springdale took the distinction of being the most diverse, while Wellston was the least diverse city.
We updated this article for 2026. This report is our eleventh time ranking the most diverse places in Ohio.
Summary: Diversity Across Ohio
If you’re looking for a scientific breakdown of diversity across Ohio, this is an accurate list.
The most diverse cities in Ohio are Springdale, Youngstown, Cleveland, Whitehall, Campbell, Lorain, Columbus, Reynoldsburg, Cincinnati, and Cleveland Heights.
If you’re curious enough, here are the least diverse places in Ohio:
- Wellston
- Eaton
- Salem
For more Ohio reading, check out:
- Best Places To Live In Ohio
- Cheapest Places To Live In Ohio
- Most Dangerous Cities In Ohio
- Best Places To Raise A Family In Ohio
- Safest Places In Ohio
- Worst Places To Live In Ohio
Race By City In Ohio For 2026
| Rank | City | Population | HHI | % White | % Black | % Hispanic | % Asian |
|---|---|---|---|---|---|---|---|
| 1 | Springdale, OH | 11,033 | 3,279 | 41.8% | 37.0% | 10.3% | 5.5% |
| 2 | Youngstown, OH | 59,331 | 3,369 | 40.3% | 39.3% | 12.3% | 0.7% |
| 3 | Cleveland, OH | 366,097 | 3,375 | 33.7% | 45.1% | 13.2% | 2.6% |
| 4 | Whitehall, OH | 20,019 | 3,405 | 40.8% | 39.8% | 10.9% | 2.9% |
| 5 | Campbell, OH | 7,784 | 3,425 | 49.1% | 21.1% | 22.8% | 0.0% |
| 6 | Lorain, OH | 65,395 | 3,511 | 49.1% | 16.5% | 28.3% | 0.4% |
| 7 | Columbus, OH | 914,802 | 3,545 | 50.7% | 29.1% | 8.3% | 5.9% |
| 8 | Reynoldsburg, OH | 41,224 | 3,547 | 50.0% | 30.4% | 6.5% | 5.7% |
| 9 | Cincinnati, OH | 311,224 | 3,716 | 48.2% | 36.3% | 6.1% | 2.6% |
| 10 | Cleveland Heights, OH | 44,497 | 3,734 | 45.8% | 39.7% | 3.3% | 6.0% |
| 11 | Brooklyn, OH | 11,158 | 3,766 | 57.0% | 11.7% | 16.4% | 6.7% |
| 12 | Akron, OH | 189,247 | 3,807 | 53.5% | 29.0% | 4.3% | 4.9% |
| 13 | Fairfield, OH | 44,828 | 3,959 | 59.3% | 14.9% | 11.4% | 7.4% |
| 14 | Dayton, OH | 136,579 | 3,961 | 49.9% | 37.6% | 5.7% | 1.3% |
| 15 | Shaker Heights, OH | 28,922 | 3,989 | 53.4% | 32.9% | 4.3% | 3.8% |
| 16 | Toledo, OH | 267,463 | 3,992 | 55.8% | 27.7% | 9.1% | 1.3% |
| 17 | Mayfield Heights, OH | 20,022 | 4,068 | 59.3% | 20.2% | 4.4% | 7.7% |
| 18 | Pickerington, OH | 24,477 | 4,085 | 57.6% | 26.1% | 3.5% | 6.8% |
| 19 | North College Hill, OH | 9,555 | 4,103 | 39.7% | 49.4% | 1.5% | 0.0% |
| 20 | Grafton, OH | 5,657 | 4,150 | 58.8% | 21.7% | 13.9% | 0.0% |
| 21 | Canton, OH | 69,755 | 4,166 | 59.0% | 23.4% | 6.7% | 0.6% |
| 22 | Forest Park, OH | 20,025 | 4,179 | 21.1% | 59.9% | 10.8% | 3.6% |
| 23 | Garfield Heights, OH | 29,269 | 4,205 | 29.4% | 57.2% | 6.8% | 0.1% |
| 24 | Sandusky, OH | 24,606 | 4,213 | 60.4% | 21.7% | 6.1% | 1.8% |
| 25 | South Euclid, OH | 21,534 | 4,290 | 40.1% | 51.6% | 2.6% | 2.1% |
| 26 | Mount Healthy, OH | 6,919 | 4,397 | 40.3% | 52.4% | 4.7% | 0.4% |
| 27 | Moraine, OH | 6,536 | 4,434 | 63.2% | 15.5% | 13.2% | 2.4% |
| 28 | Bedford, OH | 12,931 | 4,445 | 32.8% | 57.7% | 4.4% | 0.0% |
| 29 | Painesville, OH | 20,548 | 4,505 | 61.4% | 7.6% | 25.8% | 1.6% |
| 30 | Lima, OH | 35,010 | 4,657 | 64.3% | 20.4% | 4.8% | 0.9% |
| 31 | Clayton, OH | 13,277 | 4,669 | 62.1% | 27.7% | 2.8% | 1.5% |
| 32 | Warren, OH | 38,912 | 4,693 | 62.6% | 27.0% | 3.4% | 0.8% |
| 33 | Solon, OH | 23,943 | 4,755 | 66.2% | 9.4% | 3.1% | 15.8% |
| 34 | Twinsburg, OH | 19,410 | 4,791 | 66.3% | 17.3% | 2.0% | 8.0% |
| 35 | Groveport, OH | 5,900 | 4,831 | 64.7% | 24.4% | 6.4% | 0.8% |
| 36 | Cheviot, OH | 8,660 | 4,833 | 63.9% | 26.7% | 4.0% | 0.0% |
| 37 | Oberlin, OH | 8,329 | 4,897 | 67.9% | 11.6% | 8.1% | 3.9% |
| 38 | Elyria, OH | 53,035 | 4,920 | 67.8% | 12.2% | 10.5% | 1.4% |
| 39 | Richmond Heights, OH | 10,626 | 4,941 | 28.8% | 64.0% | 1.5% | 1.8% |
| 40 | Trotwood, OH | 23,041 | 4,962 | 25.6% | 65.4% | 2.0% | 1.1% |
| 41 | Pataskala, OH | 18,223 | 5,046 | 69.0% | 9.6% | 4.9% | 12.2% |
| 42 | Blue Ash, OH | 13,455 | 5,130 | 69.7% | 8.4% | 3.6% | 13.0% |
| 43 | West Carrollton, OH | 12,976 | 5,146 | 69.5% | 13.8% | 8.5% | 1.2% |
| 44 | Euclid, OH | 48,823 | 5,161 | 26.3% | 66.7% | 1.5% | 0.6% |
| 45 | Fremont, OH | 15,835 | 5,183 | 69.3% | 8.3% | 16.6% | 0.3% |
| 46 | Gahanna, OH | 35,486 | 5,187 | 69.7% | 16.2% | 3.1% | 3.2% |
| 47 | Springfield, OH | 58,190 | 5,187 | 69.3% | 17.3% | 5.6% | 0.4% |
| 48 | Sharonville, OH | 14,030 | 5,205 | 70.4% | 5.9% | 12.5% | 4.3% |
| 49 | Ashtabula, OH | 17,856 | 5,213 | 70.1% | 8.5% | 14.0% | 0.5% |
| 50 | Mansfield, OH | 47,663 | 5,266 | 70.2% | 15.8% | 3.3% | 0.9% |
| 51 | Middletown, OH | 51,617 | 5,287 | 70.8% | 13.2% | 8.2% | 0.9% |
| 52 | University Heights, OH | 13,394 | 5,290 | 69.6% | 20.6% | 2.6% | 1.9% |
| 53 | Huber Heights, OH | 43,455 | 5,320 | 71.0% | 14.2% | 5.5% | 3.5% |
| 54 | Pepper Pike, OH | 6,840 | 5,412 | 72.1% | 4.2% | 3.0% | 11.3% |
| 55 | Hamilton, OH | 63,468 | 5,478 | 72.3% | 7.5% | 12.0% | 0.8% |
| 56 | Willoughby Hills, OH | 9,975 | 5,509 | 70.6% | 22.4% | 1.4% | 4.2% |
| 57 | Englewood, OH | 13,356 | 5,512 | 72.2% | 14.0% | 2.6% | 1.4% |
| 58 | Parma Heights, OH | 20,581 | 5,524 | 72.3% | 16.1% | 4.3% | 3.2% |
| 59 | Dublin, OH | 49,294 | 5,573 | 72.0% | 2.3% | 3.4% | 18.9% |
| 60 | Beachwood, OH | 13,865 | 5,675 | 73.9% | 10.1% | 1.7% | 9.3% |
| 61 | Steubenville, OH | 18,124 | 5,692 | 73.8% | 13.5% | 5.2% | 0.8% |
| 62 | Mason, OH | 35,509 | 5,720 | 74.0% | 5.0% | 3.9% | 14.0% |
| 63 | New Albany, OH | 10,896 | 5,735 | 74.6% | 4.3% | 5.6% | 9.7% |
| 64 | Bedford Heights, OH | 10,847 | 5,756 | 12.6% | 74.3% | 5.8% | 0.0% |
| 65 | Wyoming, OH | 8,723 | 5,850 | 75.0% | 12.3% | 1.6% | 2.8% |
| 66 | Maple Heights, OH | 23,258 | 5,882 | 21.0% | 73.7% | 1.4% | 0.8% |
| 67 | New Carlisle, OH | 5,544 | 5,893 | 73.4% | 0.8% | 22.2% | 0.0% |
| 68 | Streetsboro, OH | 17,661 | 5,932 | 75.7% | 13.0% | 2.5% | 4.4% |
| 69 | Macedonia, OH | 12,152 | 5,949 | 75.7% | 12.1% | 1.2% | 7.6% |
| 70 | Fairborn, OH | 34,534 | 6,121 | 77.1% | 9.0% | 2.8% | 1.4% |
| 71 | Oxford, OH | 21,753 | 6,131 | 77.5% | 5.7% | 2.4% | 7.9% |
| 72 | Reading, OH | 10,502 | 6,135 | 77.2% | 9.3% | 3.7% | 0.9% |
| 73 | Norwood, OH | 19,114 | 6,143 | 77.2% | 11.3% | 6.6% | 0.6% |
| 74 | Powell, OH | 14,451 | 6,167 | 77.0% | 1.2% | 2.0% | 14.7% |
| 75 | Fostoria, OH | 12,344 | 6,171 | 77.5% | 5.4% | 10.8% | 0.8% |
| 76 | Fairlawn, OH | 7,711 | 6,193 | 77.9% | 8.4% | 3.8% | 4.5% |
| 77 | Hilliard, OH | 38,033 | 6,202 | 78.0% | 4.3% | 5.6% | 7.0% |
| 78 | Defiance, OH | 17,276 | 6,212 | 76.8% | 2.7% | 17.3% | 0.2% |
| 79 | Lyndhurst, OH | 13,801 | 6,222 | 77.7% | 12.4% | 4.5% | 1.8% |
| 80 | Ravenna, OH | 11,274 | 6,281 | 78.3% | 10.3% | 3.1% | 1.4% |
| 81 | Northwood, OH | 5,193 | 6,381 | 78.2% | 0.0% | 15.6% | 2.3% |
| 82 | Middleburg Heights, OH | 15,786 | 6,384 | 79.1% | 3.1% | 6.8% | 8.4% |
| 83 | Martins Ferry, OH | 6,140 | 6,421 | 79.2% | 6.0% | 0.8% | 3.0% |
| 84 | Willard, OH | 6,164 | 6,428 | 78.0% | 0.5% | 18.3% | 0.9% |
| 85 | Berea, OH | 18,218 | 6,434 | 79.5% | 8.0% | 4.0% | 1.3% |
| 86 | Xenia, OH | 25,689 | 6,444 | 79.5% | 7.7% | 2.8% | 1.1% |
| 87 | Marion, OH | 35,669 | 6,450 | 79.5% | 8.5% | 4.0% | 0.5% |
| 88 | Wickliffe, OH | 12,659 | 6,452 | 79.5% | 9.4% | 3.0% | 1.4% |
| 89 | Parma, OH | 79,870 | 6,482 | 79.8% | 5.4% | 8.4% | 3.0% |
| 90 | Delaware, OH | 44,589 | 6,512 | 80.1% | 4.5% | 4.8% | 5.9% |
| 91 | Canal Winchester, OH | 10,170 | 6,599 | 80.2% | 11.3% | 2.0% | 0.7% |
| 92 | Zanesville, OH | 24,740 | 6,603 | 80.5% | 8.5% | 2.2% | 1.3% |
| 93 | Westerville, OH | 38,645 | 6,624 | 80.7% | 8.5% | 2.8% | 2.8% |
| 94 | Riverside, OH | 24,435 | 6,644 | 80.9% | 7.2% | 3.6% | 2.8% |
| 95 | Kent, OH | 27,116 | 6,670 | 81.0% | 8.5% | 2.5% | 3.6% |
| 96 | Beavercreek, OH | 47,126 | 6,723 | 81.5% | 3.0% | 4.7% | 5.0% |
| 97 | Struthers, OH | 9,923 | 6,727 | 81.3% | 2.5% | 9.3% | 1.2% |
| 98 | Athens, OH | 23,396 | 6,745 | 81.6% | 3.7% | 4.2% | 3.2% |
| 99 | Centerville, OH | 25,205 | 6,770 | 81.7% | 6.2% | 5.7% | 2.2% |
| 100 | Bowling Green, OH | 29,983 | 6,774 | 81.7% | 4.6% | 6.7% | 1.9% |


