Before you decide to relocate to Indiana, it’s important to research the exact cost of living around the state. And that’s what we’re going to help you do.
These are the places in Indiana that cost a pretty penny — the most expensive cities in the state.
We used Saturday Night Science to compare the 2020-2024 American Community Survey on cost of living for the 122 places in Indiana with more than 5,000 people.
After we saved up for months and could finally afford it, we landed on this list of the ten most expensive cities in Indiana for 2026.
$172,024 median income · $680,117 median home · #1 home prices in Indiana
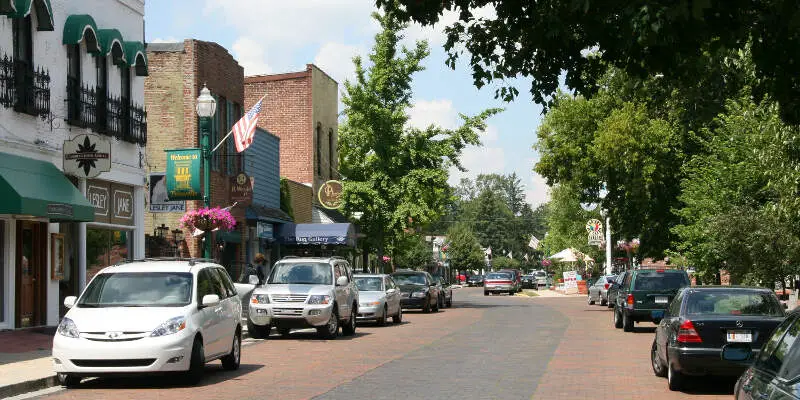
Zionsville is a suburban town located in the extreme southeast area of Boone County, Indiana, United States, northwest of Indianapolis. The population was 14,160 at the 2010 census, and grew to 26,784 in the Census 2016 estimates.
Data | Crime | Cost of living | Movers
$141,505 median income · $563,458 median home · #2 home prices in Indiana
Carmel is a suburban city in Hamilton County, Indiana, United States, located immediately north of Indianapolis. It has been one of the fastest-growing communities in the country. In 2012, Carmel was selected as the “Best Place to Live in the United States” by CNN Money magazine, and received the same designation by Niche.com in 2017. The population was 79,191 as of the 2010 and was estimated to be 91,065 in 2016 by the US Census Bureau, making it the fifth-largest city in Indiana.
Data | Crime | Cost of living | Movers
$135,870 median income · $476,915 median home · #3 home prices in Indiana
Data | Crime | Cost of living | Movers
$122,789 median income · $468,588 median home · #4 home prices in Indiana
Westfield is a city in Hamilton County, Indiana, United States. As of the 2010 census the population was 30,068, and in 2016 the estimated population was 37,221. Westfield is in the Indianapolis Metropolitan Area.
Data | Crime | Cost of living | Movers
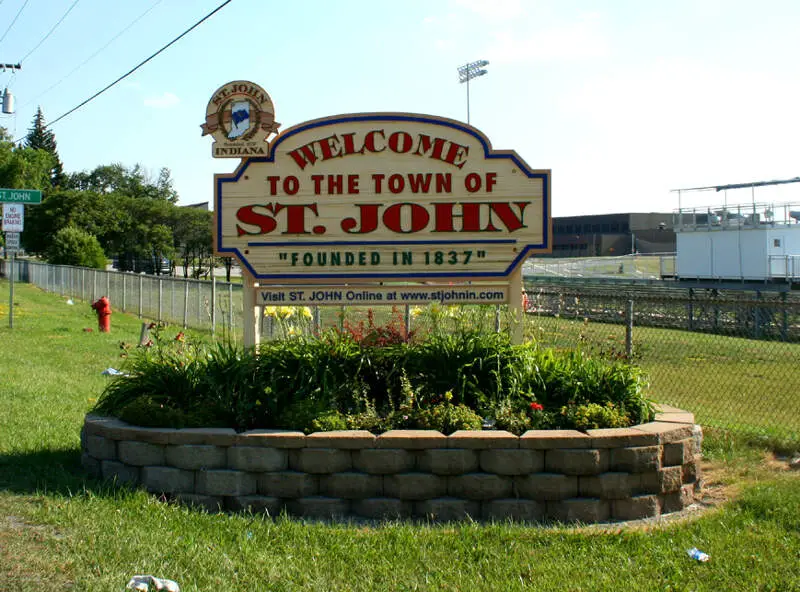
$131,467 median income · $450,806 median home · #5 home prices in Indiana
St. John is a town in Lake County, Indiana, United States. The town of St. John has homes in St. John Township, Hanover Township, and Center Township. St. John was founded in 1837. The population was 14,850 at the 2010 census. In 2009, St. John ranked 48th among CNN’s top 100 places to live in the United States. In 2014, St. John was ranked as the 4th safest place in Indiana by Movoto Real Estate.
Data | Crime | Cost of living | Movers
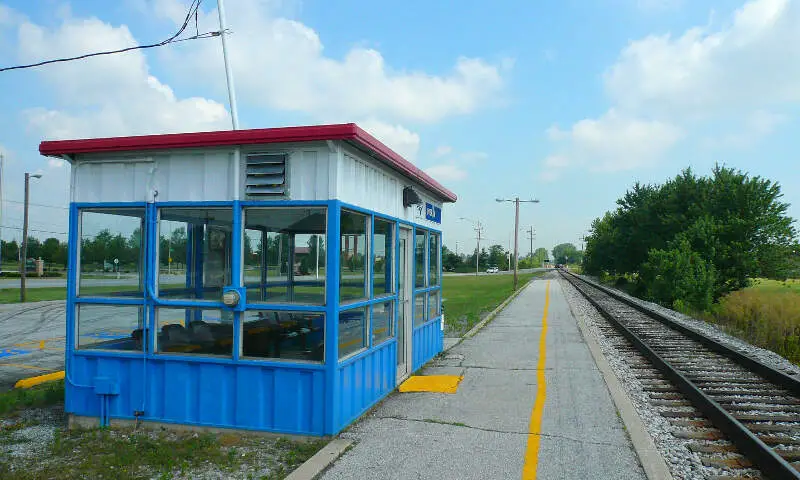
$107,159 median income · $355,530 median home · #14 home prices in Indiana
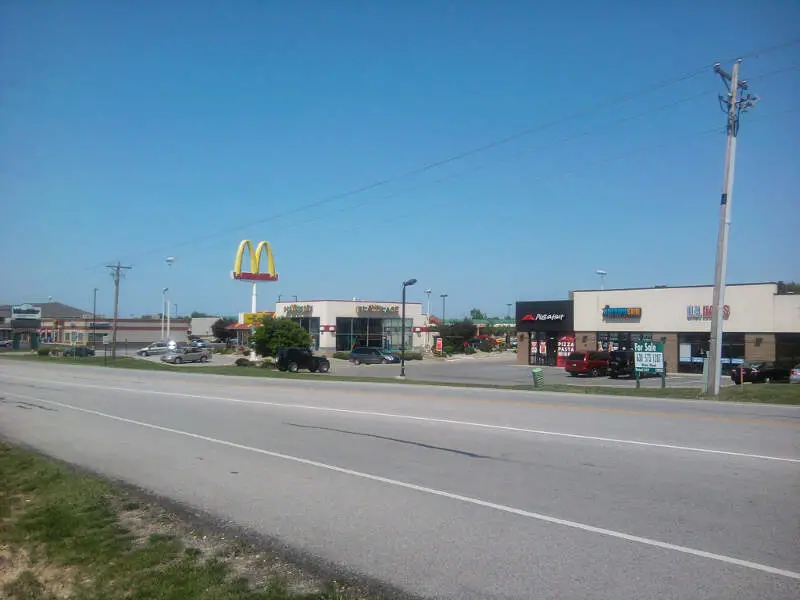
Dyer is a town in St. John Township, Lake County, Indiana, United States. The population was 16,390 at the 2010 census. It lies in the Chicago metropolitan area, 30 miles southeast of The Chicago Loop, and 12 miles from Chicago-s south side.
Data | Crime | Cost of living | Movers
$114,231 median income · $442,137 median home · #6 home prices in Indiana
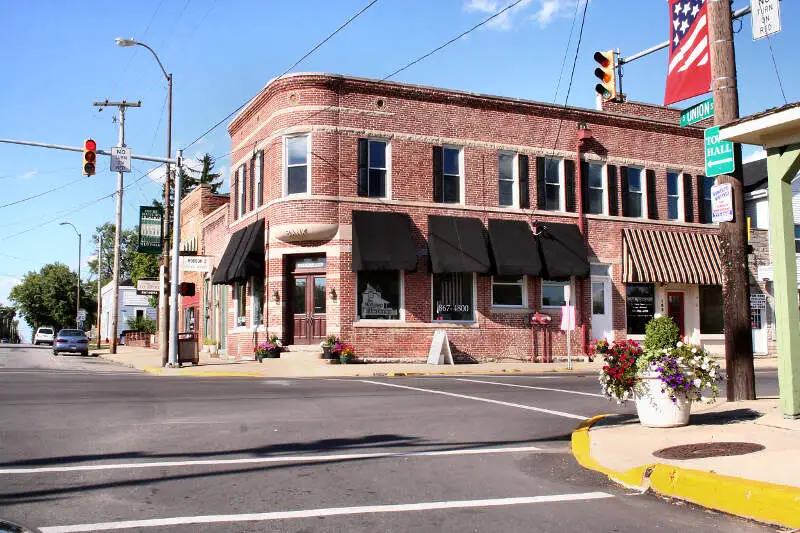
Bargersville is a town in White River and Union townships, Johnson County, Indiana, United States. The population was 4,013 at the 2010 census.
Data | Crime | Cost of living | Movers

$34,891 median income · $363,861 median home · #10 home prices in Indiana
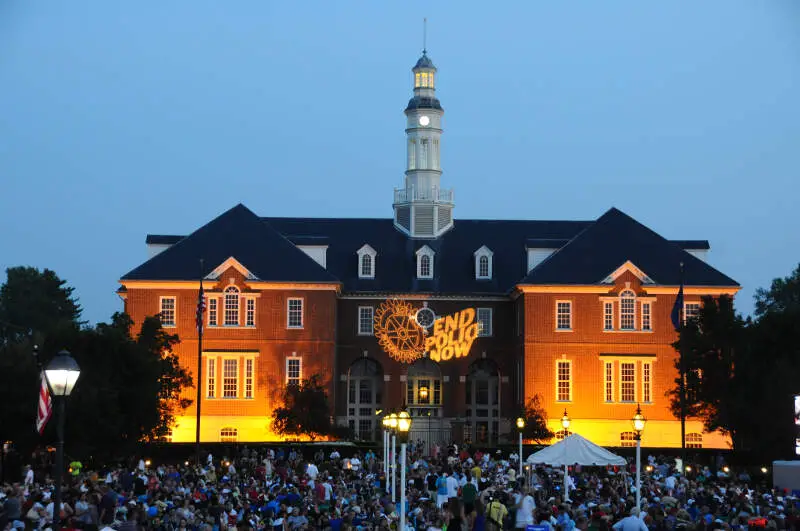
West Lafayette is a city in Wabash Township, Tippecanoe County, Indiana, United States, about 65 miles northwest of the state capital of Indianapolis and 103 miles southeast of Chicago. West Lafayette is directly across the Wabash River from its sister city, Lafayette. As of the 2016 census estimate, its population was 45,872. It is the most densely populated city in Indiana and is home to Purdue University.
Data | Crime | Cost of living | Movers
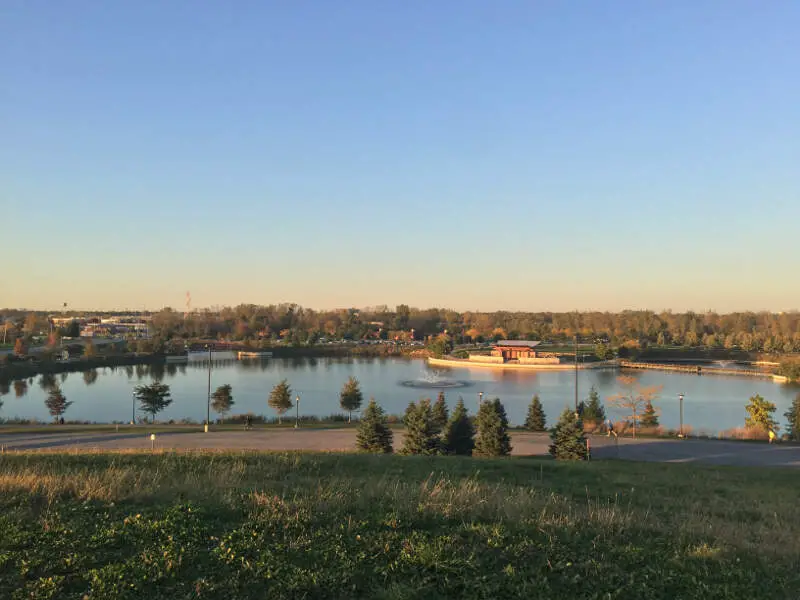
$110,187 median income · $347,952 median home · #18 home prices in Indiana
Munster is a town located in North Township, Lake County, in Northwest Indiana, United States. This bedroom community lies in the Chicago metropolitan area, approximately 30 miles southeast of the Chicago Loop, and shares municipal boundaries with Hammond to the north, Highland to the east, Dyer and Schererville to the south and Lansing and Lynwood directly west of the Illinois border. The 2010 U.S. Census counted the town’s population at 23,603.
Data | Crime | Cost of living | Movers
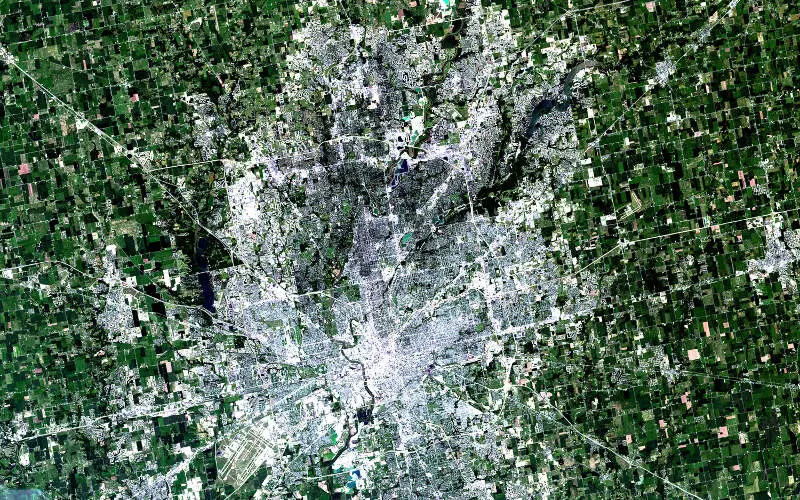
$50,465 median income · $313,960 median home · #27 home prices in Indiana
Bloomington is a city in and the county seat of Monroe County in the southern region of the U.S. state of Indiana. It is the seventh-largest city in Indiana and the fourth-largest outside the Indianapolis metropolitan area. According to the Monroe County History Center, Bloomington is known as the “Gateway to Scenic Southern Indiana.” The city was established in 1818 by a group of settlers from Kentucky, Tennessee, the Carolinas, and Virginia who were so impressed with “a haven of blooms” that they called it Bloomington.
Data | Crime | Cost of living | Movers
The receipts
Compare the top ten
Pick a metric. The bars rescale. The red line is Indiana’s statewide median.
Indiana statewide median: $254,122
Indiana statewide median: $71,957
On the map
Mapping the most expensive places in Indiana
Saturday Night Science
Methodology: How We Determined The Most Expensive Places To Live In The Hoosier State For 2026
The two most important things to think about when it comes to being able to afford a city in Indiana are how much money you make and how much you have to spend to live there.
You need to understand your costs in the context of how much money you make.
For example, if the median household earns $100,000 and spends $40,000 on housing, it’s actually cheaper to live there than a place with a median income of $50,000 and housing costs of $21,000. You might spend more on housing, but you have more money overall to play with.
With that example in mind, we derived several statistics from the latest Census American Community Survey 2020-2024 around incomes and costs. They are:
- Overall Cost Of Living Index
- Median Home Price / Median Income (lower is better)
- Median Income / Median Rent (Higher is better)
- Median Home Price
You can then compare these metrics in each of the places in Indiana to figure out which is the most expensive.
You are left with a “Cost of Living Index” by taking the average rank of each of these metrics for each city.
So we used that cost of living index to rank all of the 122 places in Indiana that have more than 5,000 people.
The place with the highest cost of living in Indiana according to the data is Zionsville. We updated this article for 2026. This article is our eleventh time ranking the most expensive places to live in Indiana. The median Indiana home is 49 years old — old enough that it pays to compare home warranty plans before something expensive breaks.
The full plate
Most Expensive Cities In Indiana
Click any column to sort. Search by city name.
| Rank | City | Cost Of Living | Population | Median Income | Average Home Price | Home/Income Ratio |
|---|---|---|---|---|---|---|
| 1 | Zionsville | 122 | 32,095 | $172,024 | $680,117 | 4.0x |
| 2 | Carmel | 117 | 101,651 | $141,505 | $563,458 | 4.0x |
| 3 | Winfield | 116 | 7,816 | $135,870 | $476,915 | 3.5x |
| 4 | Westfield | 112 | 54,677 | $122,789 | $468,588 | 3.8x |
| 5 | St. John | 110 | 22,567 | $131,467 | $450,806 | 3.4x |
| 6 | Dyer | 107 | 16,400 | $107,159 | $355,530 | 3.3x |
| 7 | Bargersville | 107 | 10,752 | $114,231 | $442,137 | 3.9x |
| 8 | West Lafayette | 104 | 45,159 | $34,891 | $363,861 | 10.4x |
| 9 | Munster | 104 | 23,733 | $110,187 | $347,952 | 3.2x |
| 10 | Bloomington | 103 | 80,049 | $50,465 | $313,960 | 6.2x |
| 11 | Noblesville | 103 | 73,362 | $104,047 | $389,215 | 3.7x |
| 12 | Crown Point | 103 | 34,393 | $101,686 | $354,995 | 3.5x |
| 13 | Schererville | 103 | 29,701 | $89,466 | $352,735 | 3.9x |
| 14 | Avon | 103 | 23,437 | $98,486 | $352,859 | 3.6x |
| 15 | Brownsburg | 102 | 31,215 | $102,235 | $356,184 | 3.5x |
| 16 | McCordsville | 102 | 10,329 | $110,692 | $375,788 | 3.4x |
| 17 | Plainfield | 101 | 36,369 | $87,272 | $331,618 | 3.8x |
| 18 | Porter | 101 | 5,217 | $74,542 | $297,623 | 4.0x |
| 19 | Cedar Lake | 98 | 15,295 | $83,381 | $328,156 | 3.9x |
| 20 | Chesterton | 98 | 14,446 | $91,060 | $340,855 | 3.7x |
| 21 | Lowell | 98 | 11,073 | $84,024 | $329,211 | 3.9x |
| 22 | Cicero | 98 | 5,509 | $66,934 | $401,400 | 6.0x |
| 23 | Sellersburg | 97 | 10,137 | $72,179 | $296,867 | 4.1x |
| 24 | Cumberland | 97 | 6,267 | $87,364 | $289,409 | 3.3x |
| 25 | Greenwood | 96 | 66,029 | $83,608 | $326,491 | 3.9x |
| 26 | Columbus | 96 | 51,824 | $77,456 | $276,890 | 3.6x |
| 27 | Portage | 96 | 38,082 | $76,276 | $264,578 | 3.5x |
| 28 | Valparaiso | 96 | 34,733 | $69,872 | $355,845 | 5.1x |
| 29 | Franklin | 96 | 26,168 | $82,380 | $279,168 | 3.4x |
| 30 | Pendleton | 96 | 5,321 | $86,806 | $334,739 | 3.9x |
| 31 | Jeffersonville | 95 | 51,043 | $70,930 | $251,611 | 3.5x |
| 32 | Lawrence | 95 | 49,517 | $74,022 | $268,725 | 3.6x |
| 33 | Hobart | 95 | 29,558 | $75,160 | $238,196 | 3.2x |
| 34 | Griffith | 95 | 16,273 | $76,636 | $247,099 | 3.2x |
| 35 | Danville | 95 | 11,714 | $97,083 | $337,029 | 3.5x |
| 36 | Winona Lake | 95 | 5,080 | $82,188 | $297,378 | 3.6x |
| 37 | Indianapolis | 94 | 885,860 | $66,219 | $229,209 | 3.5x |
| 38 | Highland | 94 | 23,680 | $78,062 | $262,852 | 3.4x |
| 39 | Whiteland | 94 | 5,173 | $96,944 | $296,965 | 3.1x |
| 40 | Greenfield | 93 | 24,940 | $76,127 | $285,066 | 3.7x |
| 41 | Clarksville | 93 | 22,016 | $60,467 | $203,069 | 3.4x |
| 42 | Mooresville | 93 | 9,751 | $68,983 | $308,099 | 4.5x |
| 43 | Ellettsville | 93 | 6,698 | $90,213 | $274,445 | 3.0x |
| 44 | Merrillville | 92 | 36,476 | $67,587 | $240,329 | 3.6x |
| 45 | Speedway | 92 | 13,968 | $60,147 | $236,684 | 3.9x |
| 46 | Madison | 92 | 12,223 | $61,183 | $240,680 | 3.9x |
| 47 | Fort Wayne | 91 | 268,589 | $61,422 | $242,385 | 3.9x |
| 48 | Seymour | 91 | 22,371 | $64,426 | $230,829 | 3.6x |
| 49 | Charlestown | 91 | 8,294 | $77,288 | $302,064 | 3.9x |
| 50 | Batesville | 91 | 7,282 | $62,292 | $317,505 | 5.1x |
| 51 | Mount Vernon | 91 | 6,400 | $62,263 | $221,083 | 3.6x |
| 52 | New Albany | 90 | 37,581 | $54,710 | $235,058 | 4.3x |
| 53 | Jasper | 90 | 15,991 | $68,817 | $266,264 | 3.9x |
| 54 | Auburn | 90 | 13,565 | $68,750 | $275,151 | 4.0x |
| 55 | Greensburg | 90 | 12,229 | $62,655 | $261,666 | 4.2x |
| 56 | Greencastle | 90 | 9,864 | $55,565 | $243,386 | 4.4x |
| 57 | Angola | 90 | 9,408 | $64,540 | $302,980 | 4.7x |
| 58 | Westville | 90 | 5,279 | $60,794 | $357,284 | 5.9x |
| 59 | Lebanon | 89 | 17,812 | $65,154 | $299,032 | 4.6x |
| 60 | Warsaw | 89 | 16,768 | $61,035 | $271,691 | 4.5x |
| 61 | New Haven | 89 | 15,698 | $70,970 | $240,073 | 3.4x |
| 62 | Columbia City | 89 | 9,897 | $68,089 | $279,168 | 4.1x |
| 63 | Nappanee | 89 | 6,815 | $68,892 | $288,904 | 4.2x |
| 64 | New Whiteland | 89 | 5,704 | $89,918 | $228,047 | 2.5x |
| 65 | Evansville | 88 | 116,116 | $53,387 | $198,977 | 3.7x |
| 66 | Lafayette | 88 | 71,159 | $53,716 | $262,731 | 4.9x |
| 67 | Goshen | 88 | 34,420 | $59,184 | $275,120 | 4.6x |
| 68 | Michigan City | 88 | 31,814 | $53,089 | $187,488 | 3.5x |
| 69 | Bedford | 88 | 13,837 | $49,553 | $207,924 | 4.2x |
| 70 | Martinsville | 88 | 11,933 | $60,177 | $288,805 | 4.8x |
| 71 | Kendallville | 88 | 10,556 | $58,939 | $220,523 | 3.7x |
| 72 | Scottsburg | 88 | 7,362 | $38,578 | $187,044 | 4.8x |
| 73 | Tipton | 88 | 5,280 | $59,828 | $237,894 | 4.0x |
| 74 | Kokomo | 87 | 59,122 | $55,360 | $180,398 | 3.3x |
| 75 | Terre Haute | 87 | 58,427 | $43,126 | $155,802 | 3.6x |
| 76 | Washington | 87 | 12,367 | $50,331 | $147,888 | 2.9x |
| 77 | Decatur | 87 | 9,811 | $58,646 | $229,668 | 3.9x |
| 78 | Brazil | 87 | 7,831 | $52,055 | $188,386 | 3.6x |
| 79 | North Vernon | 87 | 7,078 | $51,429 | $212,243 | 4.1x |
| 80 | Rensselaer | 87 | 5,573 | $60,331 | $242,741 | 4.0x |
| 81 | Lawrenceburg | 87 | 5,179 | $51,250 | $248,401 | 4.8x |
| 82 | Hammond | 86 | 76,768 | $55,504 | $170,817 | 3.1x |
| 83 | Shelbyville | 86 | 20,296 | $55,602 | $222,049 | 4.0x |
| 84 | Crawfordsville | 86 | 16,491 | $55,033 | $219,773 | 4.0x |
| 85 | Frankfort | 86 | 15,917 | $57,412 | $209,856 | 3.7x |
| 86 | Beech Grove | 86 | 14,913 | $49,973 | $191,935 | 3.8x |
| 87 | Princeton | 86 | 8,372 | $57,618 | $187,283 | 3.3x |
| 88 | Garrett | 86 | 6,642 | $64,179 | $187,134 | 2.9x |
| 89 | Rochester | 86 | 6,215 | $57,008 | $210,468 | 3.7x |
| 90 | Monticello | 86 | 5,496 | $52,798 | $235,505 | 4.5x |
| 91 | South Bend | 85 | 103,085 | $55,786 | $192,340 | 3.4x |
| 92 | Mishawaka | 85 | 51,021 | $54,291 | $206,367 | 3.8x |
| 93 | Richmond | 85 | 35,581 | $45,399 | $156,510 | 3.4x |
| 94 | La Porte | 85 | 22,449 | $59,307 | $271,481 | 4.6x |
| 95 | Bluffton | 85 | 10,529 | $57,539 | $183,603 | 3.2x |
| 96 | Salem | 85 | 6,489 | $56,538 | $208,086 | 3.7x |
| 97 | Elkhart | 84 | 53,733 | $51,028 | $222,794 | 4.4x |
| 98 | East Chicago | 84 | 26,022 | $42,125 | $128,171 | 3.0x |
| 99 | Lake Station | 84 | 13,185 | $59,591 | $151,774 | 2.5x |
| 100 | Plymouth | 84 | 10,664 | $58,623 | $238,868 | 4.1x |
Source: U.S. Census ACS 2020-2024, Zillow research. 122 places with more than 5,000 residents.
Summary
Summary: Taking A Chunk Out Of Your Paycheck In Indiana For 2026
Well, there you have it, the places in Indiana that have the highest cost of living, with Zionsville ranking as the most expensive city in the Hoosier State.
The most expensive cities in Indiana are Zionsville, Carmel, Winfield, Westfield, St. John, Dyer, Bargersville, West Lafayette, Munster, and Bloomington. Not sold on Indiana? Take the two-minute Find Your Place quiz and see which state actually fits you.
Questions and answers
Most Expensive Places In Indiana FAQs
What is the most expensive place to live in Indiana?
Zionsville is the most expensive place to live in Indiana for 2026. The median home there runs $680,117, and it posts the highest cost of living of the 122 places we scored.
What are the 10 most expensive cities in Indiana?
The ten most expensive cities in Indiana are Zionsville, Carmel, Winfield, Westfield, St. John, Dyer, Bargersville, West Lafayette, Munster, and Bloomington. We ranked all 122 places with more than 5,000 residents on home prices, incomes, and an overall cost of living index.
How expensive are homes in Zionsville?
The median home value in Zionsville is $680,117, versus $254,122 across Indiana as a whole. Across the ten most expensive cities, the median home runs $446,472.
What salary do you need to live in the most expensive parts of Indiana?
The median household income in the ten most expensive Indiana cities starts at $34,891, and in Zionsville it is $172,024. If your paycheck is closer to the statewide median of $71,957, these places will squeeze your budget.
What is the cheapest place to live in Indiana?
Peru is the cheapest of the 122 Indiana places we ranked on cost of living. It sits at the very bottom of the same index that put Zionsville on top.


