
Most Hispanic/Latino cities in Ohio research summary. We used Saturday Night Science to analyze Ohio’s most recent Census data to determine the most Hispanic/Latino cities based on the percentage of Hispanic/Latino residents. Here are the results of our analysis:
-
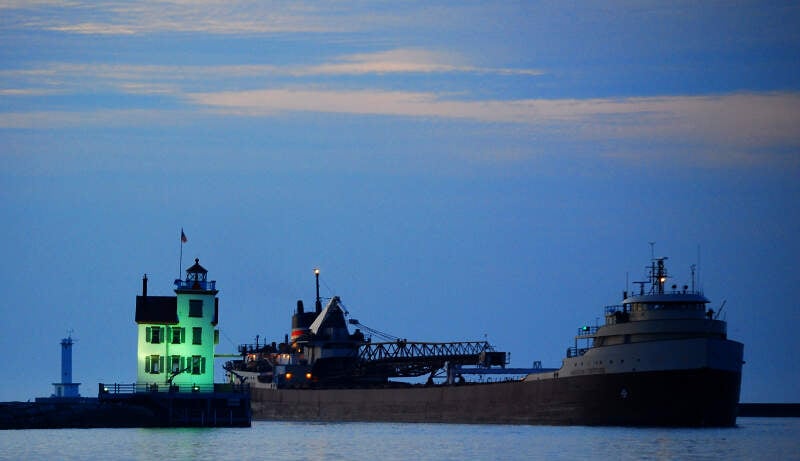
The most Hispanic/Latino city in Ohio is Lorain, based on the most recent Census data.
-
Lorain is 28.32% Hispanic/Latino.
-
The least Hispanic/Latino city in Ohio is Milford.
-
Milford is 0.0% Hispanic/Latino.
-
Ohio is 4.8% Hispanic/Latino.
-
Ohio is the 43rd most Hispanic/Latino state in the United States.
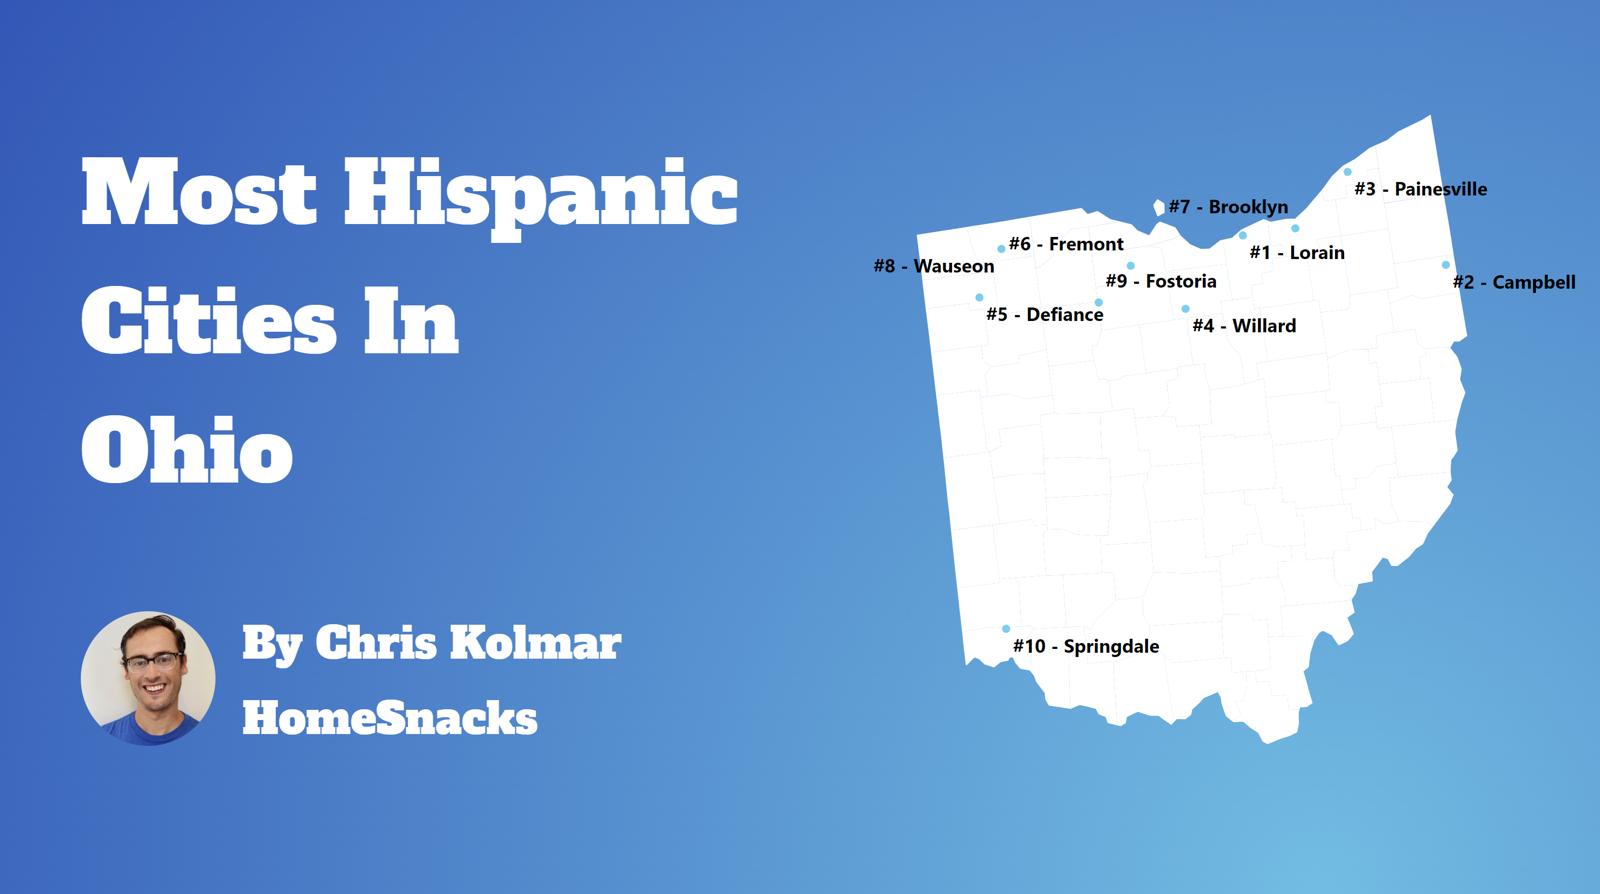
Table Of Contents: Top Ten | Methodology | Summary | Table
The 10 Cities In Ohio With The Largest Hispanic Population For 2026
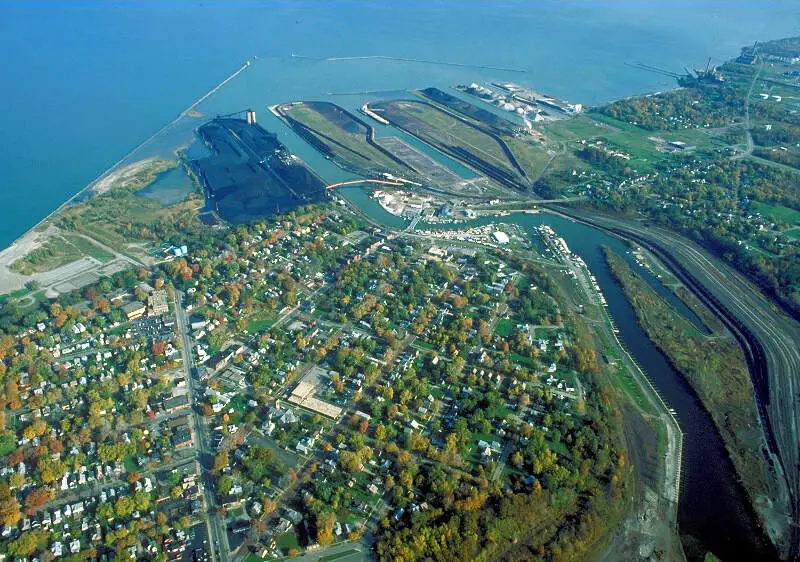
What’s the city in Ohio with the largest Hispanic/Latino population? Lorain took the number one overall spot for the largest Hispanic population in Ohio for 2026.
Continue below to see how we crunched the numbers and how your town ranked.
To see where Ohio ranked as a state on diversity, we have a ranking of the most diverse states in America.
And if you already knew these places were Hispanic, check out the best places to live in Ohio or the safest places in Ohio.

/10
Population: 65,395
# Of Hispanic/Latino Residents: 18,520
% Hispanic/Latino: 28.32%
More on Lorain: Data | Crime | Cost Of Living | Movers


/10
Population: 20,548
# Of Hispanic/Latino Residents: 5,293
% Hispanic/Latino: 25.76%
More on Painesville: Data | Cost Of Living | Movers

/10
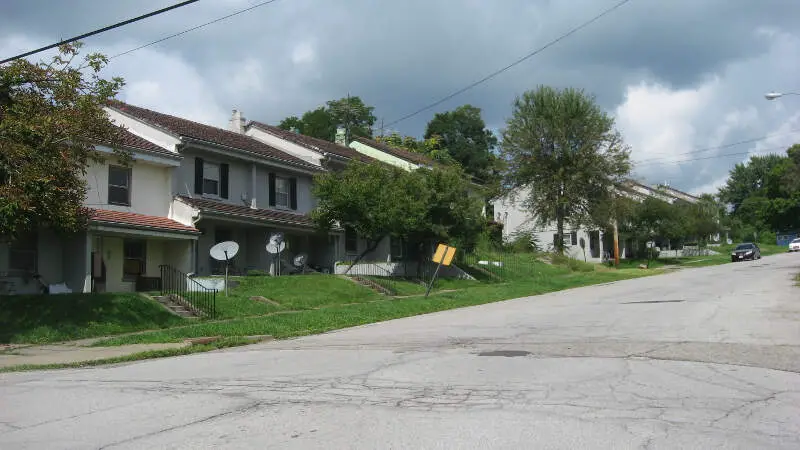
Population: 7,784
# Of Hispanic/Latino Residents: 1,774
% Hispanic/Latino: 22.79%
More on Campbell: Data | Crime | Cost Of Living | Movers

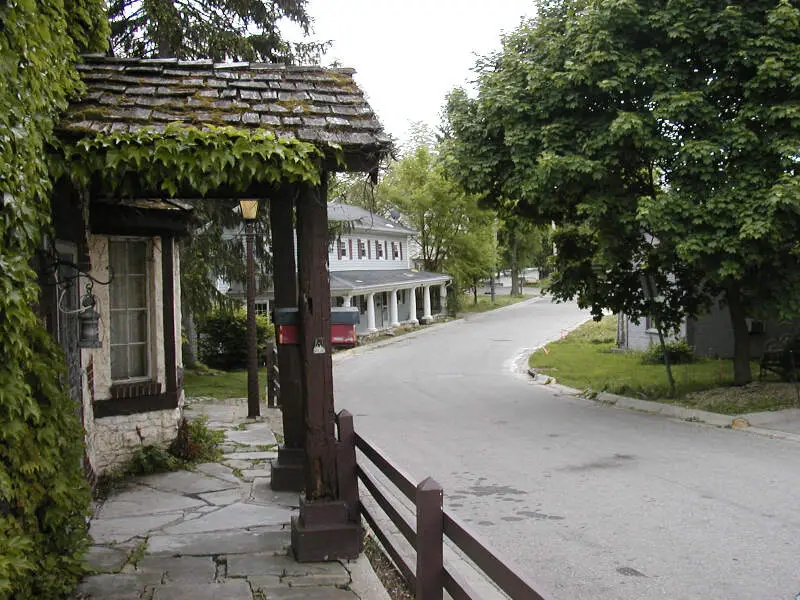
/10
Population: 5,544
# Of Hispanic/Latino Residents: 1,228
% Hispanic/Latino: 22.15%
More on New Carlisle: Data | Cost Of Living | Movers

/10
Population: 6,164
# Of Hispanic/Latino Residents: 1,131
% Hispanic/Latino: 18.35%
More on Willard: Data | Crime | Cost Of Living | Movers

/10
Population: 17,276
# Of Hispanic/Latino Residents: 2,987
% Hispanic/Latino: 17.29%
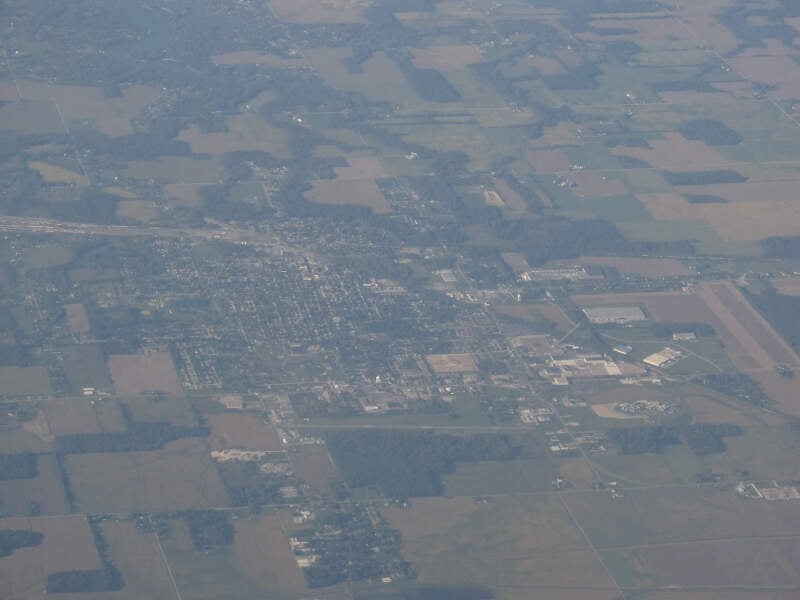
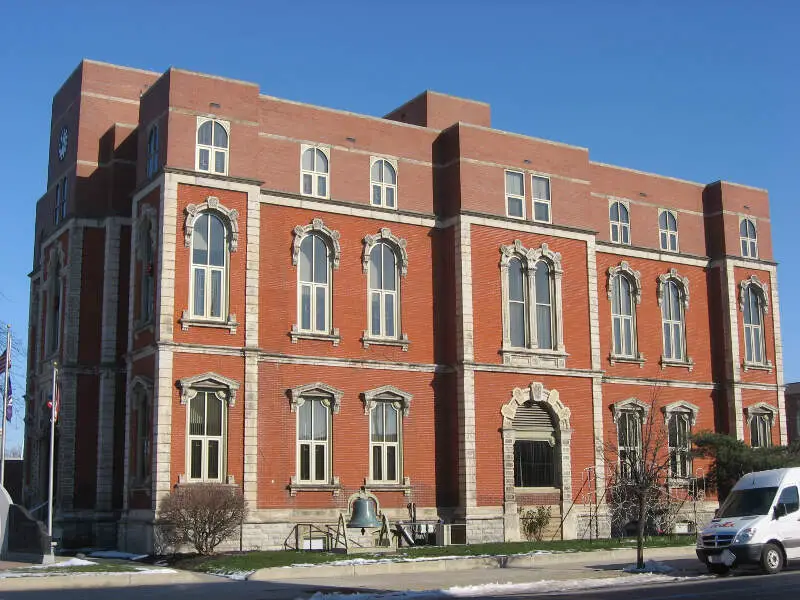
More on Defiance: Data | Crime | Cost Of Living | Movers

/10
Population: 15,835
# Of Hispanic/Latino Residents: 2,632
% Hispanic/Latino: 16.62%
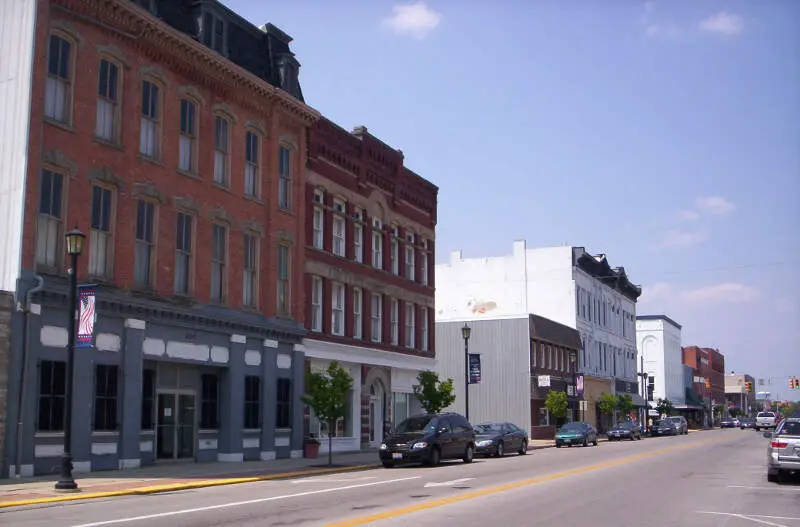
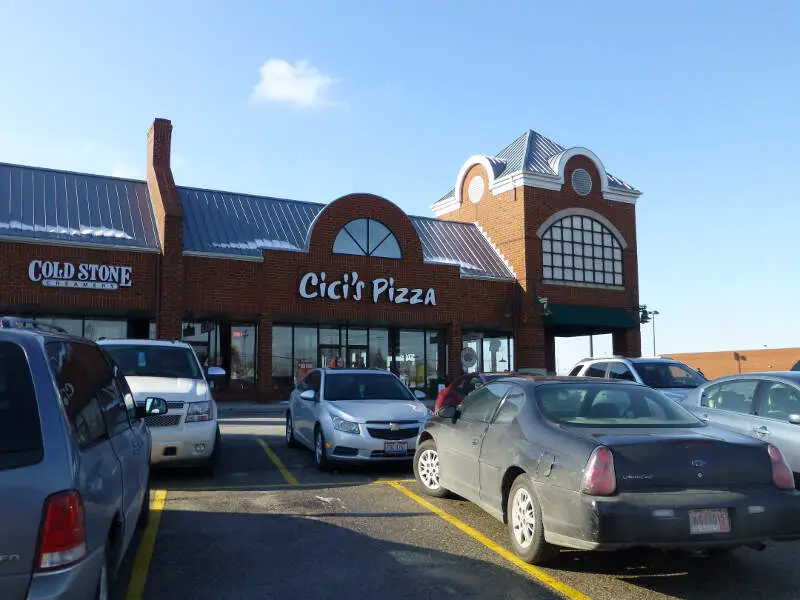
More on Fremont: Data | Crime | Cost Of Living | Movers

/10
Population: 11,158
# Of Hispanic/Latino Residents: 1,826
% Hispanic/Latino: 16.36%
More on Brooklyn: Data | Crime | Cost Of Living | Movers
/10
Population: 5,193
# Of Hispanic/Latino Residents: 808
% Hispanic/Latino: 15.56%
More on Northwood: Data | Crime | Cost Of Living | Movers

/10
Population: 17,856
# Of Hispanic/Latino Residents: 2,498
% Hispanic/Latino: 13.99%
More on Ashtabula: Data | Cost Of Living | Movers
Methodology: How We Determined The Cities In Ohio With The Largest Hispanic Population For 2026
We used Saturday Night Science to compare data on race from the US Census for every city in Ohio.
Ohio’s most recently available data comes from the 2020-2024 American Community Survey.
Specifically, we looked at table B03002: Hispanic OR LATINO ORIGIN BY RACE. Here are the category names as defined by the Census:
- Hispanic or Latino
- White alone*
- Black or African American alone*
- American Indian and Alaska Native alone*
- Asian alone*
- Native Hawaiian and Other Pacific Islander alone*
- Some other race alone*
- Two or more races*
Our particular column of interest here was the number of people who identified as Hispanic or Latino.
We limited our analysis to places in Ohio with a population greater than 5,000 people. That left us with 243 cities.
We then calculated the percentage of Hispanic or Latino residents in each Ohio city. The percentages ranked from 28.3% to 0.0%.
Finally, we ranked each city based on the percentage of the Hispanic or Latino population, with a higher score being more Hispanic or Latino than a lower score. Lorain was the most Hispanic or Latino, while Milford was the least Hispanic or Latino city.
We updated this article for 2026. This article represents our eleventh time ranking the cities in Ohio with the largest Hispanic/Latino population.
Read on for more information on how the cities in Ohio ranked by population of Hispanic or Latino residents or, for a more general take on diversity in America, head over to our ranking of the most diverse cities in America.
Summary: Hispanic or Latino Populations Across Ohio
According to the most recent data, this is an accurate list if you’re looking for a breakdown of Latino populations for each place across Ohio.
The most Hispanic/Latino cities in Ohio are Lorain, Painesville, Campbell, New Carlisle, Willard, Defiance, Fremont, Brooklyn, Northwood, and Ashtabula.
If you’re curious enough, here are the least Hispanic or Latino places in Ohio:
- Milford
- Eaton
- Wellston
For more Ohio reading, check out:
Most Hispanic Cities In Ohio
| Rank | City | Population | Hispanic Pop. | % Hispanic |
|---|---|---|---|---|
| 1 | Lorain | 65,395 | 18,520 | 28.32% |
| 2 | Painesville | 20,548 | 5,293 | 25.76% |
| 3 | Campbell | 7,784 | 1,774 | 22.79% |
| 4 | New Carlisle | 5,544 | 1,228 | 22.15% |
| 5 | Willard | 6,164 | 1,131 | 18.35% |
| 6 | Defiance | 17,276 | 2,987 | 17.29% |
| 7 | Fremont | 15,835 | 2,632 | 16.62% |
| 8 | Brooklyn | 11,158 | 1,826 | 16.36% |
| 9 | Northwood | 5,193 | 808 | 15.56% |
| 10 | Ashtabula | 17,856 | 2,498 | 13.99% |
| 11 | Grafton | 5,657 | 788 | 13.93% |
| 12 | Wauseon | 7,505 | 1,018 | 13.56% |
| 13 | Cleveland | 366,097 | 48,496 | 13.25% |
| 14 | Moraine | 6,536 | 865 | 13.23% |
| 15 | Sharonville | 14,030 | 1,752 | 12.49% |
| 16 | Youngstown | 59,331 | 7,287 | 12.28% |
| 17 | Hamilton | 63,468 | 7,637 | 12.03% |
| 18 | Fairfield | 44,828 | 5,099 | 11.37% |
| 19 | Whitehall | 20,019 | 2,180 | 10.89% |
| 20 | Forest Park | 20,025 | 2,167 | 10.82% |
| 21 | Fostoria | 12,344 | 1,329 | 10.77% |
| 22 | Elyria | 53,035 | 5,557 | 10.48% |
| 23 | Springdale | 11,033 | 1,139 | 10.32% |
| 24 | New Philadelphia | 17,520 | 1,787 | 10.2% |
| 25 | Sheffield Lake | 8,966 | 907 | 10.12% |
| 26 | Struthers | 9,923 | 924 | 9.31% |
| 27 | Bellevue | 8,187 | 761 | 9.3% |
| 28 | Toledo | 267,463 | 24,330 | 9.1% |
| 29 | Norwalk | 17,095 | 1,505 | 8.8% |
| 30 | Oregon | 19,799 | 1,737 | 8.77% |
| 31 | Findlay | 40,287 | 3,443 | 8.55% |
| 32 | West Carrollton | 12,976 | 1,102 | 8.49% |
| 33 | Parma | 79,870 | 6,710 | 8.4% |
| 34 | Columbus | 914,802 | 75,585 | 8.26% |
| 35 | Middletown | 51,617 | 4,241 | 8.22% |
| 36 | Oberlin | 8,329 | 672 | 8.07% |
| 37 | Dover | 13,053 | 994 | 7.62% |
| 38 | Maumee | 13,715 | 1,024 | 7.47% |
| 39 | North Olmsted | 31,924 | 2,380 | 7.46% |
| 40 | Amherst | 12,906 | 898 | 6.96% |
| 41 | Napoleon | 8,802 | 608 | 6.91% |
| 42 | Garfield Heights | 29,269 | 1,988 | 6.79% |
| 43 | Middleburg Heights | 15,786 | 1,068 | 6.77% |
| 44 | Canton | 69,755 | 4,693 | 6.73% |
| 45 | Bowling Green | 29,983 | 2,000 | 6.67% |
| 46 | Norwood | 19,114 | 1,270 | 6.64% |
| 47 | Port Clinton | 5,970 | 392 | 6.57% |
| 48 | Reynoldsburg | 41,224 | 2,699 | 6.55% |
| 49 | Upper Sandusky | 6,558 | 409 | 6.24% |
| 50 | Sandusky | 24,606 | 1,510 | 6.14% |
| 51 | Brook Park | 18,284 | 1,112 | 6.08% |
| 52 | Cincinnati | 311,224 | 18,909 | 6.08% |
| 53 | Madeira | 9,484 | 575 | 6.06% |
| 54 | North Ridgeville | 36,627 | 2,209 | 6.03% |
| 55 | Sylvania | 19,055 | 1,128 | 5.92% |
| 56 | St. Marys | 8,301 | 490 | 5.9% |
| 57 | Bedford Heights | 10,847 | 625 | 5.76% |
| 58 | Marysville | 27,518 | 1,578 | 5.73% |
| 59 | Dayton | 136,579 | 7,759 | 5.68% |
| 60 | Centerville | 25,205 | 1,430 | 5.67% |
| 61 | Van Wert | 10,790 | 611 | 5.66% |
| 62 | Montgomery | 10,855 | 609 | 5.61% |
| 63 | Hilliard | 38,033 | 2,122 | 5.58% |
| 64 | Springfield | 58,190 | 3,238 | 5.56% |
| 65 | Loveland | 13,197 | 734 | 5.56% |
| 66 | Huber Heights | 43,455 | 2,369 | 5.45% |
| 67 | Rossford | 6,323 | 344 | 5.44% |
| 68 | Geneva | 5,886 | 316 | 5.37% |
| 69 | Columbiana | 6,903 | 364 | 5.27% |
| 70 | Steubenville | 18,124 | 943 | 5.2% |
| 71 | Tiffin | 17,818 | 916 | 5.14% |
| 72 | Perrysburg | 25,181 | 1,291 | 5.13% |
| 73 | Olmsted Falls | 8,639 | 441 | 5.1% |
| 74 | Monroe | 15,401 | 785 | 5.1% |
| 75 | St. Clairsville | 5,003 | 254 | 5.08% |
| 76 | Franklin | 11,712 | 574 | 4.9% |
| 77 | Pataskala | 18,223 | 888 | 4.87% |
| 78 | Delaware | 44,589 | 2,156 | 4.84% |
| 79 | Lima | 35,010 | 1,670 | 4.77% |
| 80 | Mount Healthy | 6,919 | 328 | 4.74% |
| 81 | Clyde | 6,331 | 298 | 4.71% |
| 82 | Beavercreek | 47,126 | 2,208 | 4.69% |
| 83 | Girard | 9,505 | 439 | 4.62% |
| 84 | Lyndhurst | 13,801 | 625 | 4.53% |
| 85 | North Royalton | 30,972 | 1,398 | 4.51% |
| 86 | Medina | 25,950 | 1,151 | 4.44% |
| 87 | Westlake | 34,104 | 1,511 | 4.43% |
| 88 | Brunswick | 35,246 | 1,560 | 4.43% |
| 89 | Bedford | 12,931 | 567 | 4.38% |
| 90 | Mayfield Heights | 20,022 | 874 | 4.37% |
| 91 | Orrville | 8,343 | 363 | 4.35% |
| 92 | Bryan | 8,631 | 375 | 4.34% |
| 93 | Fairview Park | 17,018 | 737 | 4.33% |
| 94 | Shaker Heights | 28,922 | 1,248 | 4.32% |
| 95 | Vermilion | 10,343 | 446 | 4.31% |
| 96 | Parma Heights | 20,581 | 887 | 4.31% |
| 97 | Lakewood | 50,007 | 2,155 | 4.31% |
| 98 | Akron | 189,247 | 8,094 | 4.28% |
| 99 | Grove City | 42,517 | 1,799 | 4.23% |
| 100 | Athens | 23,396 | 978 | 4.18% |