Most Native American places in Ohio research summary. We used Saturday Night Science to research the Ohio cities with the highest percentage of Native American residents for 2026. The data comes from the American Community Survey 2020-2024 vintage, which breaks down race by origin.
-
The city with the highest percentage of Native Americans is Deer Park. 0.71% of people in Deer Park are Native Americans.
-
The city with the lowest percentage of Native Americans is Broadview Heights. 0.00% of people in Broadview Heights are Native American.
-
The city with the most Native Americans is Columbus. 625 people in Columbus are Native American.
-
The city with the fewest Native Americans is Broadview Heights. 0 people in Broadview Heights are Native American.
-
The United States has 1,698,432 Native Americans and is 0.51% Native American.
Table Of Contents: Top Ten | Methodology | Summary | Table
The 10 Cities In Ohio With The Largest Native American Population For 2026
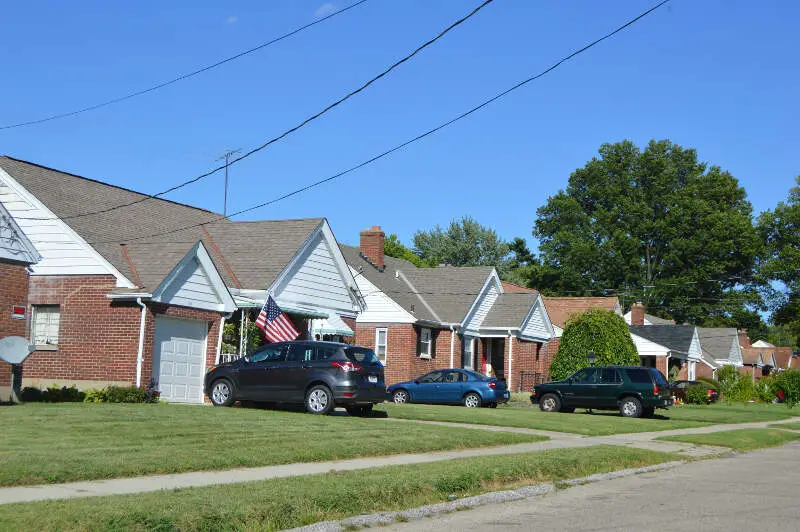
Which city in Ohio had the largest Native American population? The place with the largest Native American population in Ohio for 2026 is Deer Park. 0.71 of Deer Park identify as Native American.
To see where Ohio ranked as a state on diversity, we have a ranking of the most diverse states in America.
And if you already knew these places were Native American, check out the best places to live in Ohio or the most diverse places in Ohio.
Read below to see how we crunched the numbers and how your town ranked.
Cities In Ohio With The Largest Native American Population For 2026

/10
Population: 5,384
# Of Native American Residents: 38
% Native American: 0.71%
More on Deer Park: Data | Crime | Cost Of Living | Movers

/10
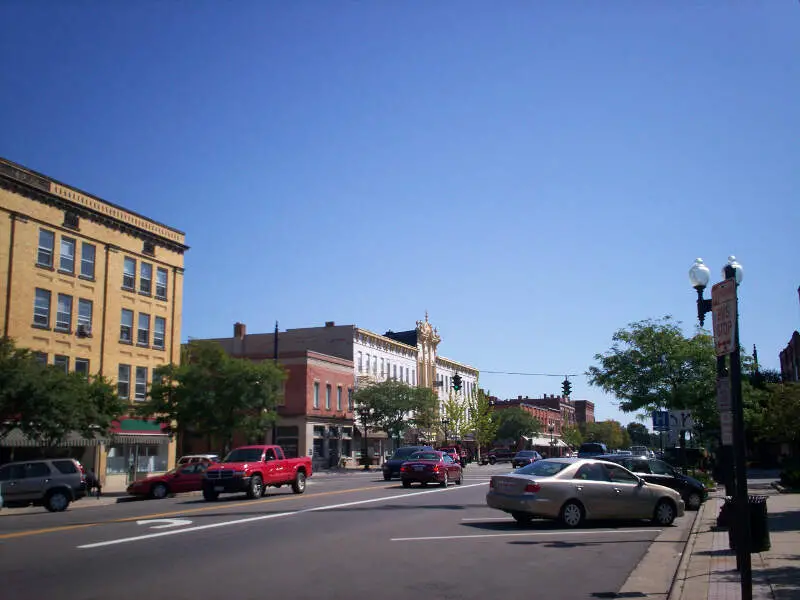
Population: 11,274
# Of Native American Residents: 58
% Native American: 0.51%
More on Ravenna: Data | Cost Of Living | Movers

/10
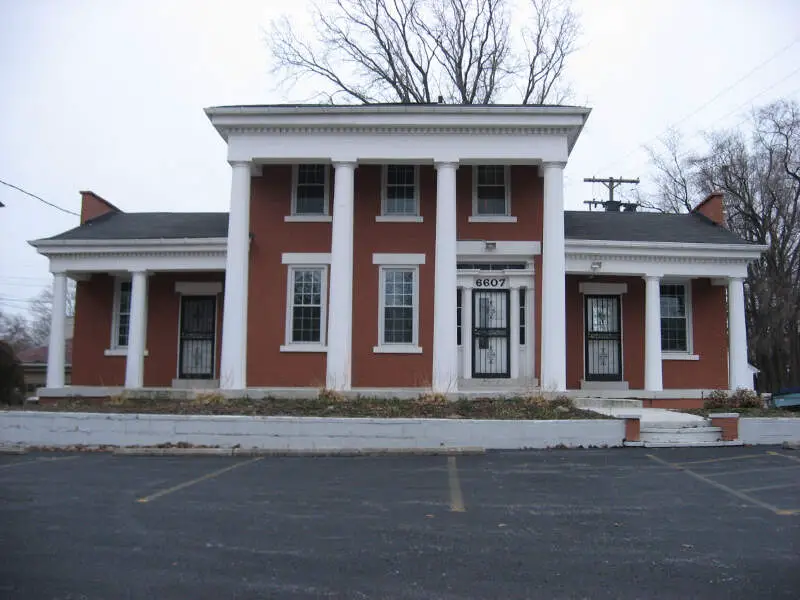
Population: 20,581
# Of Native American Residents: 105
% Native American: 0.51%
More on Parma Heights: Data | Crime | Cost Of Living | Movers
/10
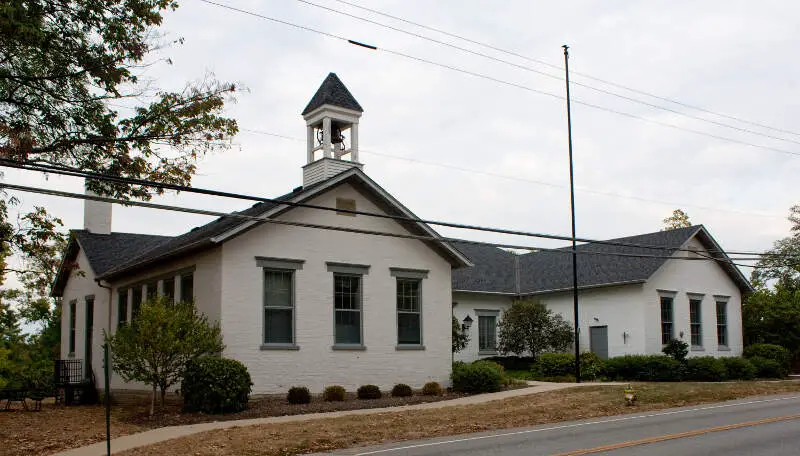
Population: 6,052
# Of Native American Residents: 30
% Native American: 0.5%
More on The Village Of Indian Hill: Data | Cost Of Living | Movers

/10
Population: 6,527
# Of Native American Residents: 30
% Native American: 0.46%
More on Hillsboro: Data | Crime | Cost Of Living | Movers

/10
Population: 35,010
# Of Native American Residents: 153
% Native American: 0.44%
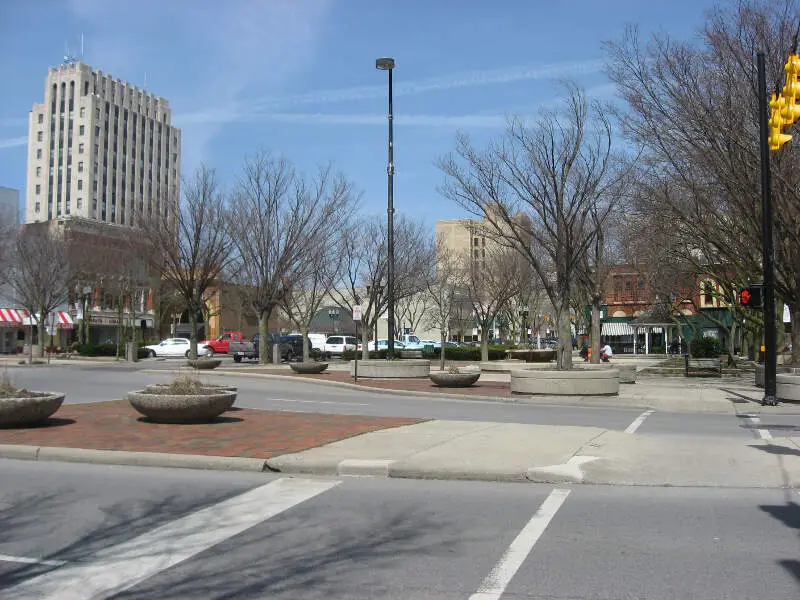
More on Lima: Data | Crime | Cost Of Living | Movers

/10
Population: 10,790
# Of Native American Residents: 44
% Native American: 0.41%
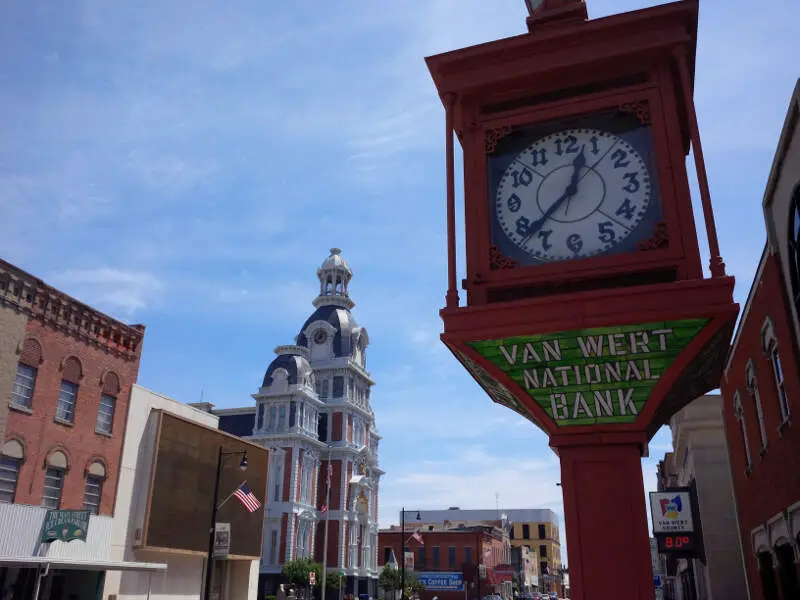
More on Van Wert: Data | Crime | Cost Of Living | Movers


/10
Population: 20,548
# Of Native American Residents: 80
% Native American: 0.39%
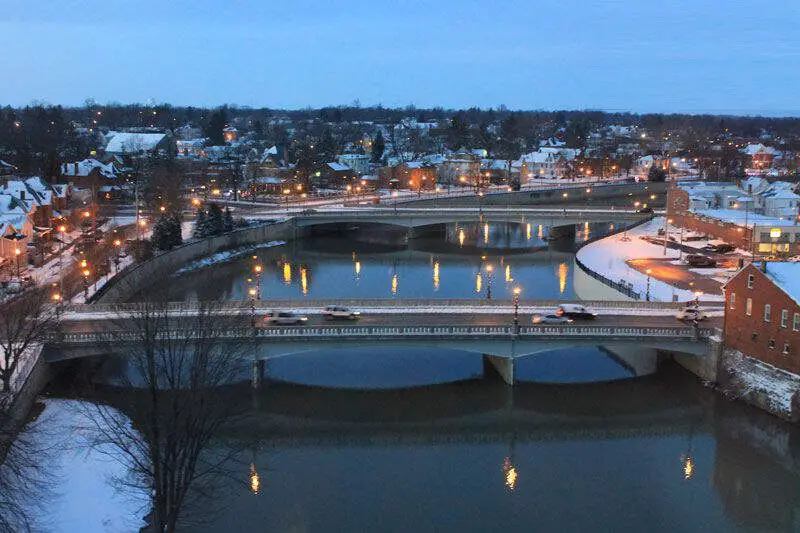
More on Painesville: Data | Cost Of Living | Movers

/10
Population: 17,818
# Of Native American Residents: 56
% Native American: 0.31%
More on Tiffin: Data | Crime | Cost Of Living | Movers

/10
Population: 21,501
# Of Native American Residents: 65
% Native American: 0.3%
More on Lebanon: Data | Crime | Cost Of Living | Movers
Methodology: How We Determined The Cities In Ohio With The Largest Native American Population For 2026
We still believe in the accuracy of data — especially from the Census. So that’s where we went to get the race breakdown across Ohio.
We used Saturday Night Science to analyze the Census’s most recently available data, the 2020-2024 American Community Survey data.
Specifically, we looked at table B03002: Hispanic OR LATINO ORIGIN BY RACE. Here are the category names as defined by the Census:
- Hispanic or Latino
- White alone*
- Black or African American alone*
- American Indian and Alaska Native alone*
- Asian alone*
- Native Hawaiian and Other Pacific Islander alone*
- Some other race alone*
- Two or more races*
Our particular column of interest here was the number of people identifying as American Indian and Alaska Native alone.
We limited our analysis to places with a population greater than 5,000 people. That left us with 243 cities.
We then calculated the percentage of residents that are American Indian and Alaska Native. The percentages ranked from 0.71 to 0.00.
Finally, we ranked each city based on the percentage of the American Indian and Alaska Native population, with a higher score being more American Indian and Alaska Native than a lower score. Deer Park took the distinction of being the most American Indian and Alaska Native, while Broadview Heights was the least Native American city.
We updated this article for 2026. This article is our eleventh time ranking the cities in Ohio with the largest Native American population.
Summary: Native American Populations Across Ohio
If you’re looking for a breakdown of Native American populations across Ohio according to the most recent data, this is an accurate list.
The most Native American cities in Ohio are Deer Park, Ravenna, Parma Heights, The Village of Indian Hill, Hillsboro, Lima, Van Wert, Painesville, Tiffin, and Lebanon.
If you’re curious enough, here are the least Native American places in Ohio:
- Broadview Heights
- Mount Healthy
- Munroe Falls
For more Ohio reading, check out:
Most Native American Places In Ohio
| Rank | City | Population | Native American Population | % Native American |
|---|---|---|---|---|
| 1 | Deer Park | 5,384 | 38 | 0.71% |
| 2 | Ravenna | 11,274 | 58 | 0.51% |
| 3 | Parma Heights | 20,581 | 105 | 0.51% |
| 4 | The Village Of Indian Hill | 6,052 | 30 | 0.5% |
| 5 | Hillsboro | 6,527 | 30 | 0.46% |
| 6 | Lima | 35,010 | 153 | 0.44% |
| 7 | Van Wert | 10,790 | 44 | 0.41% |
| 8 | Painesville | 20,548 | 80 | 0.39% |
| 9 | Tiffin | 17,818 | 56 | 0.31% |
| 10 | Lebanon | 21,501 | 65 | 0.3% |
| 11 | Grafton | 5,657 | 17 | 0.3% |
| 12 | London | 10,484 | 30 | 0.29% |
| 13 | New Philadelphia | 17,520 | 47 | 0.27% |
| 14 | Bellefontaine | 13,807 | 37 | 0.27% |
| 15 | Fostoria | 12,344 | 33 | 0.27% |
| 16 | Montgomery | 10,855 | 29 | 0.27% |
| 17 | Willard | 6,164 | 15 | 0.24% |
| 18 | Macedonia | 12,152 | 28 | 0.23% |
| 19 | Napoleon | 8,802 | 20 | 0.23% |
| 20 | Richmond Heights | 10,626 | 24 | 0.23% |
| 21 | Brook Park | 18,284 | 41 | 0.22% |
| 22 | Xenia | 25,689 | 56 | 0.22% |
| 23 | Coshocton | 11,068 | 24 | 0.22% |
| 24 | Mayfield Heights | 20,022 | 43 | 0.21% |
| 25 | Franklin | 11,712 | 24 | 0.2% |
| 26 | Conneaut | 12,357 | 25 | 0.2% |
| 27 | Cortland | 7,080 | 14 | 0.2% |
| 28 | Bowling Green | 29,983 | 59 | 0.2% |
| 29 | Marysville | 27,518 | 54 | 0.2% |
| 30 | Massillon | 32,338 | 60 | 0.19% |
| 31 | Perrysburg | 25,181 | 45 | 0.18% |
| 32 | Jackson | 6,231 | 10 | 0.16% |
| 33 | Miamisburg | 19,948 | 32 | 0.16% |
| 34 | Willoughby Hills | 9,975 | 16 | 0.16% |
| 35 | Medina | 25,950 | 41 | 0.16% |
| 36 | Clyde | 6,331 | 10 | 0.16% |
| 37 | North College Hill | 9,555 | 15 | 0.16% |
| 38 | Oxford | 21,753 | 34 | 0.16% |
| 39 | Oberlin | 8,329 | 13 | 0.16% |
| 40 | Portsmouth | 17,728 | 27 | 0.15% |
| 41 | Youngstown | 59,331 | 88 | 0.15% |
| 42 | Reading | 10,502 | 15 | 0.14% |
| 43 | Mansfield | 47,663 | 67 | 0.14% |
| 44 | North Royalton | 30,972 | 43 | 0.14% |
| 45 | Kent | 27,116 | 36 | 0.13% |
| 46 | Canfield | 7,649 | 10 | 0.13% |
| 47 | Defiance | 17,276 | 22 | 0.13% |
| 48 | Wilmington | 12,620 | 16 | 0.13% |
| 49 | Sheffield Lake | 8,966 | 11 | 0.12% |
| 50 | Cincinnati | 311,224 | 373 | 0.12% |
| 51 | Rittman | 6,044 | 7 | 0.12% |
| 52 | Girard | 9,505 | 11 | 0.12% |
| 53 | Lorain | 65,395 | 75 | 0.11% |
| 54 | Salem | 11,758 | 13 | 0.11% |
| 55 | Zanesville | 24,740 | 27 | 0.11% |
| 56 | Avon Lake | 25,752 | 28 | 0.11% |
| 57 | Bryan | 8,631 | 9 | 0.1% |
| 58 | Sandusky | 24,606 | 25 | 0.1% |
| 59 | Chillicothe | 21,902 | 21 | 0.1% |
| 60 | Dayton | 136,579 | 130 | 0.1% |
| 61 | Sylvania | 19,055 | 18 | 0.09% |
| 62 | Elyria | 53,035 | 50 | 0.09% |
| 63 | Bexley | 13,114 | 12 | 0.09% |
| 64 | Norton | 11,524 | 10 | 0.09% |
| 65 | Euclid | 48,823 | 42 | 0.09% |
| 66 | Middletown | 51,617 | 44 | 0.09% |
| 67 | Solon | 23,943 | 20 | 0.08% |
| 68 | Twinsburg | 19,410 | 16 | 0.08% |
| 69 | Lancaster | 41,249 | 34 | 0.08% |
| 70 | Fairview Park | 17,018 | 14 | 0.08% |
| 71 | East Cleveland | 13,534 | 11 | 0.08% |
| 72 | Vermilion | 10,343 | 8 | 0.08% |
| 73 | Middleburg Heights | 15,786 | 12 | 0.08% |
| 74 | Canal Fulton | 5,337 | 4 | 0.07% |
| 75 | Akron | 189,247 | 140 | 0.07% |
| 76 | Cleveland | 366,097 | 268 | 0.07% |
| 77 | Pepper Pike | 6,840 | 5 | 0.07% |
| 78 | Warren | 38,912 | 27 | 0.07% |
| 79 | Cheviot | 8,660 | 6 | 0.07% |
| 80 | Powell | 14,451 | 10 | 0.07% |
| 81 | Bucyrus | 11,594 | 8 | 0.07% |
| 82 | Columbus | 914,802 | 625 | 0.07% |
| 83 | Steubenville | 18,124 | 12 | 0.07% |
| 84 | Maple Heights | 23,258 | 15 | 0.06% |
| 85 | Rossford | 6,323 | 4 | 0.06% |
| 86 | Lyndhurst | 13,801 | 8 | 0.06% |
| 87 | Willowick | 14,162 | 8 | 0.06% |
| 88 | Rocky River | 21,490 | 12 | 0.06% |
| 89 | Shaker Heights | 28,922 | 16 | 0.06% |
| 90 | Niles | 18,287 | 10 | 0.05% |
| 91 | Cleveland Heights | 44,497 | 24 | 0.05% |
| 92 | Brunswick | 35,246 | 19 | 0.05% |
| 93 | Sidney | 20,501 | 11 | 0.05% |
| 94 | Harrison | 13,084 | 7 | 0.05% |
| 95 | Clayton | 13,277 | 7 | 0.05% |
| 96 | North Ridgeville | 36,627 | 19 | 0.05% |
| 97 | Athens | 23,396 | 12 | 0.05% |
| 98 | Marion | 35,669 | 18 | 0.05% |
| 99 | Berea | 18,218 | 9 | 0.05% |
| 100 | Amherst | 12,906 | 6 | 0.05% |


