Most Native American places in Pennsylvania research summary. We used Saturday Night Science to research the Pennsylvania cities with the highest percentage of Native American residents for 2026. The data comes from the American Community Survey 2020-2024 vintage, which breaks down race by origin.
The city with the highest percentage of Native Americans is McKees Rocks. 1.12% of people in McKees Rocks are Native Americans.
The city with the lowest percentage of Native Americans is York. 0.00% of people in York are Native American.
The city with the most Native Americans is Philadelphia. 1,837 people in Philadelphia are Native American.
The city with the fewest Native Americans is York. 0 people in York are Native American.
The United States has 1,698,432 Native Americans and is 0.51% Native American.
Which city in Pennsylvania had the largest Native American population? The place with the largest Native American population in Pennsylvania for 2026 is McKees Rocks. 1.12% of McKees Rocks identify as Native American.
1.1% Native American · 65 Native American residents
Data | Crime | Cost of living | Movers
0.3% Native American · 41 Native American residents
Data | Crime | Cost of living | Movers
0.3% Native American · 42 Native American residents
Data | Crime | Cost of living | Movers
0.3% Native American · 18 Native American residents
Blakely is a borough in Lackawanna County, Pennsylvania, United States. The population was 6,564 at the 2010 census.
Data | Crime | Cost of living | Movers
0.3% Native American · 41 Native American residents
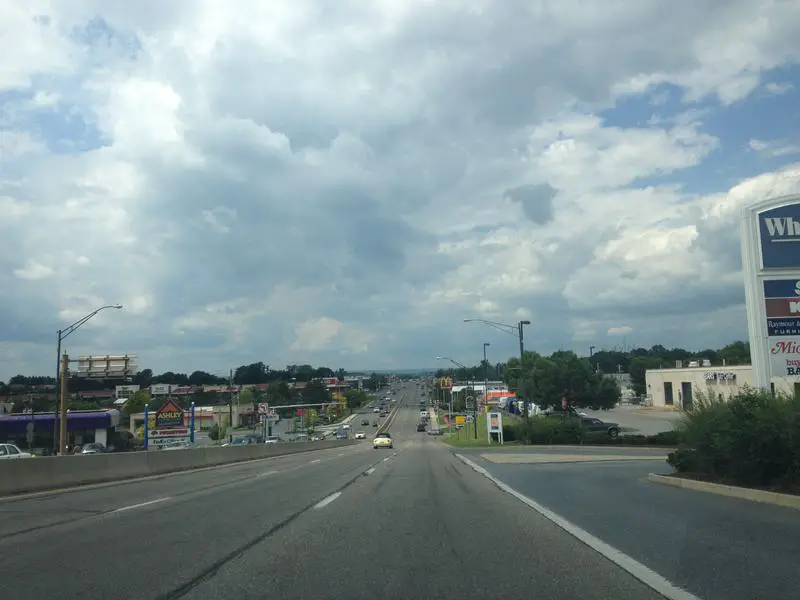
Hermitage is a city in Mercer County, Pennsylvania, United States. The population was 16,220 at the 2010 census. It is part of the Youngstown-Warren-Boardman, OH-PA Metropolitan Statistical Area.
Data | Crime | Cost of living | Movers
0.2% Native American · 23 Native American residents
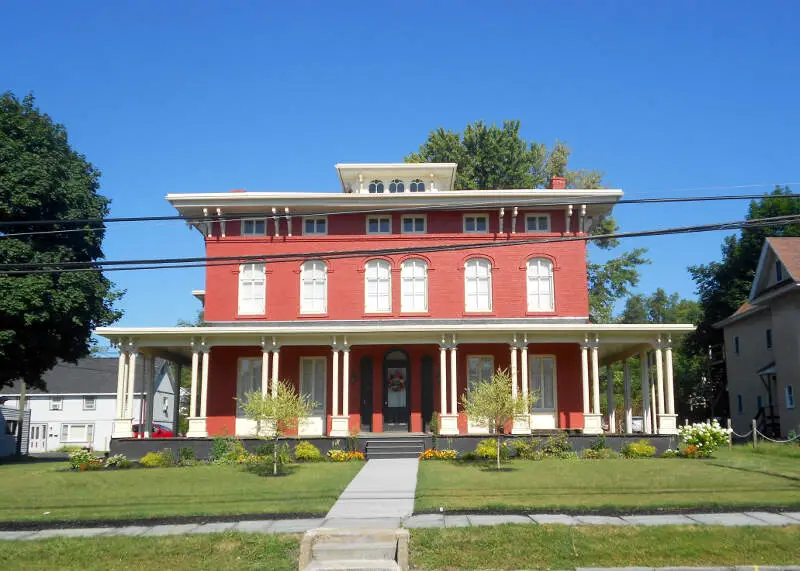
East Stroudsburg is a borough in Monroe County, Pennsylvania, United States. It is located in the Poconos region of the state. Originally known as “Dansbury,” East Stroudsburg was renamed for geographic reasons when the Delaware, Lackawanna, and Western Railroad opened a station in town. It lies east of Stroudsburg and is somewhat more populous than that town. East Stroudsburg is the largest municipality in the East Stroudsburg, PA Metropolitan Statistical Area as designated by the Office of Management and Budget based on data from the 2010 US Census.
Data | Crime | Cost of living | Movers
0.2% Native American · 22 Native American residents
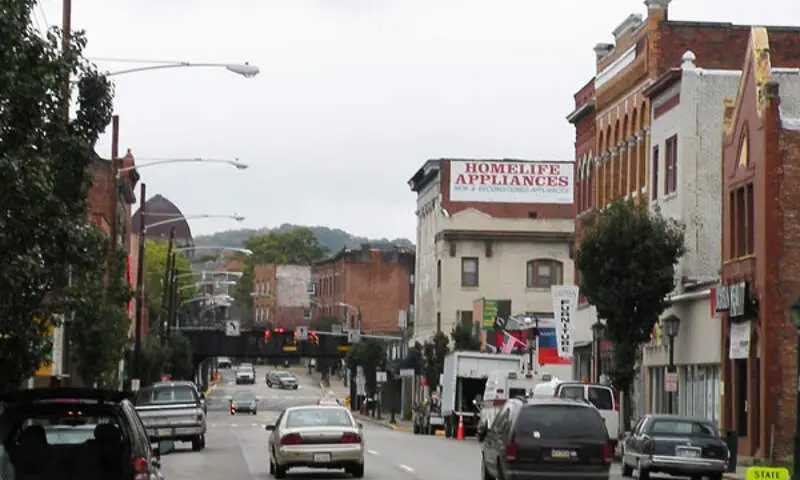
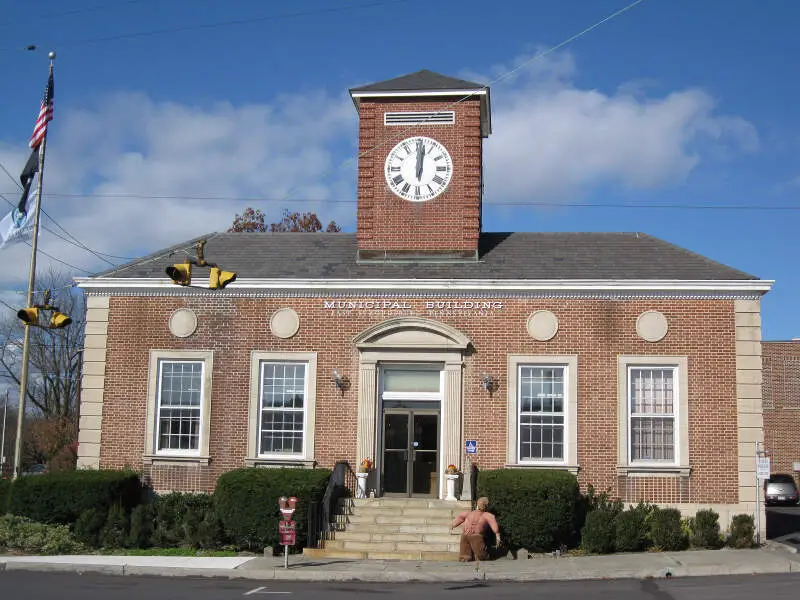
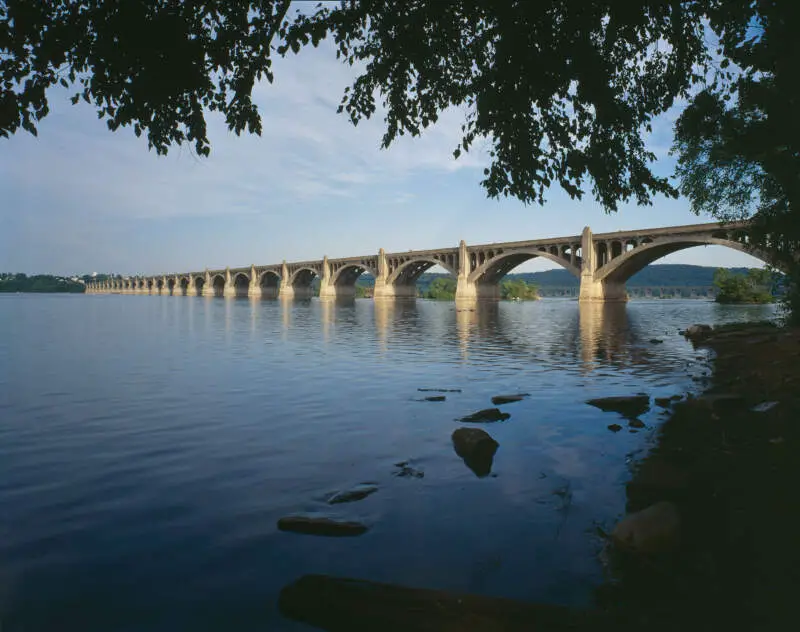
Columbia, formerly Wright’s Ferry, is a borough in Lancaster County, Pennsylvania, 28 miles southeast of Harrisburg on the east bank of the Susquehanna River, across from Wrightsville and York County and just south of U.S. Route 30. The settlement was founded in 1726 by Colonial English Quakers from Chester County led by entrepreneur and evangelist John Wright. Establishment of the eponymous Wright’s Ferry, the first commercial Susquehanna crossing in the region, inflamed territorial conflict with neighboring Maryland but brought growth and prosperity to the small town, which was just a few votes shy of becoming the new United States’ capital. Though besieged for a short while by Civil War destruction, Columbia remained a lively center of transport and industry throughout the 19th century, once serving as a terminus of the Pennsylvania Canal. Later, however, the Great Depression and 20th-century changes in economy and technology sent the borough into decline. It is notable today as the site of one of the world’s few museums devoted entirely to horology.
Data | Crime | Cost of living | Movers
0.2% Native American · 32 Native American residents
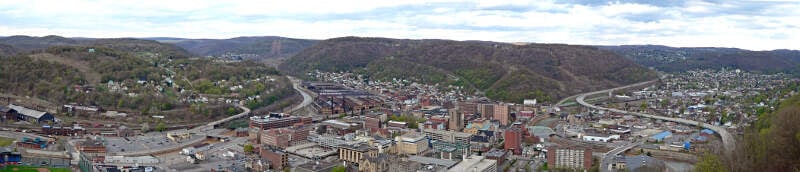
Johnstown is a city in Cambria County, Pennsylvania, United States, 43 miles west-southwest of Altoona and 67 miles east of Pittsburgh. The population was 20,978 at the 2010 census and estimated to be 20,402 in 2013. It is the principal city of the Johnstown, Pennsylvania, Metropolitan Statistical Area, which includes Cambria County.
Data | Crime | Cost of living | Movers
0.2% Native American · 44 Native American residents
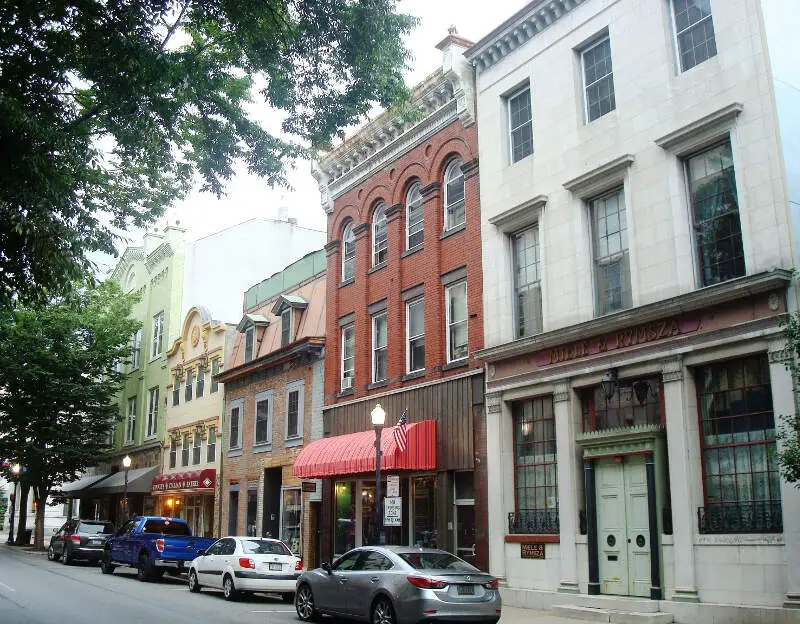
Williamsport is a city in and the county seat of Lycoming County, Pennsylvania, United States. In 2009, the population was estimated at 29,304. It is the principal city of the Williamsport, Pennsylvania Metropolitan Statistical Area, which has a population of about 117,000.
Data | Crime | Cost of living | Movers
0.1% Native American · 10 Native American residents
Data | Crime | Cost of living | Movers
The receipts
Compare the top ten
Pick a metric. The bars rescale. The red line is Pennsylvania’s statewide median.
On the map
Where Pennsylvania’s Native American population is concentrated
Saturday Night Science
Methodology: How We Determined The Cities In Pennsylvania With The Largest Native American Population For 2026
We still believe in the accuracy of data — especially from the Census. So that’s where we went to get the race breakdown across Pennsylvania.
We used Saturday Night Science to analyze the Census’s most recently available data, the 2020-2024 American Community Survey data.
Specifically, we looked at table B03002: Hispanic OR LATINO ORIGIN BY RACE. Here are the category names as defined by the Census:
- Hispanic or Latino
- White alone
- Black or African American alone
- American Indian and Alaska Native alone
- Asian alone
- Native Hawaiian and Other Pacific Islander alone
- Some other race alone
- Two or more races
Our particular column of interest here was the number of people identifying as American Indian and Alaska Native alone.
We limited our analysis to places with a population greater than 5,000 people. That left us with 184 cities.
We then calculated the percentage of residents that are American Indian and Alaska Native. The percentages ranked from 1.12 to 0.00.
Finally, we ranked each city based on the percentage of the American Indian and Alaska Native population, with a higher score being more American Indian and Alaska Native than a lower score. McKees Rocks took the distinction of being the most American Indian and Alaska Native, while York was the least Native American city.
We updated this article for 2026. This article is our eleventh time ranking the cities in Pennsylvania with the largest Native American population.
The full plate
Most Native American Places In Pennsylvania
Click any column to sort. Search by city name.
| Rank | City | Population | Native American Population | % Native American |
|---|---|---|---|---|
| 1 | McKees Rocks | 5,786 | 65 | 1.1% |
| 2 | Elizabet | 11,925 | 41 | 0.3% |
| 3 | Whitehall | 14,811 | 42 | 0.3% |
| 4 | Blakely | 6,662 | 18 | 0.3% |
| 5 | Hermitage | 16,041 | 41 | 0.3% |
| 6 | East Stroudsburg | 9,319 | 23 | 0.2% |
| 7 | Columbia | 10,278 | 22 | 0.2% |
| 8 | Johnstown | 18,087 | 32 | 0.2% |
| 9 | Williamsport | 27,612 | 44 | 0.2% |
| 10 | Oakmont | 6,702 | 10 | 0.1% |
| 11 | Millersville | 8,982 | 13 | 0.1% |
| 12 | Hollidaysburg | 5,558 | 8 | 0.1% |
| 13 | Lock Haven | 8,447 | 12 | 0.1% |
| 14 | Red Lion | 6,516 | 9 | 0.1% |
| 15 | Pleasant Hills | 8,399 | 11 | 0.1% |
| 16 | Oil City | 9,468 | 12 | 0.1% |
| 17 | Prospect Park | 6,417 | 8 | 0.1% |
| 18 | Erie | 93,850 | 111 | 0.1% |
| 19 | Birdsboro | 5,116 | 6 | 0.1% |
| 20 | Philadelphia | 1,579,706 | 1,837 | 0.1% |
| 21 | Harrisburg | 50,287 | 58 | 0.1% |
| 22 | Ephrata | 13,772 | 15 | 0.1% |
| 23 | Collingdale | 8,897 | 9 | 0.1% |
| 24 | Kennett Square | 6,243 | 6 | 0.1% |
| 25 | Lewisburg | 5,257 | 5 | 0.1% |
| 26 | McKeesport | 17,380 | 16 | 0.1% |
| 27 | Berwick | 10,317 | 9 | 0.1% |
| 28 | Dormont | 8,063 | 7 | 0.1% |
| 29 | Stroudsburg | 5,894 | 5 | 0.1% |
| 30 | State College | 41,050 | 32 | 0.1% |
| 31 | Monessen | 6,780 | 5 | 0.1% |
| 32 | Exeter | 5,541 | 4 | 0.1% |
| 33 | Wilkinsburg | 14,027 | 10 | 0.1% |
| 34 | Pittsburgh | 304,759 | 207 | 0.1% |
| 35 | Scranton | 76,033 | 50 | 0.1% |
| 36 | Perkasie | 9,216 | 5 | 0.1% |
| 37 | Archbald | 7,404 | 4 | 0.1% |
| 38 | Pittston | 7,626 | 4 | 0.1% |
| 39 | Grove City | 7,830 | 4 | 0.1% |
| 40 | Norri | 35,893 | 17 | 0.0% |
| 41 | Bloomsburg | 13,024 | 6 | 0.0% |
| 42 | Lebanon | 26,536 | 12 | 0.0% |
| 43 | Connellsville | 6,849 | 3 | 0.0% |
| 44 | West Chester | 20,666 | 9 | 0.0% |
| 45 | Tamaqua | 6,924 | 3 | 0.0% |
| 46 | Conshohocken | 9,282 | 4 | 0.0% |
| 47 | Uniontown | 9,742 | 4 | 0.0% |
| 48 | Altoona | 43,196 | 16 | 0.0% |
| 49 | Lower Burrell | 11,633 | 4 | 0.0% |
| 50 | Beaver Falls | 8,850 | 3 | 0.0% |
| 51 | Moosic | 5,973 | 2 | 0.0% |
| 52 | Baldwin | 21,057 | 7 | 0.0% |
| 53 | Dickson City | 6,023 | 2 | 0.0% |
| 54 | Phoenixville | 19,452 | 6 | 0.0% |
| 55 | Bethlehem | 77,956 | 24 | 0.0% |
| 56 | Pottsville | 13,364 | 4 | 0.0% |
| 57 | New Castle | 21,579 | 6 | 0.0% |
| 58 | Easton | 29,739 | 8 | 0.0% |
| 59 | Wyomissing | 11,172 | 3 | 0.0% |
| 60 | West Mifflin | 19,190 | 5 | 0.0% |
| 61 | Lancaster | 57,719 | 15 | 0.0% |
| 62 | Meadville | 12,577 | 3 | 0.0% |
| 63 | Sharon | 12,936 | 3 | 0.0% |
| 64 | Wilkes-Barre | 44,423 | 10 | 0.0% |
| 65 | Dunmore | 14,181 | 3 | 0.0% |
| 66 | Allentown | 125,976 | 25 | 0.0% |
| 67 | Reading | 95,242 | 15 | 0.0% |
| 68 | Plum | 26,723 | 4 | 0.0% |
| 69 | Carnegie | 7,978 | 1 | 0.0% |
| 70 | Swissvale | 8,418 | 1 | 0.0% |
| 71 | Warren | 9,240 | 1 | 0.0% |
| 72 | Sunbury | 9,617 | 1 | 0.0% |
| 73 | Mechanicsburg | 9,720 | 1 | 0.0% |
| 74 | New Kensington | 12,011 | 1 | 0.0% |
| 75 | Lansdale | 19,011 | 1 | 0.0% |
| 76 | Hazleton | 30,111 | 1 | 0.0% |
| 77 | Chester | 33,619 | 1 | 0.0% |
| 131 | Nanticoke | 10,653 | 0 | 0.0% |
| 131 | Nazareth | 6,043 | 0 | 0.0% |
| 131 | Jefferson Hills | 12,317 | 0 | 0.0% |
| 131 | Ellwood City | 7,532 | 0 | 0.0% |
| 131 | Edinboro | 5,440 | 0 | 0.0% |
| 131 | Economy | 9,005 | 0 | 0.0% |
| 131 | Ambler | 6,847 | 0 | 0.0% |
| 131 | Ambridge | 6,890 | 0 | 0.0% |
| 131 | Bangor | 5,163 | 0 | 0.0% |
| 131 | Bellefonte | 6,009 | 0 | 0.0% |
| 131 | Bellevue | 8,128 | 0 | 0.0% |
| 131 | Camp Hill | 8,169 | 0 | 0.0% |
| 131 | Brentwood | 9,866 | 0 | 0.0% |
| 131 | Bristol | 9,902 | 0 | 0.0% |
| 131 | Brookhaven | 8,331 | 0 | 0.0% |
| 131 | Butler | 13,212 | 0 | 0.0% |
| 131 | Munhall | 10,548 | 0 | 0.0% |
| 131 | Canonsburg | 9,675 | 0 | 0.0% |
| 131 | Carbondale | 8,789 | 0 | 0.0% |
| 131 | Carlisle | 21,852 | 0 | 0.0% |
| 131 | Castle Shannon | 8,209 | 0 | 0.0% |
| 131 | Catasauqua | 6,541 | 0 | 0.0% |
| 131 | Chambersburg | 22,319 | 0 | 0.0% |
Source: U.S. Census ACS 2020-2024, table B03002. 184 Pennsylvania cities with more than 5,000 residents.
Summary
Summary: Native American Populations Across Pennsylvania
If you’re looking for a breakdown of Native American populations across Pennsylvania according to the most recent data, this is an accurate list.
The most Native American cities in Pennsylvania are McKees Rocks, Elizabet, Whitehall, Blakely, Hermitage, East Stroudsburg, Columbia, Johnstown, Williamsport, and Oakmont.


