Whitest cities in Indiana research summary. We analyzed Indiana’s most recent Census data to determine the whitest cities in Indiana based on the percentage of White residents.
95.7% White · #1 whitest in Indiana
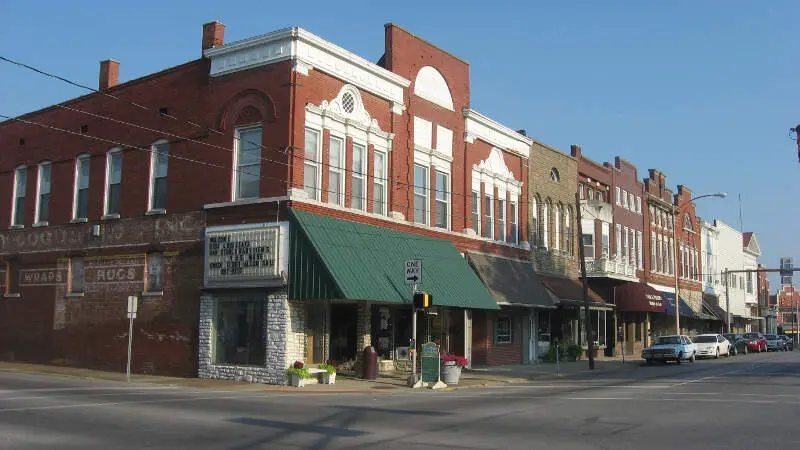
Boonville is a city in Boon Township, Warrick County, Indiana, United States. The population was 6,246 at the 2010 census. The city is the county seat of Warrick County.
Data | Crime | Cost of living | Movers
95.2% White · #2 whitest in Indiana
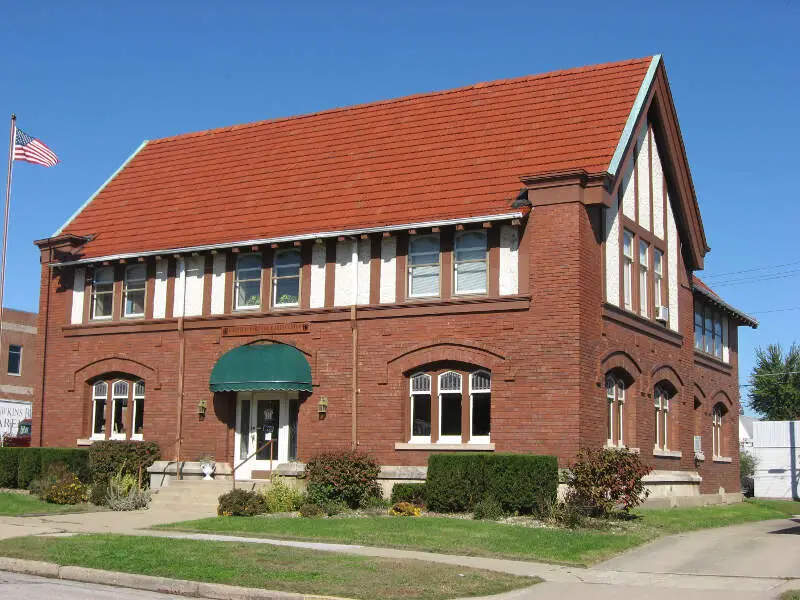
Linton is a city in Stockton Township, Greene County, Indiana, United States. The population was 5,413 at the 2010 census. A coal mining city, it is located southeast of Terre Haute. The current mayor is Scott Anthony Smithhart.
Data | Crime | Cost of living | Movers
95.1% White · #3 whitest in Indiana
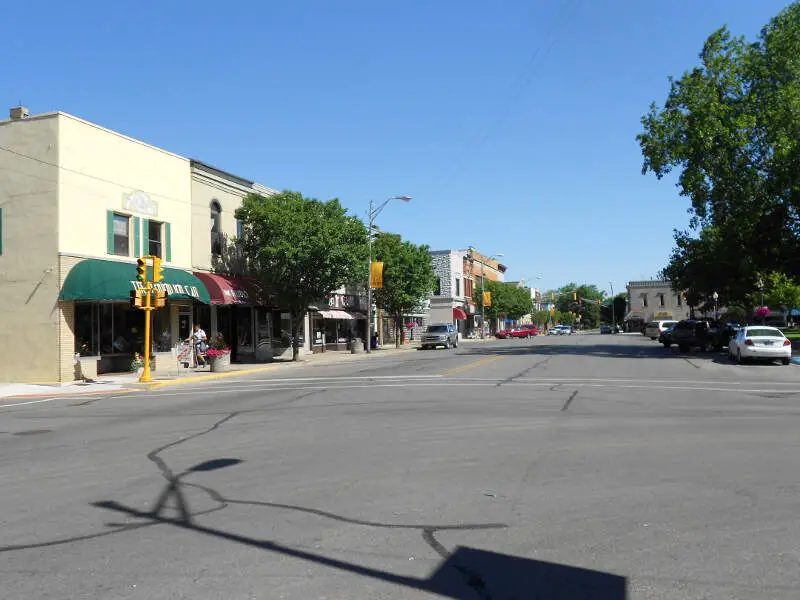
Auburn is a city in DeKalb County, Indiana, United States. The population was 13,086 at the 2010 census. Founded in 1836 by Wesley Park, the city is the county seat of DeKalb County. Auburn is also known as Home of the Classics.
Data | Crime | Cost of living | Movers
95.1% White · #4 whitest in Indiana
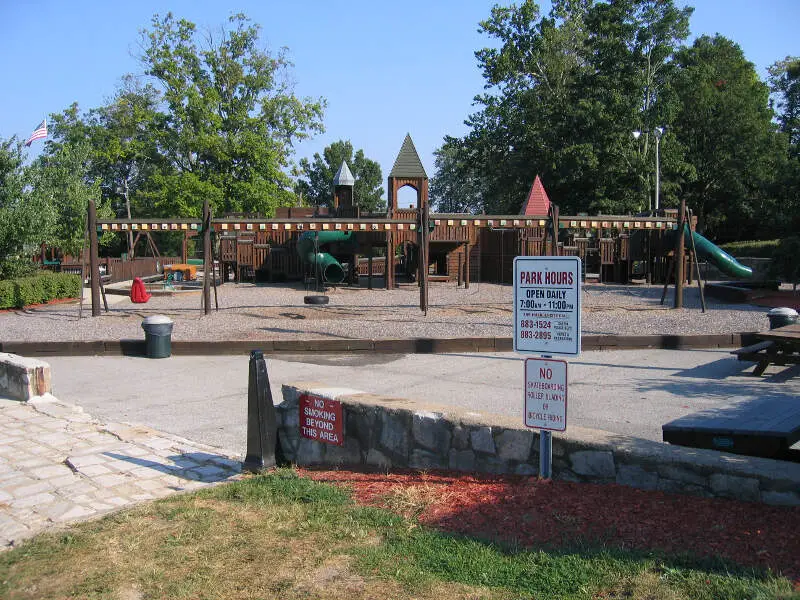
Salem is a city in Washington Township, Washington County, in the U.S. state of Indiana. Salem serves as the county seat. The population was 6,319 at the 2010 census.
Data | Crime | Cost of living | Movers
94.7% White · #5 whitest in Indiana
Martinsville is a city in Washington Township, Morgan County, in the U.S. state of Indiana. The population was 11,828 at the 2010 United States Census. The city is the county seat of Morgan County.
Data | Crime | Cost of living | Movers
93.6% White · #6 whitest in Indiana
Danville is a town in Center Township, Hendricks County, Indiana, United States. The population was 9,001 at the 2010 census, up from 6,418 at the 2000 census. By 2016 the estimated population was 9,676. The town is the county seat of Hendricks County.
Data | Crime | Cost of living | Movers
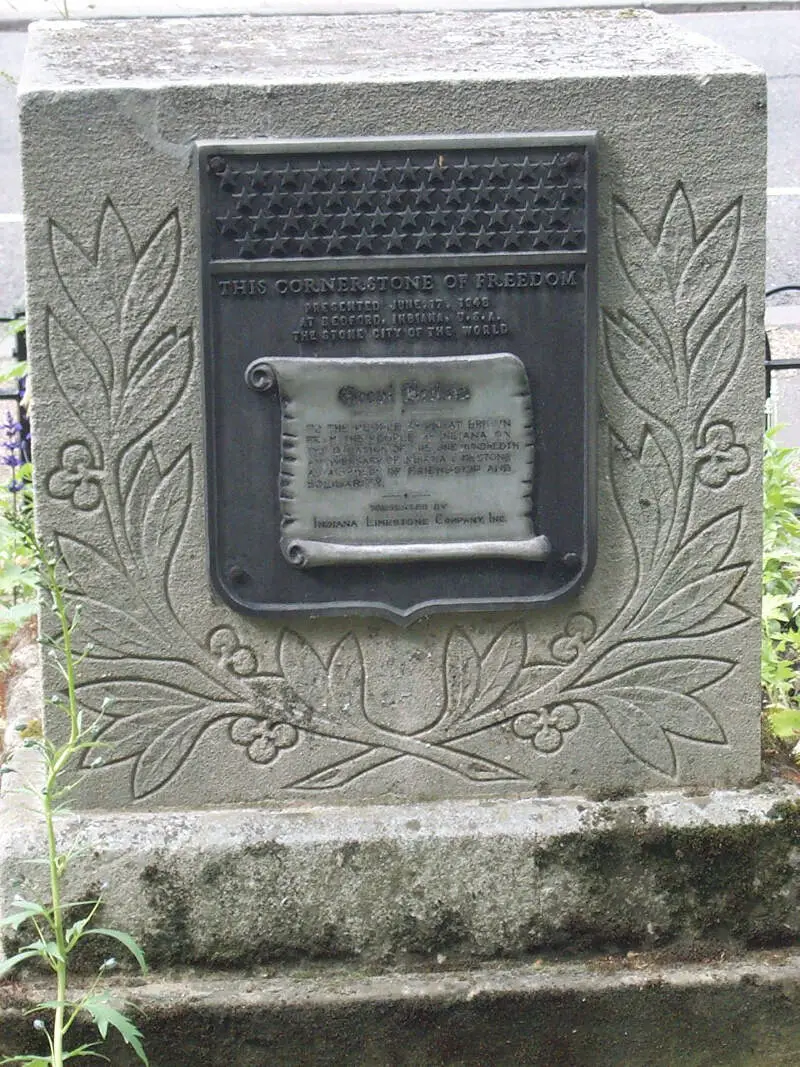
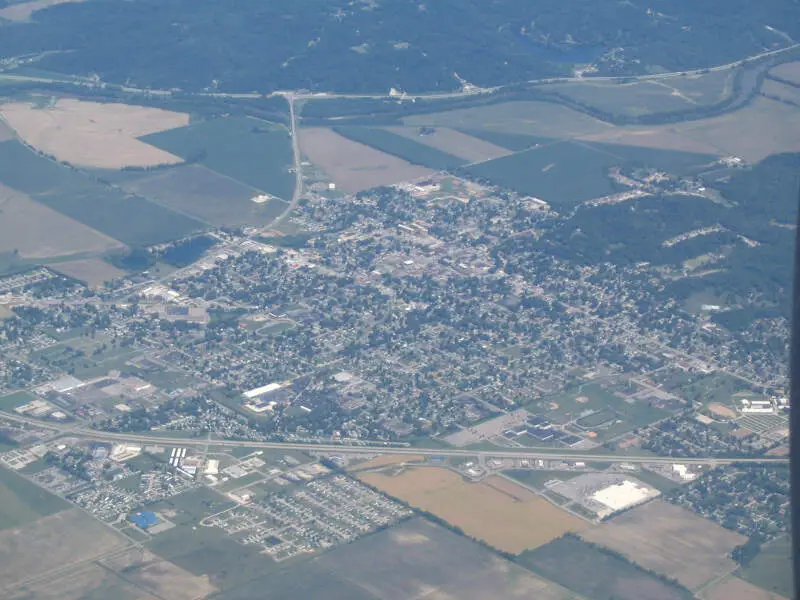
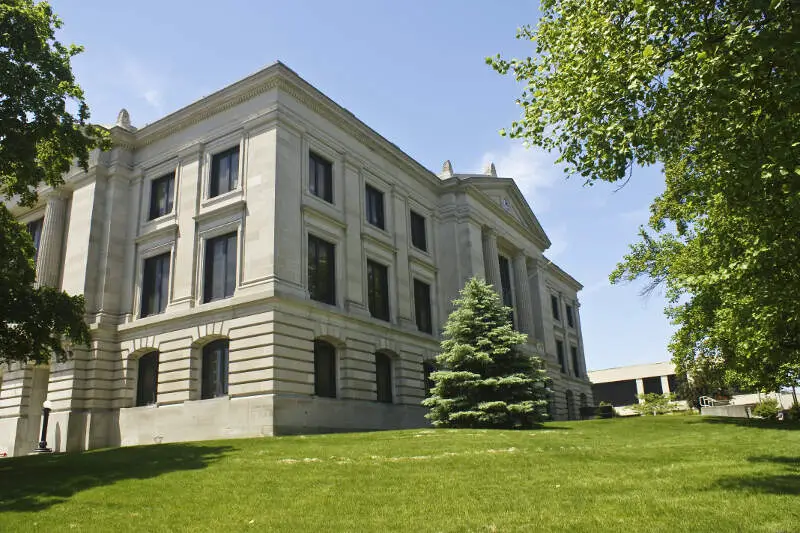
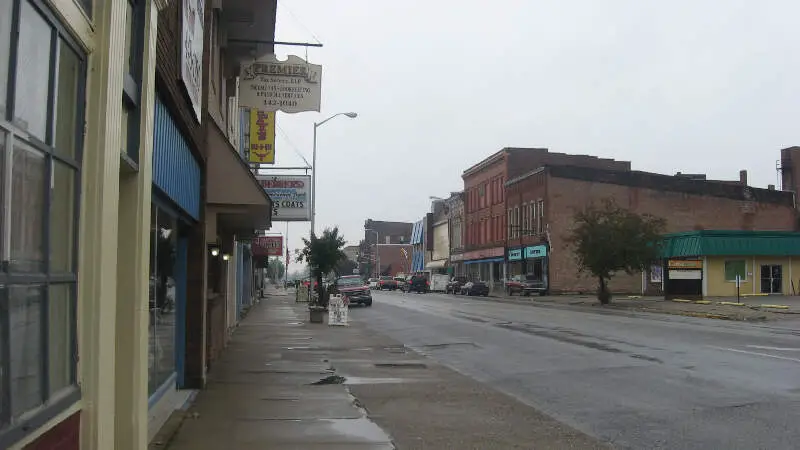
93.5% White · #7 whitest in Indiana
Data | Crime | Cost of living | Movers
93.3% White · #8 whitest in Indiana
Brazil is a city in Clay County, Indiana, United States. The population was 7,912 at the 2010 census. The city is the county seat of Clay County. It is part of the Terre Haute Metropolitan Statistical Area. The current chief executive of Brazil is Mayor Brian Wyndham.
Data | Crime | Cost of living | Movers
92.8% White · #9 whitest in Indiana
Hartford City is a city in the U.S. state of Indiana, and the county seat of Blackford County. Located in the northeast central portion of the state, the small farming community experienced a 15-year boom beginning in the late 1880s. The Indiana Gas Boom was caused by the discovery of natural gas in the area, and it caused the community to transition from an agricultural economy to one that also included manufacturing. The boom brought residents, retail establishments, and craftspeople. The increased population meant construction of new roads, schools, and churches. After the boom came a long period of growth and stability. Agriculture remained as the fundamental industry.
Data | Crime | Cost of living | Movers
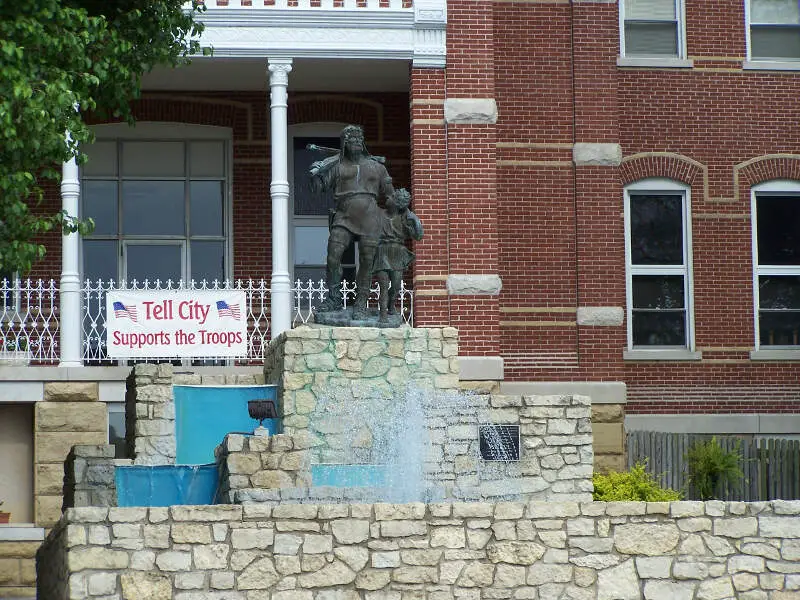
92.8% White · #10 whitest in Indiana
Tell City is a city in Troy Township, Perry County, in the U.S. state of Indiana, along the Ohio River. The population was 7,272 at the 2010 census. The city is the county seat of Perry County.
Data | Crime | Cost of living | Movers
The receipts
Compare the top ten
Pick a metric. The bars rescale. The red line is Indiana’s statewide median.
On the map
Where Indiana’s White population is concentrated
Saturday Night Science
Methodology: How we determined the whitest places in Indiana for 2026
To rank the whitest places in Indiana, we used Saturday Night Science to look at Census demographic data.
We had to look at the number of white people living in each city in Indiana on a per capita basis. In other words, the percentage of white people living in each city in Indiana.
We looked at table B03002: Hispanic OR LATINO ORIGIN BY RACE. Here are the category names as defined by the Census:
- Hispanic or Latino
- White alone*
- Black or African American alone*
- American Indian and Alaska Native alone*
- Asian alone*
- Native Hawaiian and Other Pacific Islander alone*
- Some other race alone*
- Two or more races*
Our particular column of interest here was the number of people who identified as White alone.
We limited our analysis to places with a population greater than 5,000 people. That left us with 112 cities.
We then calculated the percentage of residents that are White. The percentages ranked from 95.7% to 6.1%.
Finally, we ranked each city based on the percentage of the White population, with a higher percentage being more White. Boonville took the distinction of being the most White, while East Chicago was the least White city.
We updated this article for 2026. This report represents our eleventh time ranking the whitest cities in Indiana.
The full plate
Cities In Indiana By White Population
Click any column to sort. Search by city name.
| Rank | City | Population | White Population | % White |
|---|---|---|---|---|
| 1 | Boonville | 6,702 | 6,417 | 95.7% |
| 2 | Linton | 5,260 | 5,010 | 95.2% |
| 3 | Auburn | 13,565 | 12,904 | 95.1% |
| 4 | Salem | 6,489 | 6,171 | 95.1% |
| 5 | Martinsville | 11,933 | 11,298 | 94.7% |
| 6 | Danville | 11,714 | 10,962 | 93.6% |
| 7 | Bedford | 13,837 | 12,941 | 93.5% |
| 8 | Brazil | 7,831 | 7,306 | 93.3% |
| 9 | Hartford City | 5,794 | 5,379 | 92.8% |
| 10 | Tell City | 7,505 | 6,962 | 92.8% |
| 11 | Ellettsville | 6,698 | 6,207 | 92.7% |
| 12 | Batesville | 7,282 | 6,734 | 92.5% |
| 13 | Connersville | 13,109 | 12,099 | 92.3% |
| 14 | Elwood | 8,356 | 7,635 | 91.4% |
| 15 | Mooresville | 9,751 | 8,876 | 91.0% |
| 16 | Garrett | 6,642 | 6,039 | 90.9% |
| 17 | Mount Vernon | 6,400 | 5,799 | 90.6% |
| 18 | Monticello | 5,496 | 4,979 | 90.6% |
| 19 | Huntington | 17,030 | 15,396 | 90.4% |
| 20 | Alexandria | 5,155 | 4,659 | 90.4% |
| 21 | Wabash | 10,358 | 9,361 | 90.4% |
| 22 | Sellersburg | 10,137 | 9,149 | 90.3% |
| 23 | Rushville | 6,036 | 5,440 | 90.1% |
| 24 | Franklin | 26,168 | 23,552 | 90.0% |
| 25 | Tipton | 5,280 | 4,747 | 89.9% |
| 26 | Greensburg | 12,229 | 10,991 | 89.9% |
| 27 | Madison | 12,223 | 10,956 | 89.6% |
| 28 | Yor | 11,699 | 10,483 | 89.6% |
| 29 | Greenfield | 24,940 | 22,346 | 89.6% |
| 30 | New Castle | 17,367 | 15,498 | 89.2% |
| 31 | Bluffton | 10,529 | 9,367 | 89.0% |
| 32 | Gas City | 6,076 | 5,404 | 88.9% |
| 33 | North Vernon | 7,078 | 6,253 | 88.3% |
| 34 | Columbia City | 9,897 | 8,734 | 88.2% |
| 35 | Lebanon | 17,812 | 15,671 | 88.0% |
| 36 | Angola | 9,408 | 8,263 | 87.8% |
| 37 | Scottsburg | 7,362 | 6,426 | 87.3% |
| 38 | Decatur | 9,811 | 8,560 | 87.2% |
| 39 | Peru | 10,901 | 9,443 | 86.6% |
| 40 | Lowell | 11,073 | 9,565 | 86.4% |
| 41 | Chesterton | 14,446 | 12,447 | 86.2% |
| 42 | Kendallville | 10,556 | 9,075 | 86.0% |
| 43 | Portland | 6,416 | 5,511 | 85.9% |
| 44 | Cedar Lake | 15,295 | 13,098 | 85.6% |
| 45 | Zionsville | 32,095 | 27,331 | 85.2% |
| 46 | New Whiteland | 5,704 | 4,849 | 85.0% |
| 47 | Vincennes | 16,586 | 14,095 | 85.0% |
| 48 | Jasper | 15,991 | 13,578 | 84.9% |
| 49 | Greencastle | 9,864 | 8,273 | 83.9% |
| 50 | Crawfordsville | 16,491 | 13,817 | 83.8% |
| 51 | New Haven | 15,698 | 13,129 | 83.6% |
| 52 | Shelbyville | 20,296 | 16,923 | 83.4% |
| 53 | Beech Grove | 14,913 | 12,262 | 82.2% |
| 54 | Noblesville | 73,362 | 60,304 | 82.2% |
| 55 | Rochester | 6,215 | 5,056 | 81.4% |
| 56 | Princeton | 8,372 | 6,718 | 80.2% |
| 57 | Valparaiso | 34,733 | 27,805 | 80.1% |
| 58 | New Albany | 37,581 | 29,889 | 79.5% |
| 59 | Richmond | 35,581 | 28,031 | 78.8% |
| 60 | Kokomo | 59,122 | 46,574 | 78.8% |
| 61 | Terre Haute | 58,427 | 46,010 | 78.7% |
| 62 | St. John | 22,567 | 17,766 | 78.7% |
| 63 | Dyer | 16,400 | 12,898 | 78.6% |
| 64 | Muncie | 64,751 | 50,797 | 78.4% |
| 65 | Nappanee | 6,815 | 5,321 | 78.1% |
| 66 | Brownsburg | 31,215 | 24,153 | 77.4% |
| 67 | Rensselaer | 5,573 | 4,265 | 76.5% |
| 68 | Washington | 12,367 | 9,394 | 76.0% |
| 69 | Crown Point | 34,393 | 26,121 | 75.9% |
| 70 | Warsaw | 16,768 | 12,709 | 75.8% |
| 71 | Charlestown | 8,294 | 6,282 | 75.7% |
| 72 | Evansville | 116,116 | 87,788 | 75.6% |
| 73 | La Porte | 22,449 | 16,926 | 75.4% |
| 74 | Carmel | 101,651 | 76,606 | 75.4% |
| 75 | Bloomington | 80,049 | 59,488 | 74.3% |
| 76 | Greenwood | 66,029 | 48,929 | 74.1% |
| 77 | Mishawaka | 51,021 | 37,594 | 73.7% |
| 78 | Marion | 27,531 | 20,197 | 73.4% |
| 79 | Jeffersonville | 51,043 | 37,428 | 73.3% |
| 80 | Anderson | 55,367 | 40,125 | 72.5% |
| 81 | Columbus | 51,824 | 37,253 | 71.9% |
| 82 | Plymouth | 10,664 | 7,656 | 71.8% |
| 83 | Cumberland | 6,267 | 4,480 | 71.5% |
| 84 | Clarksville | 22,016 | 15,444 | 70.1% |
| 85 | Schererville | 29,701 | 20,805 | 70.0% |
| 86 | Plainfield | 36,369 | 25,467 | 70.0% |
| 87 | Munster | 23,733 | 16,526 | 69.6% |
| 88 | Lafayette | 71,159 | 48,890 | 68.7% |
| 89 | Avon | 23,437 | 16,032 | 68.4% |
| 90 | Westville | 5,279 | 3,494 | 66.2% |
| 91 | Highland | 23,680 | 15,553 | 65.7% |
| 92 | Seymour | 22,371 | 14,635 | 65.4% |
| 93 | Hobart | 29,558 | 19,301 | 65.3% |
| 94 | West Lafayette | 45,159 | 29,481 | 65.3% |
| 95 | Portage | 38,082 | 24,693 | 64.8% |
| 96 | Fort Wayne | 268,589 | 169,868 | 63.2% |
| 97 | Huntingburg | 6,396 | 4,027 | 63.0% |
| 98 | Frankfort | 15,917 | 9,870 | 62.0% |
| 99 | Michigan City | 31,814 | 19,407 | 61.0% |
| 100 | Lake Station | 13,185 | 7,787 | 59.1% |
Source: U.S. Census ACS 2020-2024. 112 cities with more than 5,000 residents.
Summary
Summary: White Populations Across Indiana
We measured the locations with the highest percentage of white people in Indiana. According to the most recent data, this list provides accurate information on the whitest places in Indiana.
The most White cities in Indiana are Boonville, Linton, Auburn, Salem, Martinsville, Danville, Bedford, Brazil, Hartford City, and Tell City. Not sold on Indiana? Take the two-minute Find Your Place quiz and see which state actually fits you.


