Are you looking for love in New York?
Or are you just hoping to hook up with a hot New Yorker?
Either way, we’ve got you covered here.
If you live in New York, there’s a pretty good chance there are a lot of singles in your area. The Empire State has plenty of people over 18 who aren’t married or in a serious relationship.
That’s great news for people who are single and looking to mingle.
So, where are the best cities for singles in New York? We used Saturday Night Science to find out.
23.3 median age · 9.0% married households
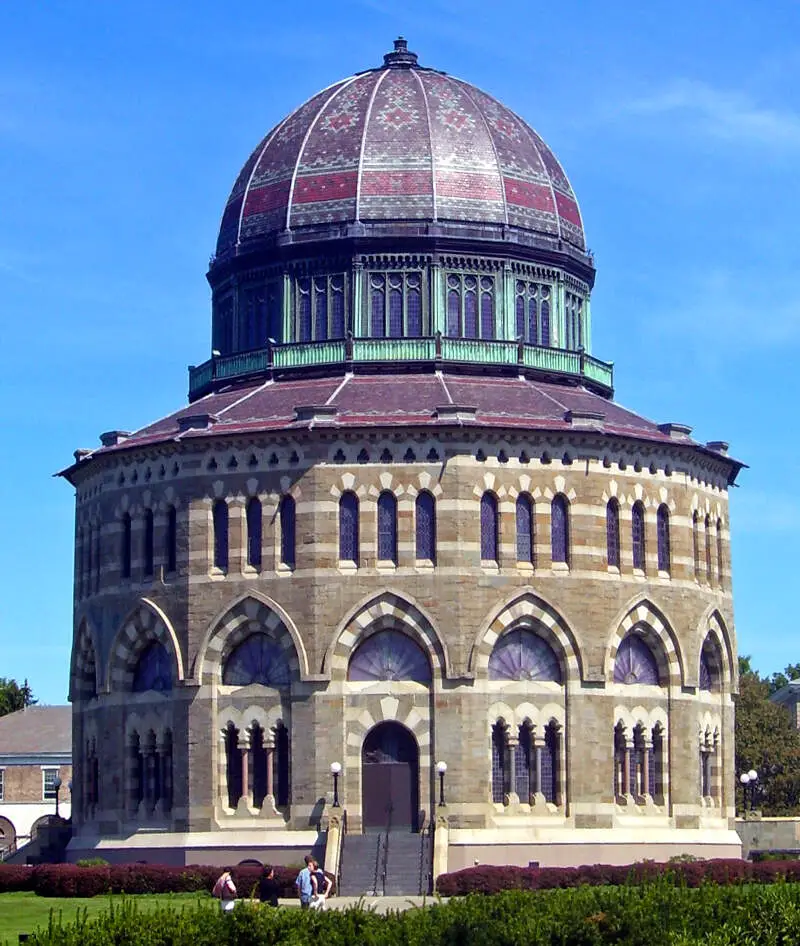
Ithaca is a city in the Southern Tier-Finger Lakes region of New York. It is the seat of Tompkins County, as well as the largest community in the Ithaca-Tompkins County metropolitan area. This area contains the municipalities of the Town of Ithaca, the village of Cayuga Heights, and other towns and villages in Tompkins County. The city of Ithaca is located on the southern shore of Cayuga Lake, in Central New York. It is named for the Greek island of Ithaca.
Data | Crime | Cost of living | Movers
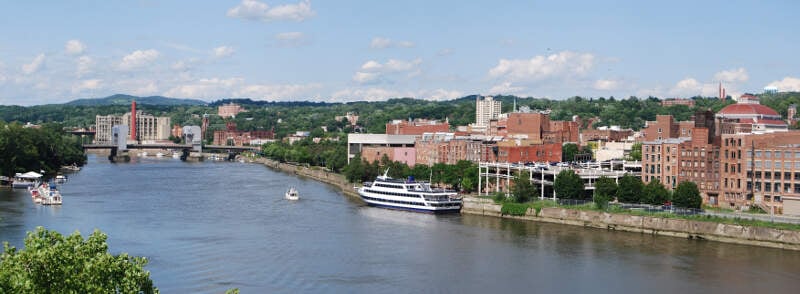
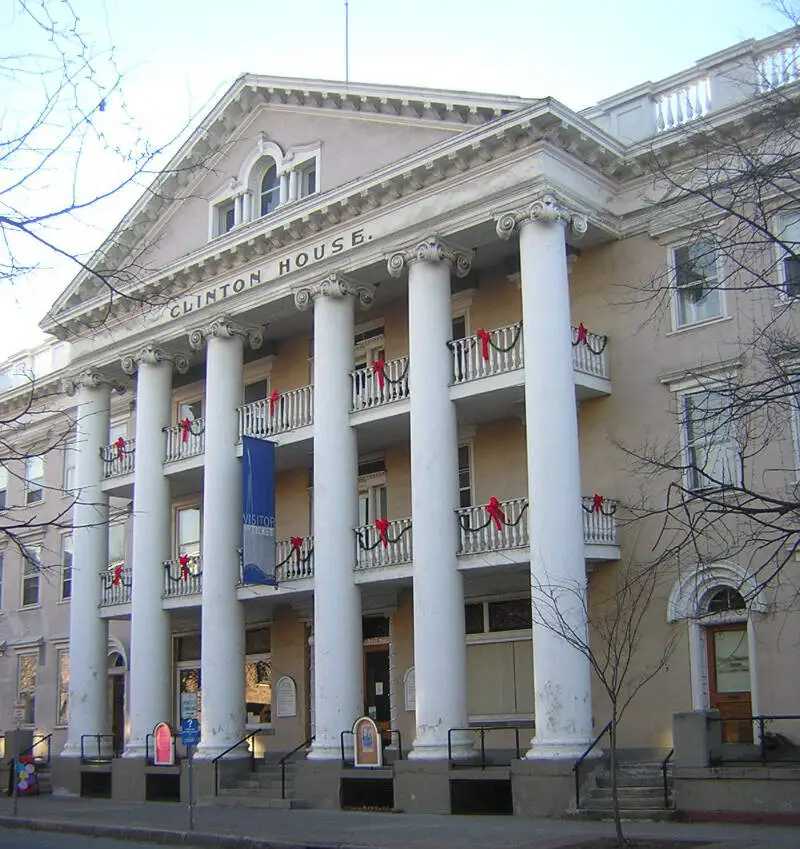
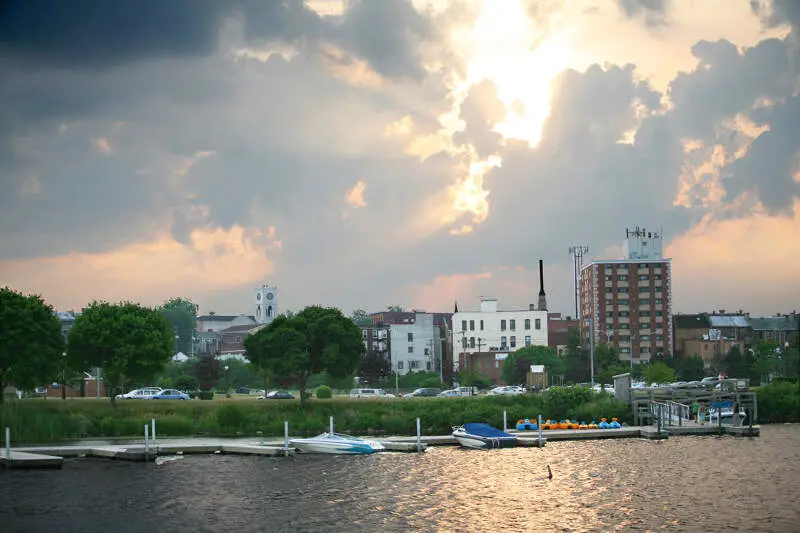
32.3 median age · 16.0% married households
Troy is a city in the U.S. State of New York and the seat of Rensselaer County. The city is located on the western edge of Rensselaer County and on the eastern bank of the Hudson River. Troy has close ties to the nearby cities of Albany and Schenectady, forming a region popularly called the Capital District. The city is one of the three major centers for the Albany Metropolitan Statistical Area, which has a population of 1,170,483. At the 2010 census, the population of Troy was 50,129. Troy’s motto is Ilium fuit. Troja est, which means “Ilium was, Troy is”.
Data | Crime | Cost of living | Movers
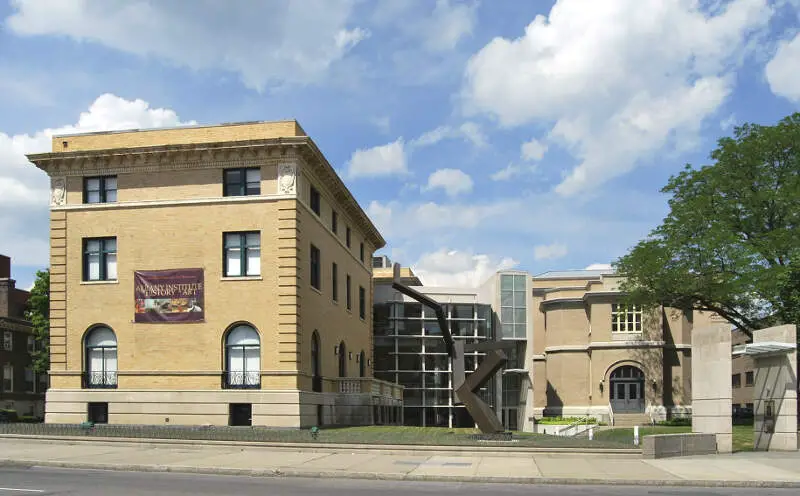
32.0 median age · 14.0% married households
Albany AWL-b-nee) is the capital of the U.S. state of New York and the seat of Albany County. Roughly 150 miles north of New York City, Albany developed on the west bank of the Hudson River, about 10 miles south of its confluence with the Mohawk River. The population of the City of Albany was 97,856 according to the 2010 census. Albany constitutes the economic and cultural core of the Capital District of New York State, which comprises the Albany-Schenectady-Troy, NY Metropolitan Statistical Area, including the nearby cities and suburbs of Troy, Schenectady, and Saratoga Springs. With a 2013 Census-estimated population of 1.1 million the Capital District is the third-most populous metropolitan region in the state and 38th in the United States.
Data | Crime | Cost of living | Movers
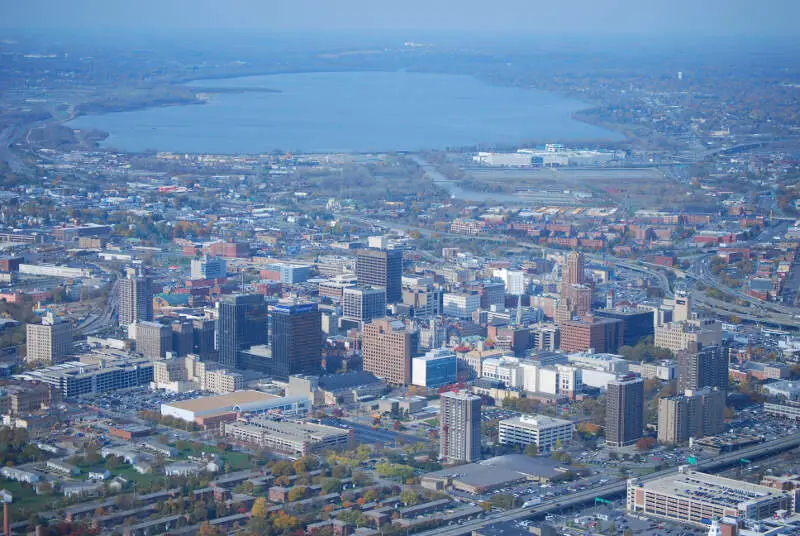
31.8 median age · 15.0% married households
Syracuse is a city in and the county seat of Onondaga County, New York, in the United States. It is the largest U.S. city with the name “Syracuse”, and is the fifth most populous city in the state of New York following New York City, Buffalo Rochester and Yonkers. At the 2010 census, the city population was 145,252, and its metropolitan area had a population of 662,577. It is the economic and educational hub of Central New York, a region with over one million inhabitants. Syracuse is also well-provided with convention sites, with a downtown convention complex. Syracuse was named after the original Greek city Syracuse, a city on the eastern coast of the Italian island of Sicily.
Data | Crime | Cost of living | Movers
36.1 median age · 18.0% married households
Schenectady is a city in Schenectady County, New York, United States, of which it is the county seat. As of the 2010 census, the city had a population of 66,135. The name “Schenectady” is derived from a Mohawk word skahnhtati meaning “beyond the pines”. The city was founded on the south side of the Mohawk River by Dutch colonists in the 17th century, many from the Albany area. They were prohibited from the fur trade by the Albany monopoly, which kept its control after the English takeover in 1664. Residents of the new village developed farms on strip plots along the river.
Data | Crime | Cost of living | Movers
38.2 median age · 11.0% married households
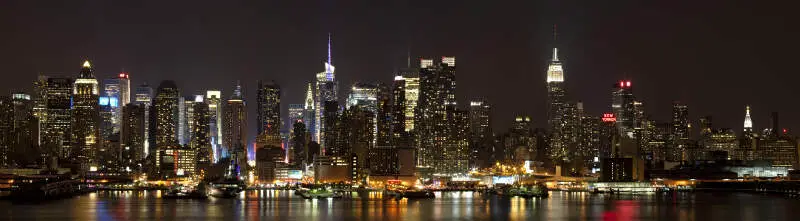
The City of New York, often called New York City or simply New York, is the most populous city in the United States. With an estimated 2016 population of 8,537,673 distributed over a land area of about 302.6 square miles, New York City is also the most densely populated major city in the United States. Located at the southern tip of the state of New York, the city is the center of the New York metropolitan area, one of the most populous urban agglomerations in the world with an estimated 23.7million residents as of 2016. A global power city, New York City has been described as the cultural, financial, and media capital of the world, and exerts a significant impact upon commerce, entertainment, research, technology, education, politics, and sports. The city’s fast pace defines the term New York minute. Home to the headquarters of the United Nations, New York is an important center for international diplomacy.
Data | Crime | Cost of living | Movers | Compare
23.1 median age · 15.0% married households
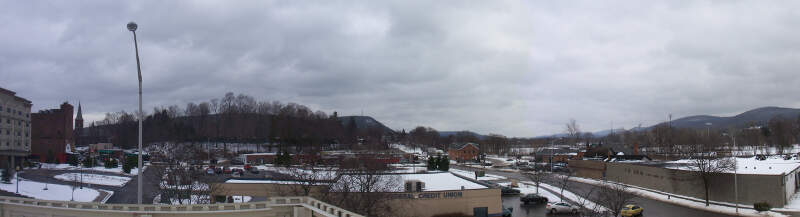
Oneonta is a city in southern Otsego County, New York, United States. According to the 2010 U.S. Census, it had a population of 13,901. Its nickname is “City of the Hills.” While the word “oneonta” is of undetermined origin, it is popularly believed to mean “place of open rocks” in the Mohawk language. This refers to a prominent geological formation known as “Tablerocks” at the western end of the city.
Data | Crime | Cost of living | Movers
33.7 median age · 13.0% married households
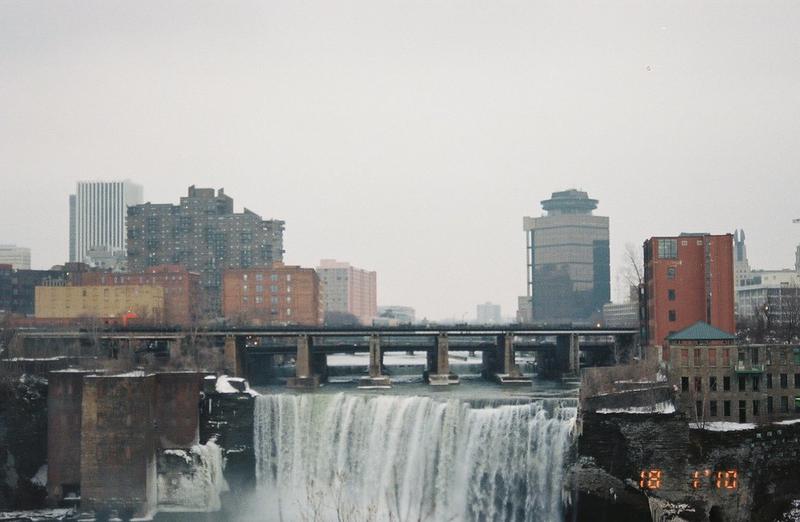
Rochester is a city on the southern shore of Lake Ontario in Western New York. Rochester is the third most populous city in New York state with over 210,000 residents, and its metropolitan area has a population of nearly 1.1 million people.
Data | Crime | Cost of living | Movers
32.6 median age · 20.0% married households
Geneva is a city in Ontario and Seneca counties in the U.S. state of New York. It is located at the northern end of Seneca Lake; all land portions of the city are within Ontario County; the water portions are in Seneca County. The population was 13,261 at the 2010 census. The city is supposedly named after the city and canton of Geneva in Switzerland. The main settlement of the Seneca was spelled Zoneshio by early white settlers, and was described as being 2 miles north of Seneca Lake.
Data | Crime | Cost of living | Movers
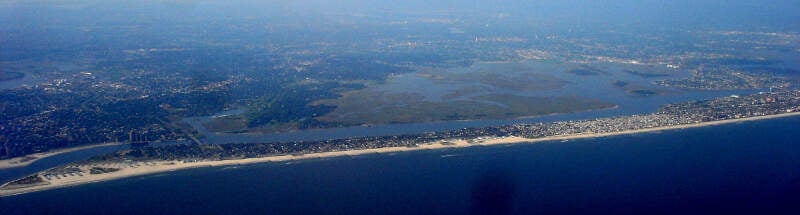
38.1 median age · 10.0% married households
Hempstead is one of the three towns in Nassau County, New York, United States, occupying the southwestern part of the county, in the western half of Long Island. Twenty-two incorporated villages are completely or partially within the town. Hempstead’s combined population was 759,757 at the 2010 Census, the majority of the population of the county and by far the most of any town in New York. Also, a village named Hempstead is within the Town.
Data | Crime | Cost of living | Movers
The receipts
Compare the top ten
Pick a metric. The bars rescale. The red line is New York’s statewide median.
On the map
Where New York’s singles cluster
Saturday Night Science
Methodology: How do you determine which city is best for singles in New York anyways?
To give you the places in New York which are best for singles to find one another, we used Saturday Night Science to look at a handful of metrics. Of course, we want to measure the type of people who live in each city and make some assumptions about what single people like.
So we researched the internet for a database that contains all that information.
We threw a lot of criteria at this one to get the best, most complete results possible. Using the 2020-2024 American Community Survey Census data produced for the state of New York, we looked at every single city in the state. We paid particular attention to:
- Population density
- % of population that’s male vs. female (closer to a 50-50 ratio is better)
- % of households with kids
- Median age
- Number of unmarried people in each city
We then gave each city a “Singles Score.”
The higher the score, the better the city is for singles to find one another. We also limited our results to cities with over 10,000 people. For New York, that meant a total of 86 cities.
We updated this article for 2026. This is our eleventh time ranking the best cities for singles in New York.
Read on to see why Ithaca is the talk of the town while Chestnut Ridge is probably a bit on the bland side.
The full plate
Best Cities For Singles In New York
Click any column to sort. Search by city name.
| Rank | City | Singles Score | Population | Median Age | % Married Households | % Households w/ Kids |
|---|---|---|---|---|---|---|
| 1 | Ithaca | 10.20 | 32,814 | 23.3 | 9.0% | 11.5% |
| 2 | Troy | 18.70 | 51,033 | 32.3 | 16.0% | 22.1% |
| 3 | Albany | 23.20 | 100,492 | 32.0 | 14.0% | 17.4% |
| 4 | Syracuse | 23.90 | 146,384 | 31.8 | 15.0% | 22.8% |
| 5 | Schenectady | 24.30 | 68,847 | 36.1 | 18.0% | 23.8% |
| 6 | New York | 26.60 | 8,483,844 | 38.2 | 11.0% | 26.1% |
| 7 | Oneonta | 26.70 | 15,045 | 23.1 | 15.0% | 22.5% |
| 8 | Rochester | 28.20 | 208,772 | 33.7 | 13.0% | 24.2% |
| 9 | Geneva | 28.20 | 12,512 | 32.6 | 20.0% | 19.7% |
| 10 | Hempstead | 29.20 | 58,801 | 38.1 | 10.0% | 42.5% |
| 11 | Binghamton | 29.70 | 47,151 | 35.9 | 18.0% | 20.7% |
| 12 | Spring Valley | 30.10 | 33,192 | 27.5 | 16.0% | 49.2% |
| 13 | Freeport | 30.50 | 44,088 | 40.0 | 15.0% | 33.4% |
| 14 | Glens Falls | 30.90 | 14,609 | 36.9 | 26.0% | 23.6% |
| 15 | Buffalo | 31.30 | 276,854 | 34.3 | 17.0% | 25.9% |
| 16 | Long Beach | 32.40 | 34,756 | 43.5 | 32.0% | 19.5% |
| 17 | Endicott | 32.80 | 13,387 | 36.4 | 20.0% | 25.1% |
| 18 | Plattsburgh | 32.90 | 19,830 | 31.9 | 18.0% | 19.8% |
| 19 | Cortland | 33.00 | 17,450 | 27.4 | 21.0% | 25.1% |
| 20 | Yonkers | 33.50 | 209,978 | 39.9 | 16.0% | 29.0% |
| 21 | Peekskill | 34.30 | 25,625 | 41.8 | 17.0% | 21.9% |
| 22 | Kingston | 34.70 | 23,911 | 37.2 | 21.0% | 27.8% |
| 23 | Haverstraw | 35.10 | 12,325 | 38.3 | 15.0% | 43.7% |
| 24 | Utica | 36.50 | 64,217 | 35.2 | 18.0% | 30.3% |
| 25 | Poughkeepsie | 36.70 | 31,958 | 38.1 | 15.0% | 26.9% |
| 26 | Port Chester | 36.70 | 31,102 | 39.0 | 12.0% | 31.6% |
| 27 | Patchogue | 36.80 | 12,396 | 39.5 | 28.0% | 20.0% |
| 28 | New Rochelle | 37.10 | 82,769 | 42.3 | 20.0% | 27.7% |
| 29 | Newburgh | 37.60 | 28,519 | 33.6 | 11.0% | 36.7% |
| 30 | Kiryas Joel | 37.80 | 38,916 | 15.7 | 59.0% | 80.5% |
| 31 | Watertown | 38.40 | 24,375 | 35.7 | 27.0% | 24.5% |
| 32 | Ossining | 39.00 | 26,950 | 40.7 | 16.0% | 32.1% |
| 33 | Great Neck | 39.10 | 11,087 | 38.6 | 23.0% | 35.3% |
| 34 | Mount Vernon | 39.40 | 72,427 | 40.7 | 15.0% | 27.9% |
| 35 | Elmira | 40.00 | 26,257 | 36.5 | 24.0% | 28.3% |
| 36 | Kenmore | 40.00 | 15,044 | 39.4 | 33.0% | 21.0% |
| 37 | New Hyde Park | 40.50 | 10,220 | 43.2 | 27.0% | 32.8% |
| 38 | Lindenhurst | 40.60 | 27,142 | 38.1 | 36.0% | 33.0% |
| 39 | Corning | 41.10 | 10,643 | 37.8 | 25.0% | 20.7% |
| 40 | Middletown | 41.20 | 30,289 | 36.3 | 22.0% | 39.3% |
| 41 | Jamestown | 42.00 | 28,188 | 39.8 | 24.0% | 26.1% |
| 42 | Auburn | 42.50 | 26,285 | 41.1 | 27.0% | 25.3% |
| 43 | Niagara Falls | 42.80 | 47,987 | 40.8 | 26.0% | 25.3% |
| 44 | Mamaroneck | 43.20 | 19,826 | 40.3 | 20.0% | 37.7% |
| 45 | Watervliet | 43.40 | 10,287 | 40.8 | 28.0% | 22.2% |
| 46 | Fulton | 43.70 | 11,272 | 34.1 | 27.0% | 36.4% |
| 47 | Amsterdam | 44.00 | 18,166 | 39.5 | 27.0% | 24.4% |
| 48 | West Haverstraw | 44.30 | 10,711 | 38.4 | 18.0% | 33.3% |
| 49 | Westbury | 44.50 | 15,808 | 44.5 | 25.0% | 35.2% |
| 50 | Valley Stream | 45.20 | 40,315 | 40.9 | 18.0% | 37.2% |
| 51 | Cohoes | 45.30 | 18,159 | 38.6 | 23.0% | 22.7% |
| 52 | Lackawanna | 45.40 | 19,753 | 37.9 | 21.0% | 26.8% |
| 53 | Beacon | 45.50 | 14,834 | 42.0 | 24.0% | 29.3% |
| 54 | Oswego | 46.80 | 17,033 | 35.7 | 31.0% | 28.0% |
| 55 | Olean | 47.60 | 13,738 | 39.0 | 26.0% | 29.4% |
| 56 | Gloversville | 48.00 | 14,962 | 38.0 | 29.0% | 25.5% |
| 57 | Sleepy Hollow | 48.20 | 10,887 | 41.9 | 11.0% | 35.8% |
| 58 | White Plains | 48.30 | 60,666 | 41.5 | 20.0% | 25.7% |
| 59 | Glen Cove | 48.80 | 28,112 | 44.0 | 23.0% | 24.9% |
| 60 | Suffern | 51.00 | 11,441 | 40.7 | 21.0% | 29.3% |
| 61 | Batavia | 51.40 | 15,097 | 42.9 | 30.0% | 18.2% |
| 62 | Massapequa Park | 51.60 | 16,963 | 43.9 | 53.0% | 29.5% |
| 63 | Floral Park | 52.30 | 16,169 | 43.5 | 38.0% | 35.5% |
| 64 | Dunkirk | 52.30 | 12,549 | 43.7 | 25.0% | 28.7% |
| 65 | Mineola | 52.50 | 21,211 | 41.6 | 28.0% | 28.2% |
| 66 | Saratoga Springs | 55.30 | 28,631 | 42.4 | 29.0% | 21.1% |
| 67 | North Tonawanda | 56.00 | 30,198 | 43.1 | 39.0% | 22.4% |
| 68 | Rye | 56.10 | 16,428 | 42.5 | 25.0% | 46.1% |
| 69 | Lake Grove | 56.90 | 11,061 | 40.1 | 32.0% | 31.9% |
| 70 | Dobbs Ferry | 57.30 | 11,443 | 41.5 | 21.0% | 39.9% |
| 71 | Babylon | 57.50 | 12,185 | 45.5 | 43.0% | 27.3% |
| 72 | Mount Kisco | 58.00 | 10,737 | 40.9 | 26.0% | 29.1% |
| 73 | Lockport | 58.30 | 20,610 | 36.8 | 31.0% | 28.6% |
| 74 | Rome | 58.90 | 31,795 | 40.7 | 30.0% | 25.5% |
| 75 | Lancaster | 59.20 | 10,113 | 45.1 | 40.0% | 22.5% |
| 76 | East Rockaway | 59.50 | 10,077 | 41.5 | 38.0% | 31.5% |
| 77 | Scarsdale | 59.60 | 18,010 | 41.5 | 28.0% | 55.9% |
| 78 | Canandaigua | 59.60 | 10,514 | 45.5 | 27.0% | 18.1% |
| 79 | Depew | 60.20 | 15,000 | 43.4 | 38.0% | 21.6% |
| 80 | Airmont | 60.40 | 10,205 | 24.3 | 36.0% | 48.6% |
| 81 | Lynbrook | 60.70 | 20,325 | 42.3 | 36.0% | 34.6% |
| 82 | Massena | 62.50 | 10,238 | 42.6 | 28.0% | 22.8% |
| 83 | Rockville Centre | 62.90 | 25,765 | 42.9 | 44.0% | 35.4% |
| 84 | Harrison | 63.40 | 29,961 | 37.2 | 28.0% | 43.2% |
| 85 | Oneida | 63.80 | 10,171 | 47.0 | 37.0% | 23.4% |
| 86 | Chestnut Ridge | 65.40 | 10,557 | 26.9 | 34.0% | 47.4% |
Source: U.S. Census ACS 2020-2024. 86 cities with more than 10,000 residents.
Summary
Summary: The Best Cities For Singles In New York For 2026
If you’re looking for a breakdown of cities in New York ranked by criteria that most agree make a place a great spot for finding a single person (and potentially love), this is an accurate list.
The best cities for singles in New York are Ithaca, Troy, Albany, Syracuse, Schenectady, New York, Oneonta, Rochester, Geneva, and Hempstead. Not sold on New York? Take the two-minute Find Your Place quiz and see which state actually fits you.
Questions and answers
Best Cities For Singles In New York FAQs
What is the best city for singles in New York?
Ithaca is the best city for singles in New York for 2026, according to Saturday Night Science. Troy and Albany are next.
What are the best cities for singles in New York?
The best New York cities for singles are Ithaca, Troy, Albany, Syracuse, Schenectady, New York, Oneonta, Rochester, Geneva, and Hempstead. We ranked all 86 cities with more than 10,000 residents.
How do you rank cities for singles?
Singles-friendliness is measured by population density, gender balance, median age, and the share of unmarried residents, all from Census American Community Survey data. More single people around means better odds.
Why did Ithaca come out on top?
Ithaca posts the best combination of unmarried residents, a dating-friendly age mix, and enough density to actually run into people. That combination beat the other 86 qualifying cities.
What is the toughest place to be single in New York?
Chestnut Ridge ranks last for singles in New York — more married households and fewer chances to mingle. If you are single and settling there anyway, bring hobbies.


