Most Asian cities in Alabama research summary. We analyzed Alabama’s most recent Census data to determine the most Asian cities in Alabama based on the percentage of Asian residents.
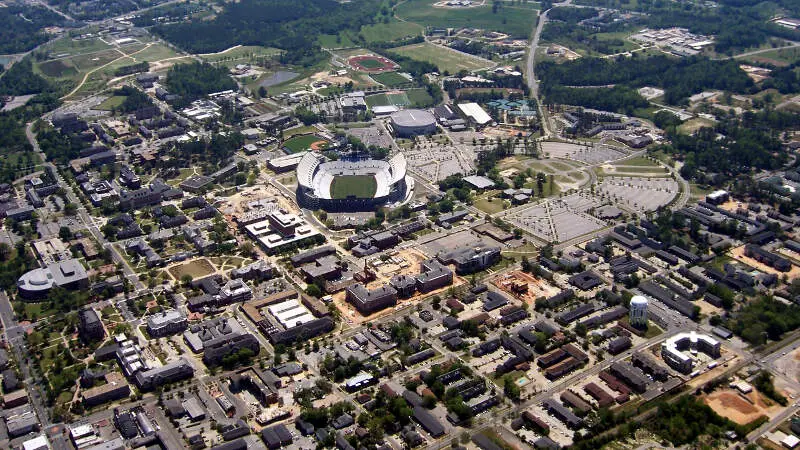
8.5% Asian · #1 most Asian in Alabama
Auburn is a city in Lee County, Alabama, United States. It is the largest city in eastern Alabama with a 2016 population of 63,118. It is a principal city of the Auburn-Opelika Metropolitan Area. The Auburn-Opelika, AL MSA with a population of 158,991, along with the Columbus, GA-AL MSA and Tuskegee, Alabama, comprises the greater Columbus-Auburn-Opelika, GA-AL CSA, a region home to 501,649 residents.
Data | Crime | Cost of living | Movers
7.1% Asian · #2 most Asian in Alabama
Madison is a city located primarily in Madison County, near the northern border of the State of Alabama. Madison extends west into neighboring Limestone County. The city is included in the Huntsville Metropolitan Area, the second-largest in the state, and is also included in the merged Huntsville-Decatur Combined Statistical Area. As of the 2010 census, the population of the city was 42,938. Madison is bordered by Huntsville on all sides.
Data | Crime | Cost of living | Movers

5.9% Asian · #3 most Asian in Alabama
Hoover is a city in Jefferson and Shelby counties in north central Alabama, United States. The largest suburb around Birmingham, the population of the city was 84,848 as of the 2015 US Census estimate. Hoover is part of the Birmingham-Hoover, AL Metropolitan Statistical Area and is also included in the Birmingham-Hoover-Talladega, AL Combined Statistical Area. Hoover-s neighborhoods and planned communities are located along the foothills of the Appalachian Mountains.
Data | Crime | Cost of living | Movers
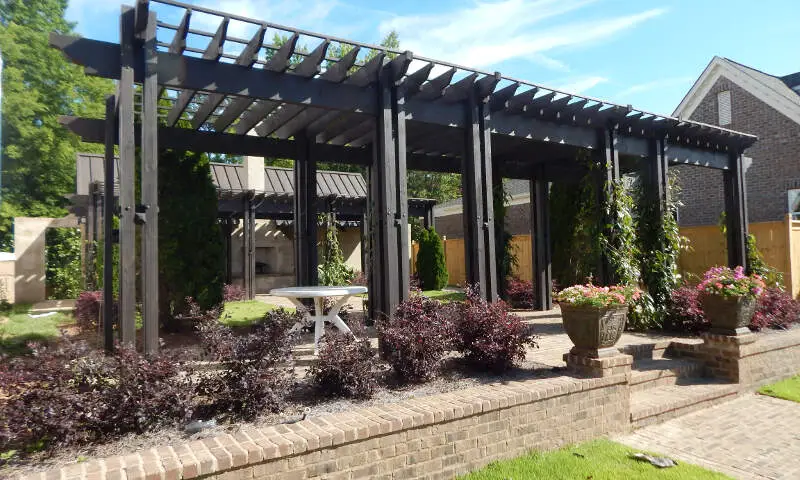
4.9% Asian · #4 most Asian in Alabama
Vestavia Hills is a city in Jefferson and Shelby counties in the State of Alabama. It is a suburb of the city of Birmingham. As of the 2010 census, its population was 34,033, up from 24,476 in 2000. It moved up from the fifth largest city in Jefferson County in 2000 to the third largest in 2010, behind Birmingham and Hoover.
Data | Crime | Cost of living | Movers
3.5% Asian · #5 most Asian in Alabama
Trussville is a city in Jefferson and St. Clair counties in the State of Alabama. It is a suburb of Birmingham and part of the Birmingham-Hoover Metropolitan Statistical Area. Its estimated 2015 population was 21,023.
Data | Crime | Cost of living | Movers
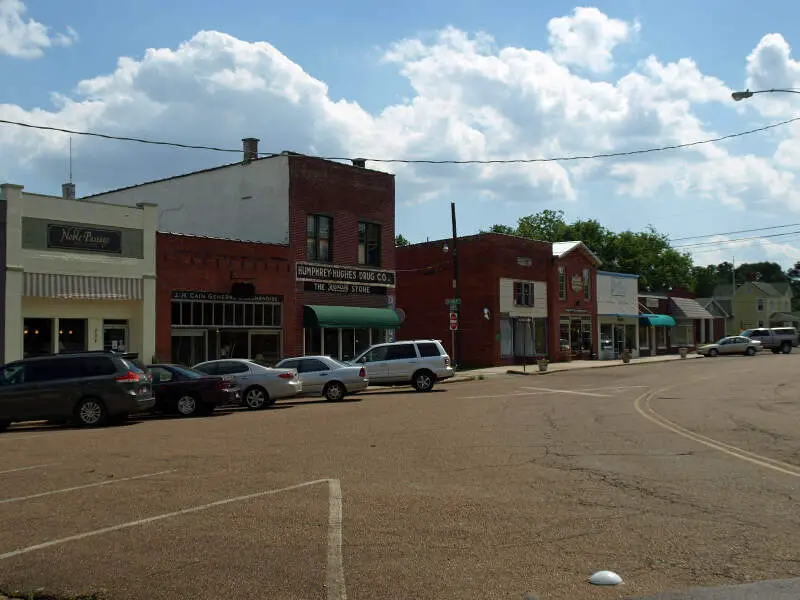
3.5% Asian · #6 most Asian in Alabama
Greenville is a city in Butler County, Alabama, United States. At the 2010 census, the population was 8,135. The city is the county seat of Butler County and is known as the Camellia City. The movement to change the official Alabama state flower from the goldenrod to the camellia originated in Greenville with legislative sponsors LaMont Glass and H.B. Taylor.
Data | Crime | Cost of living | Movers

3.4% Asian · #7 most Asian in Alabama
Montgomery is a major city and the capital of the U.S. state of Alabama and the county seat of Montgomery County. Named for Richard Montgomery, it is located on the Alabama River, in the Gulf Coastal Plain. As of the 2013 Census, Montgomery has a population of 201,332. It is the second-largest city in Alabama, after Birmingham, and is the 115th largest in the United States. The Montgomery Metropolitan Statistical Area had a 2010 estimated population of 374,536. It is the fourth-largest in the state and 136th among United States metropolitan areas.
Data | Crime | Cost of living | Movers

3.1% Asian · #8 most Asian in Alabama
Pelham is a city in Shelby County, Alabama, United States. It incorporated in July 1964. It was named for Confederate American Civil War officer John Pelham.
The City of Pelham operates under the Mayor/Council Act. The Mayor serves as the city’s chief executive and the City Council act much like a board of directors.
Data | Crime | Cost of living | Movers
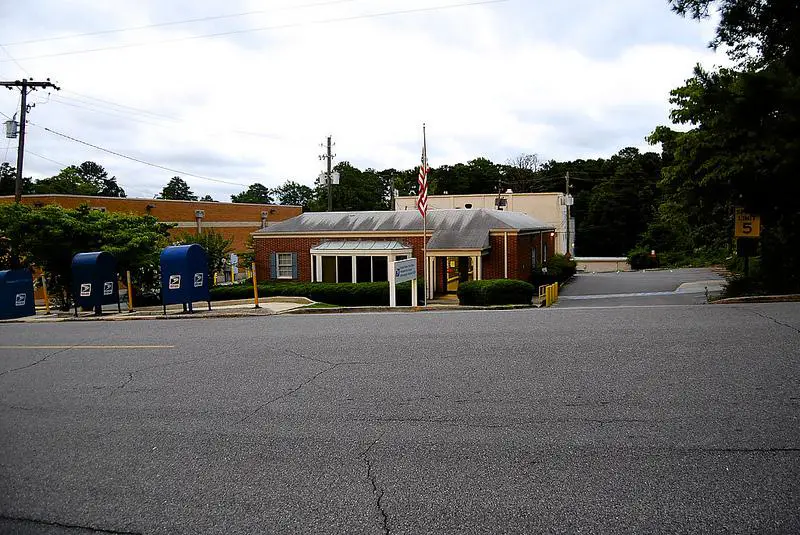
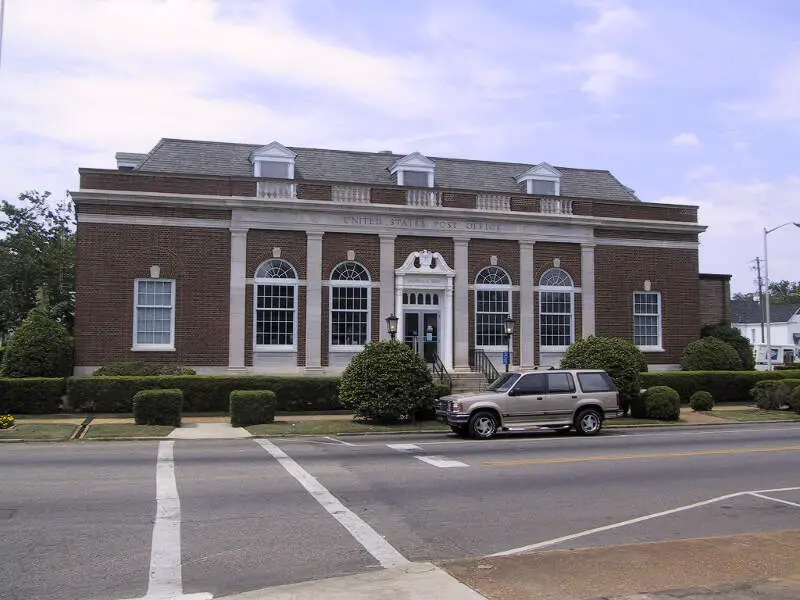
3.1% Asian · #9 most Asian in Alabama
Troy is a city in Pike County, Alabama, United States. The city is the county seat of Pike County. It was formally incorporated on February 4, 1843.
Data | Crime | Cost of living | Movers
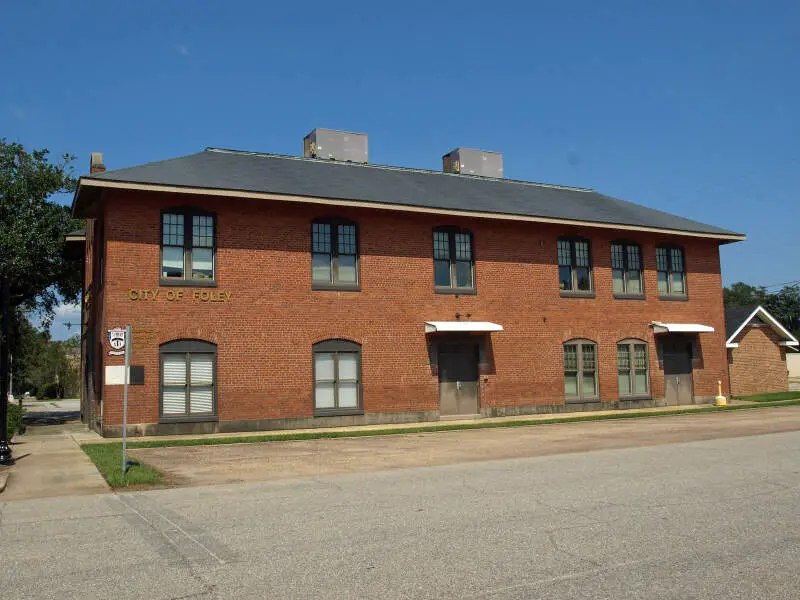
2.9% Asian · #10 most Asian in Alabama
Foley is a city in Baldwin County, Alabama, United States. The 2010 census lists the population of the city as 14,618. Foley is a principal city of the Daphne-Fairhope-Foley Micropolitan Statistical Area, which includes all of Baldwin County.
Data | Crime | Cost of living | Movers
The receipts
Compare the top ten
Pick a metric. The bars rescale. The red line is Alabama’s statewide median.
On the map
Where Alabama’s Asian communities live
Saturday Night Science
Methodology: How We Determined The Cities In Alabama With The Largest Asian Population For 2026
We used Saturday Night Science to compare Census data on race across every place in Alabama.
The Census’s most recently available data comes from the 2020-2024 American Community Survey.
Specifically, we looked at table B03002: Hispanic OR LATINO ORIGIN BY RACE. Here are the category names as defined by the Census:
- Hispanic or Latino
- White alone*
- Black or African American alone*
- American Indian and Alaska Native alone*
- Asian alone*
- Native Hawaiian and Other Pacific Islander alone*
- Some other race alone*
- Two or more races*
Our particular column of interest here was the number of people who identified as Asian alone.
We limited our analysis to cities with a population greater than 5,000 people. That left us with 100 cities.
We then calculated the percentage of residents that are Asian. The percentages ranked from 8.5% to 0.0%.
Finally, we ranked each city based on the percentage of Asian population, with a higher percentage being more Asian. Auburn took the distinction of being the most Asian, while Opp was the least Asian city.
We updated this article for 2026. This report reflects our eleventh time ranking the cities in Alabama with the largest Asian population.
The full plate
Cities In Alabama By Asian Population
Click any column to sort. Search by city name.
| Rank | City | Population | Asian Population | % Asian |
|---|---|---|---|---|
| 1 | Auburn | 80,594 | 6,861 | 8.5% |
| 2 | Madison | 60,106 | 4,288 | 7.1% |
| 3 | Hoover | 92,642 | 5,494 | 5.9% |
| 4 | Vestavia Hills | 38,616 | 1,881 | 4.9% |
| 5 | Trussville | 26,673 | 932 | 3.5% |
| 6 | Greenville | 7,163 | 248 | 3.5% |
| 7 | Montgomery | 197,494 | 6,654 | 3.4% |
| 8 | Pelham | 24,827 | 780 | 3.1% |
| 9 | Troy | 17,716 | 555 | 3.1% |
| 10 | Foley | 24,026 | 688 | 2.9% |
| 11 | Satsuma | 6,822 | 176 | 2.6% |
| 12 | Tuscaloosa | 111,038 | 2,831 | 2.5% |
| 13 | Helena | 21,769 | 555 | 2.5% |
| 14 | Clay | 10,273 | 254 | 2.5% |
| 15 | Rainbow City | 10,284 | 251 | 2.4% |
| 16 | Homewood | 27,829 | 667 | 2.4% |
| 17 | Mobile | 203,416 | 4,494 | 2.2% |
| 18 | Pinson | 7,832 | 171 | 2.2% |
| 19 | Huntsville | 222,791 | 4,710 | 2.1% |
| 20 | Montevallo | 7,556 | 152 | 2.0% |
| 21 | Daphne | 29,453 | 589 | 2.0% |
| 22 | Opelika | 32,820 | 588 | 1.8% |
| 23 | Prattville | 39,482 | 702 | 1.8% |
| 24 | Arab | 8,679 | 148 | 1.7% |
| 25 | Chickasaw | 6,332 | 97 | 1.5% |
| 26 | Enterprise | 29,505 | 450 | 1.5% |
| 27 | Dothan | 71,514 | 1,038 | 1.5% |
| 28 | Jacksonville | 14,437 | 209 | 1.4% |
| 29 | Alexander City | 14,606 | 203 | 1.4% |
| 30 | Muscle Shoals | 16,951 | 235 | 1.4% |
| 31 | Millbrook | 17,189 | 238 | 1.4% |
| 32 | Birmingham | 198,173 | 2,730 | 1.4% |
| 33 | Oxford | 22,063 | 299 | 1.4% |
| 34 | Phenix City | 38,499 | 476 | 1.2% |
| 35 | Glencoe | 5,353 | 63 | 1.2% |
| 36 | Selma | 17,057 | 199 | 1.2% |
| 37 | Bay Minette | 8,295 | 96 | 1.2% |
| 38 | Wetumpka | 7,437 | 85 | 1.1% |
| 39 | Gulf Shores | 16,401 | 187 | 1.1% |
| 40 | Pell City | 13,587 | 152 | 1.1% |
| 41 | Moody | 13,488 | 150 | 1.1% |
| 42 | Alabaster | 33,917 | 376 | 1.1% |
| 43 | Southside | 9,483 | 102 | 1.1% |
| 44 | Athens | 29,002 | 308 | 1.1% |
| 45 | Lincoln | 7,305 | 77 | 1.1% |
| 46 | Talladega | 14,760 | 146 | 1.0% |
| 47 | Scottsboro | 15,712 | 148 | 0.9% |
| 48 | Florence | 41,701 | 372 | 0.9% |
| 49 | Smiths Station | 5,496 | 49 | 0.9% |
| 50 | Decatur | 57,361 | 485 | 0.8% |
| 51 | Guntersville | 8,916 | 66 | 0.7% |
| 52 | Irondale | 13,464 | 99 | 0.7% |
| 53 | Jasper | 14,442 | 106 | 0.7% |
| 54 | Ozark | 14,327 | 105 | 0.7% |
| 55 | Mountain Brook | 22,029 | 160 | 0.7% |
| 56 | Chelsea | 16,260 | 108 | 0.7% |
| 57 | Northport | 31,218 | 196 | 0.6% |
| 58 | Fultondale | 9,384 | 58 | 0.6% |
| 59 | Fairhope | 24,190 | 146 | 0.6% |
| 60 | Calera | 17,714 | 106 | 0.6% |
| 61 | Hueytown | 16,414 | 98 | 0.6% |
| 62 | Demopolis | 6,908 | 40 | 0.6% |
| 63 | Albertville | 22,813 | 121 | 0.5% |
| 64 | Spanish Fort | 10,662 | 55 | 0.5% |
| 65 | Clanton | 8,958 | 45 | 0.5% |
| 66 | Brewton | 5,186 | 24 | 0.5% |
| 67 | Tuskegee | 8,938 | 41 | 0.5% |
| 68 | Saraland | 16,404 | 72 | 0.4% |
| 69 | Gadsden | 33,374 | 137 | 0.4% |
| 70 | Eufaula | 12,584 | 47 | 0.4% |
| 71 | Anniston | 21,271 | 77 | 0.4% |
| 72 | Gardendale | 16,534 | 58 | 0.4% |
| 73 | Valley | 10,277 | 36 | 0.4% |
| 74 | Lanett | 6,814 | 22 | 0.3% |
| 75 | Cullman | 19,319 | 57 | 0.3% |
| 76 | Leeds | 12,028 | 32 | 0.3% |
| 77 | Fort Payne | 14,927 | 28 | 0.2% |
| 78 | Atmore | 8,334 | 15 | 0.2% |
| 79 | Robertsdale | 7,194 | 11 | 0.2% |
| 80 | Roanoke | 5,336 | 8 | 0.1% |
| 81 | Sheffield | 9,340 | 14 | 0.1% |
| 82 | Orange Beach | 8,407 | 11 | 0.1% |
| 83 | Prichard | 18,961 | 24 | 0.1% |
| 84 | Center Point | 15,914 | 17 | 0.1% |
| 85 | Hartselle | 15,847 | 10 | 0.1% |
| 86 | Fairfield | 9,728 | 6 | 0.1% |
| 87 | Bessemer | 25,400 | 5 | 0.0% |
| 94 | Russellville | 10,799 | 0 | 0.0% |
| 94 | Hamilton | 6,922 | 0 | 0.0% |
| 94 | Attalla | 5,775 | 0 | 0.0% |
| 94 | Oneonta | 6,971 | 0 | 0.0% |
| 94 | Sylacauga | 12,309 | 0 | 0.0% |
| 94 | Tuscumbia | 9,115 | 0 | 0.0% |
| 94 | Pleasant Grove | 9,442 | 0 | 0.0% |
| 94 | Monroeville | 5,802 | 0 | 0.0% |
| 94 | Andalusia | 8,766 | 0 | 0.0% |
| 94 | Midfield | 5,045 | 0 | 0.0% |
| 94 | Boaz | 10,814 | 0 | 0.0% |
| 94 | Tarrant | 5,925 | 0 | 0.0% |
| 94 | Opp | 6,709 | 0 | 0.0% |
Source: U.S. Census ACS 2020-2024. 100 cities with more than 5,000 residents.
Summary
Summary: Asian Populations Across Alabama
If you’re looking for a breakdown of Asian populations across Alabama according to the most recent data, this is an accurate list.
The most Asian cities in Alabama are Auburn, Madison, Hoover, Vestavia Hills, Trussville, Greenville, Montgomery, Pelham, Troy, and Foley. Not sold on Alabama? Take the two-minute Find Your Place quiz and see which state actually fits you.
Questions and answers
Most Asian Cities In Alabama FAQs
What is the most Asian city in Alabama?
Auburn is the most Asian city in Alabama for 2026, at 8.5% of residents. Madison and Hoover are next.
What cities in Alabama have the largest Asian population?
The Alabama cities with the largest Asian population shares are Auburn, Madison, Hoover, Vestavia Hills, Trussville, Greenville, Montgomery, Pelham, Troy, and Foley. We ranked all 100 places with more than 5,000 residents.
What percent of Auburn is Asian?
Asian residents make up 8.5% of Auburn, the highest share of the 100 Alabama places we measured. The numbers come from the Census Bureau’s American Community Survey.
What is the least Asian city in Alabama?
Opp is the least Asian city in Alabama, at 0.0%. It sits at the opposite end of the same ranking.
Where does this data come from?
Every share is calculated from the Census Bureau’s American Community Survey (2020-2024), based on residents identifying as Asian alone. We rank each Alabama place with more than 5,000 residents.


