Racial diversity in New York is a mixed bag.
There are parts of New York where there’s a high level of diversity. But where will you find the most diverse places in New York?
To answer that question, we went to the US Census data. Using Saturday Night Science, we measured the Gini coefficient for all 168 cities in New York to rank them from most to least diverse.
#1 most diverse in New York
Valley Stream is a village in Nassau County, New York, United States. The population in the Village of Valley Stream was 37,511 at the 2010 census.
Data | Crime | Cost of living | Movers
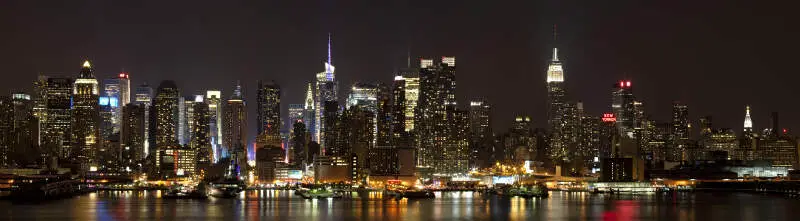
#2 most diverse in New York
The City of New York, often called New York City or simply New York, is the most populous city in the United States. With an estimated 2016 population of 8,537,673 distributed over a land area of about 302.6 square miles, New York City is also the most densely populated major city in the United States. Located at the southern tip of the state of New York, the city is the center of the New York metropolitan area, one of the most populous urban agglomerations in the world with an estimated 23.7million residents as of 2016. A global power city, New York City has been described as the cultural, financial, and media capital of the world, and exerts a significant impact upon commerce, entertainment, research, technology, education, politics, and sports. The city’s fast pace defines the term New York minute. Home to the headquarters of the United Nations, New York is an important center for international diplomacy.
Data | Crime | Cost of living | Movers
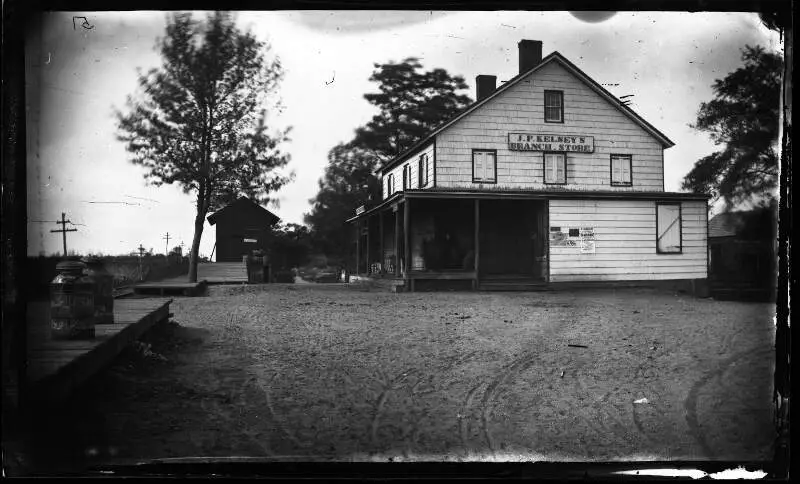
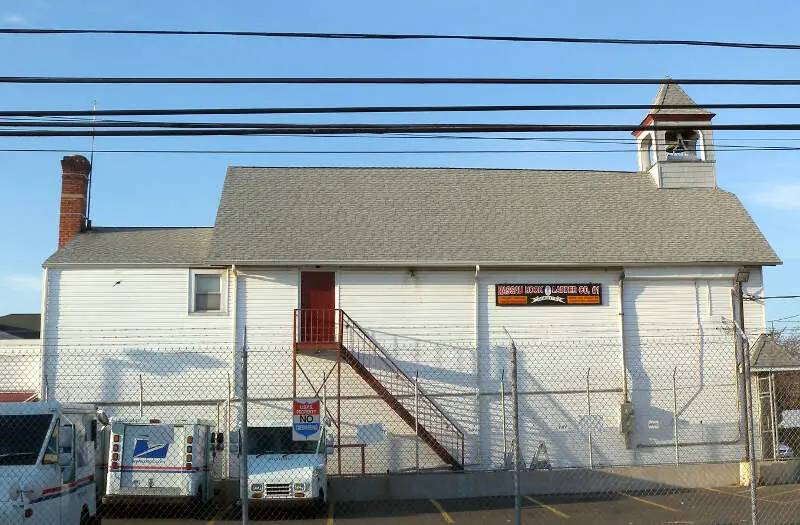
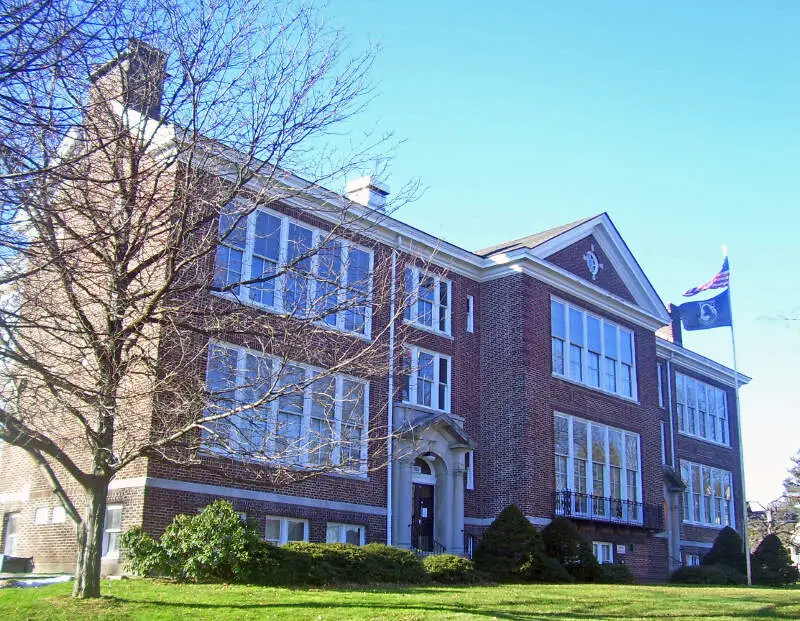
#3 most diverse in New York
Westbury incorporated in 1932 as a village in Nassau County, New York, United States. The population was 15,146 at the 2010 census. The Incorporated Village of Westbury is in the Town of North Hempstead. It is located about 18 miles east of Manhattan.
Data | Crime | Cost of living | Movers
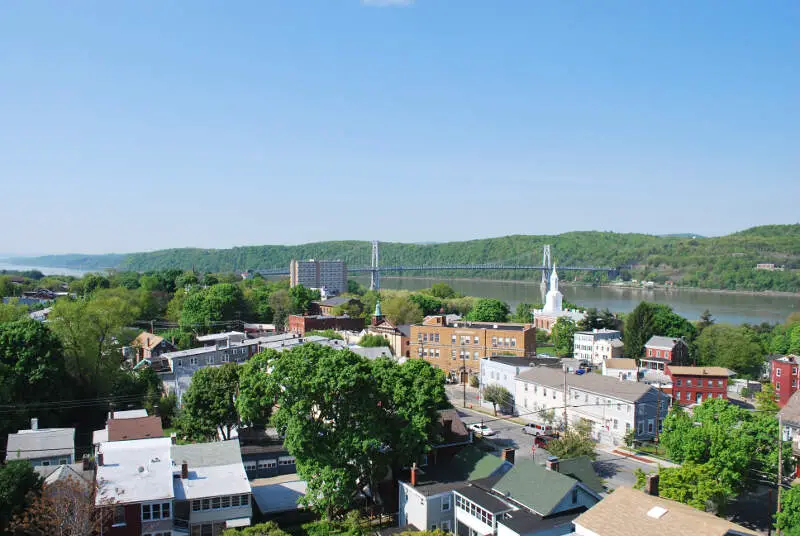
#4 most diverse in New York
Poughkeepsie, officially the City of Poughkeepsie, is a city in the state of New York, United States, which is the county seat of Dutchess County. As of the 2010 census it had a population of 32,736. Poughkeepsie is in the Hudson Valley midway between New York City and Albany, and is part of the New York metropolitan area. The name derives from a word in the Wappinger language, roughly U-puku-ipi-sing, meaning “the reed-covered lodge by the little-water place,” referring to a spring or stream feeding into the Hudson River south of the present downtown area.
Data | Crime | Cost of living | Movers
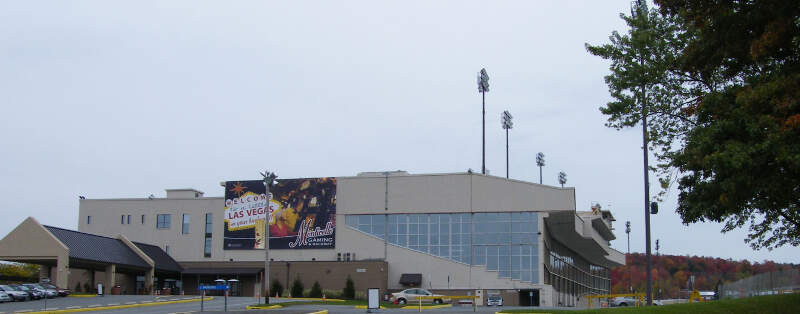
#5 most diverse in New York
Monticello is a village located in Thompson in Sullivan County, New York, United States. The population was 6,726 at the 2010 census. It is the seat for the Town of Thompson and the county seat of Sullivan County. The village was named after the residence of Thomas Jefferson.
Data | Crime | Cost of living | Movers
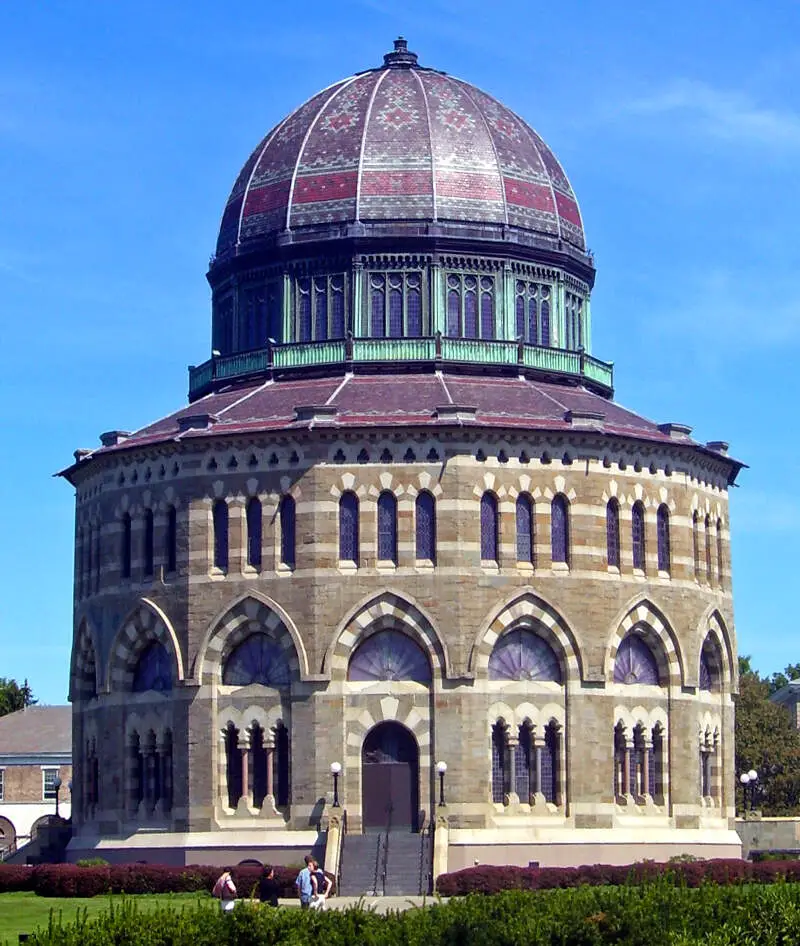
#6 most diverse in New York
Schenectady is a city in Schenectady County, New York, United States, of which it is the county seat. As of the 2010 census, the city had a population of 66,135. The name “Schenectady” is derived from a Mohawk word skahnhtati meaning “beyond the pines”. The city was founded on the south side of the Mohawk River by Dutch colonists in the 17th century, many from the Albany area. They were prohibited from the fur trade by the Albany monopoly, which kept its control after the English takeover in 1664. Residents of the new village developed farms on strip plots along the river.
Data | Crime | Cost of living | Movers
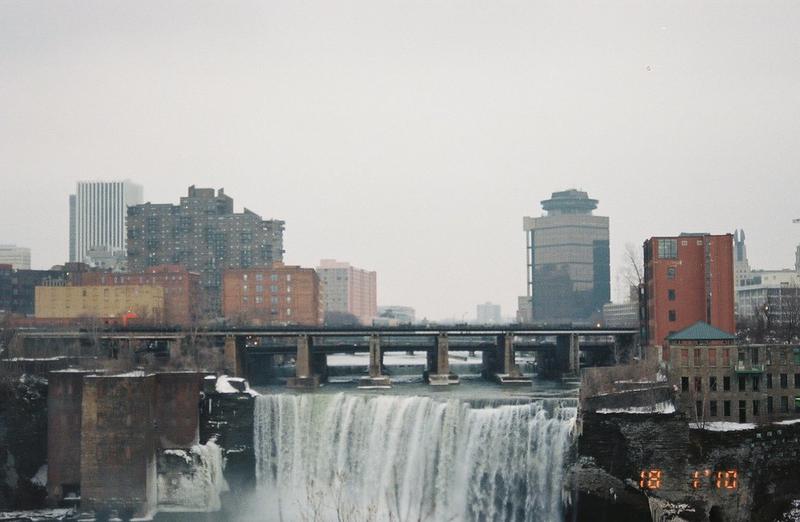
#7 most diverse in New York
Rochester is a city on the southern shore of Lake Ontario in Western New York. Rochester is the third most populous city in New York state with over 210,000 residents, and its metropolitan area has a population of nearly 1.1 million people.
Data | Crime | Cost of living | Movers
#8 most diverse in New York
Spring Valley is a village in the towns of Ramapo and Clarkstown in Rockland County, New York, United States. It is located north of Chestnut Ridge, east of Airmont and Monsey, south of Hillcrest, and west of Nanuet. The population was 31,347 at the 2010 census, making it the 2nd most populous community in Rockland County, after New City.
Data | Crime | Cost of living | Movers
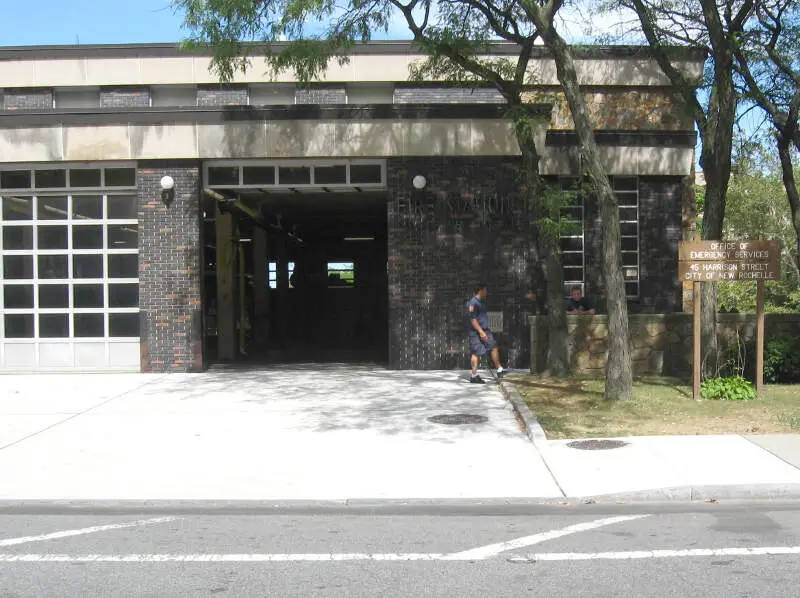
#9 most diverse in New York
New Rochelle is a city in Westchester County, New York, United States, in the southeastern portion of the state.
Data | Crime | Cost of living | Movers
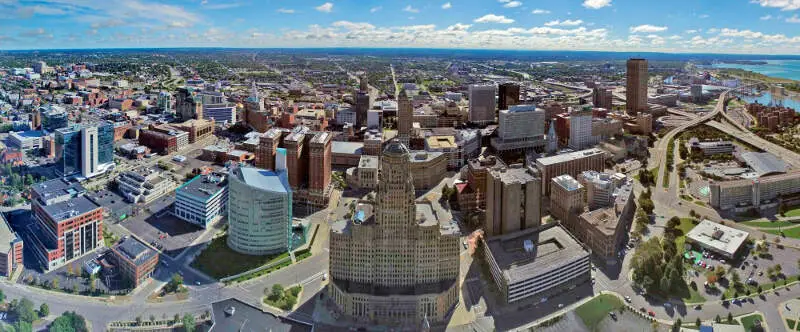
#10 most diverse in New York
Buffalo is the second-largest city in the U.S. state of New York and the 8most populous city in the United States. As of July 2016, the population was 256,902, a slight decrease from the 2010 census. It is the principal municipality of the Buffalo-Niagara Falls metropolitan area, a region with 1,134,210 residents in the MSA and 1,213,668 in the CSA. The city serves as the county seat of Erie County. The city also is a major gateway for commerce and travel at the Canada-United States border, forming part of the bi-national Buffalo Niagara Region.
Data | Crime | Cost of living | Movers
The receipts
Compare the top ten
Pick a metric. The bars rescale. The red line is New York’s statewide median.
On the map
Where diversity lives in New York
Saturday Night Science
Methodology: How we determined the most diverse cities in New York for 2026
We still believe in the accuracy of data — especially from the Census — and Saturday Night Science. So that’s where we went to get the race breakdown across New York.
That leads us to the Census’s most recently available data, the 2020-2024 American Community Survey data from the US Census.
Specifically, we looked at table B03002: HISPANIC OR LATINO ORIGIN BY RACE. Here are the category names as defined by the Census:
- White alone*
- Black or African American alone*
- American Indian and Alaska Native alone*
- Asian alone*
- Native Hawaiian and Other Pacific Islander alone*
- Some other race alone*
- Two or more races*
- Hispanic or Latino
We limited our analysis to non-CDPs with a population greater than 5,000 people. That left us with 168 cities.
We then calculated the HHI for each city by finding the racial breakdown of a city in percent terms, squaring them, and then adding the squares together. This left us with scores ranging from 2,203 (Valley Stream) to 9,702 (Kaser).
Finally, we ranked each city based on the HHI, with a lower score being more diverse than a high score. Valley Stream took the distinction of being the most diverse, while Kaser was the least diverse city.
We updated this article for 2026. This report is our eleventh time ranking the most diverse places in New York.
The full plate
Race By City In New York For 2026
Click any column to sort. Search by city name.
| Rank | City | Population | HHI | % White | % Black | % Hispanic | % Asian |
|---|---|---|---|---|---|---|---|
| 1 | Valley Stream | 40,315 | 2,203 | 23.9% | 25.8% | 23.6% | 19.6% |
| 2 | New York | 8,483,844 | 2,419 | 31.0% | 20.4% | 28.5% | 14.6% |
| 3 | Westbury | 15,808 | 2,739 | 34.2% | 16.2% | 34.4% | 10.2% |
| 4 | Poughkeepsie | 31,958 | 2,783 | 32.8% | 30.0% | 27.5% | 1.6% |
| 5 | Monticello | 7,279 | 2,835 | 28.7% | 24.5% | 37.1% | 4.6% |
| 6 | Schenectady | 68,847 | 2,945 | 47.5% | 18.7% | 12.7% | 5.9% |
| 7 | Rochester | 208,772 | 2,950 | 36.4% | 34.7% | 19.6% | 3.2% |
| 8 | Spring Valley | 33,192 | 2,968 | 36.1% | 28.6% | 28.7% | 4.7% |
| 9 | New Rochelle | 82,769 | 2,986 | 41.4% | 18.2% | 29.9% | 5.3% |
| 10 | Buffalo | 276,854 | 3,025 | 42.4% | 31.3% | 12.3% | 8.7% |
| 11 | White Plains | 60,666 | 3,070 | 42.5% | 12.4% | 32.1% | 8.6% |
| 12 | Walden | 6,868 | 3,088 | 45.6% | 12.9% | 26.4% | 3.7% |
| 13 | Middletown | 30,289 | 3,120 | 27.0% | 21.6% | 43.6% | 3.5% |
| 14 | Yonkers | 209,978 | 3,247 | 30.9% | 14.6% | 45.2% | 5.3% |
| 15 | Syracuse | 146,384 | 3,266 | 49.0% | 25.7% | 10.2% | 7.2% |
| 16 | Albany | 100,492 | 3,322 | 50.1% | 24.6% | 11.0% | 7.7% |
| 17 | Freeport | 44,088 | 3,375 | 16.2% | 32.5% | 45.2% | 2.6% |
| 18 | Manorhaven | 6,958 | 3,384 | 43.0% | 0.8% | 30.1% | 25.1% |
| 19 | Utica | 64,217 | 3,422 | 53.2% | 15.4% | 14.5% | 11.2% |
| 20 | Newburgh | 28,519 | 3,498 | 21.9% | 24.4% | 49.1% | 0.5% |
| 21 | Nyack | 7,393 | 3,510 | 52.2% | 18.2% | 20.6% | 4.5% |
| 22 | Peekskill | 25,625 | 3,523 | 35.3% | 13.4% | 45.7% | 1.9% |
| 23 | Ossining | 26,950 | 3,563 | 33.1% | 10.7% | 48.2% | 4.0% |
| 24 | Monroe | 9,515 | 3,613 | 51.2% | 13.5% | 28.1% | 2.6% |
| 25 | Suffern | 11,441 | 3,655 | 54.5% | 16.0% | 19.8% | 5.7% |
| 26 | New Hyde Park | 10,220 | 3,670 | 48.9% | 1.9% | 9.4% | 34.2% |
| 27 | Great Neck Plaza | 7,593 | 3,700 | 53.3% | 0.7% | 15.8% | 24.0% |
| 28 | Elmsford | 5,186 | 3,822 | 18.7% | 13.4% | 56.7% | 8.3% |
| 29 | Mount Vernon | 72,427 | 3,898 | 13.5% | 56.9% | 21.3% | 1.9% |
| 30 | New Hempstead | 5,472 | 3,956 | 59.8% | 9.4% | 6.6% | 6.1% |
| 31 | Hempstead | 58,801 | 3,957 | 4.5% | 43.2% | 45.3% | 2.8% |
| 32 | Woodbury | 11,334 | 4,006 | 58.0% | 12.2% | 21.4% | 3.5% |
| 33 | Port Jervis | 8,652 | 4,007 | 58.2% | 7.6% | 22.3% | 4.3% |
| 34 | Washingtonville | 5,707 | 4,011 | 53.9% | 8.4% | 32.0% | 1.4% |
| 35 | Mamaroneck | 19,826 | 4,027 | 56.7% | 4.8% | 27.3% | 5.8% |
| 36 | Hudson | 5,865 | 4,045 | 60.4% | 12.8% | 10.3% | 10.2% |
| 37 | Glen Cove | 28,112 | 4,056 | 53.9% | 4.3% | 33.0% | 5.5% |
| 38 | Wappingers Falls | 5,761 | 4,068 | 55.0% | 7.3% | 31.2% | 2.7% |
| 39 | Amsterdam | 18,166 | 4,127 | 53.9% | 5.3% | 34.2% | 1.5% |
| 40 | Lynbrook | 20,325 | 4,141 | 59.7% | 7.7% | 21.0% | 8.4% |
| 41 | Troy | 51,033 | 4,194 | 61.4% | 15.5% | 10.3% | 3.9% |
| 42 | Pelham | 7,305 | 4,196 | 60.5% | 7.4% | 20.8% | 5.6% |
| 43 | West Haverstraw | 10,711 | 4,212 | 16.7% | 16.0% | 60.5% | 2.8% |
| 44 | Sleepy Hollow | 10,887 | 4,214 | 40.5% | 3.3% | 50.4% | 4.1% |
| 45 | Mount Kisco | 10,737 | 4,214 | 58.3% | 7.1% | 27.2% | 3.9% |
| 45 | Kingston | 23,911 | 4,214 | 61.2% | 12.7% | 15.9% | 3.0% |
| 47 | Port Chester | 31,102 | 4,286 | 29.9% | 7.9% | 57.6% | 2.3% |
| 48 | Mineola | 21,211 | 4,311 | 61.8% | 2.0% | 14.5% | 16.2% |
| 48 | Tuckahoe | 6,973 | 4,311 | 61.9% | 4.8% | 15.1% | 14.5% |
| 50 | Ithaca | 32,814 | 4,324 | 62.6% | 5.4% | 8.8% | 16.5% |
| 51 | Tarr | 11,784 | 4,343 | 61.8% | 5.1% | 20.6% | 6.6% |
| 52 | Beacon | 14,834 | 4,367 | 62.0% | 8.8% | 20.2% | 2.9% |
| 53 | New Paltz | 8,314 | 4,381 | 63.5% | 7.0% | 15.0% | 5.7% |
| 54 | Niagara Falls | 47,987 | 4,403 | 62.9% | 17.8% | 7.6% | 2.4% |
| 55 | Liberty | 5,142 | 4,438 | 38.2% | 4.5% | 54.4% | 0.6% |
| 56 | Dunkirk | 12,549 | 4,470 | 55.8% | 3.8% | 36.5% | 0.1% |
| 57 | Patchogue | 12,396 | 4,524 | 62.9% | 6.5% | 22.3% | 4.1% |
| 58 | Haverstraw | 12,325 | 4,539 | 18.5% | 13.8% | 63.2% | 2.7% |
| 59 | Binghamton | 47,151 | 4,542 | 64.9% | 13.0% | 9.5% | 6.8% |
| 60 | Scarsdale | 18,010 | 4,585 | 63.8% | 1.8% | 4.6% | 20.3% |
| 61 | Malverne | 8,477 | 4,620 | 64.2% | 4.2% | 20.5% | 5.9% |
| 62 | Salamanca | 5,846 | 4,624 | 64.8% | 1.9% | 6.5% | 0.1% |
| 63 | Rensselaer | 9,287 | 4,712 | 66.6% | 8.0% | 8.0% | 10.3% |
| 64 | Lackawanna | 19,753 | 4,836 | 66.7% | 15.2% | 11.7% | 1.6% |
| 65 | Dobbs Ferry | 11,443 | 4,876 | 67.4% | 2.4% | 12.5% | 12.2% |
| 66 | Williston Park | 7,542 | 4,941 | 66.9% | 1.0% | 13.9% | 16.6% |
| 67 | Floral Park | 16,169 | 4,963 | 67.5% | 1.4% | 14.5% | 13.5% |
| 68 | Harrison | 29,961 | 4,970 | 67.9% | 3.8% | 16.7% | 7.8% |
| 69 | Johnson City | 14,940 | 5,078 | 69.4% | 7.4% | 4.0% | 11.8% |
| 70 | Great Neck | 11,087 | 5,080 | 69.1% | 3.0% | 10.2% | 13.4% |
| 71 | Elmira | 26,257 | 5,128 | 69.4% | 14.8% | 7.4% | 1.3% |
| 72 | Endicott | 13,387 | 5,148 | 69.8% | 10.1% | 11.7% | 2.1% |
| 73 | Geneva | 12,512 | 5,186 | 69.7% | 8.7% | 15.4% | 2.5% |
| 74 | Irvington | 6,531 | 5,263 | 70.8% | 1.7% | 13.1% | 6.8% |
| 75 | North Hills | 5,415 | 5,357 | 67.2% | 0.8% | 0.4% | 28.9% |
| 76 | Lake Grove | 11,061 | 5,373 | 71.4% | 1.4% | 11.7% | 11.0% |
| 77 | Briarcliff Manor | 7,519 | 5,424 | 72.0% | 1.4% | 10.0% | 9.9% |
| 78 | Lindenhurst | 27,142 | 5,460 | 70.9% | 4.6% | 20.0% | 2.7% |
| 79 | Long Beach | 34,756 | 5,493 | 72.3% | 2.6% | 14.1% | 4.5% |
| 80 | Cohoes | 18,159 | 5,656 | 74.0% | 7.5% | 8.4% | 2.5% |
| 81 | Farmingdale | 8,474 | 5,671 | 73.1% | 2.8% | 16.8% | 5.6% |
| 82 | Amityville | 9,588 | 5,691 | 73.0% | 3.3% | 18.1% | 0.8% |
| 83 | Pelham Manor | 5,644 | 5,709 | 74.5% | 3.4% | 8.6% | 7.8% |
| 84 | Goshen | 5,773 | 5,717 | 73.1% | 1.0% | 18.7% | 3.8% |
| 85 | Watervliet | 10,287 | 5,752 | 74.5% | 9.4% | 9.3% | 1.8% |
| 86 | Chestnut Ridge | 10,557 | 5,783 | 74.8% | 8.1% | 10.3% | 1.6% |
| 87 | Rye Brook | 9,900 | 5,920 | 75.7% | 0.8% | 8.9% | 10.1% |
| 88 | Rye | 16,428 | 5,985 | 76.4% | 2.1% | 7.0% | 6.8% |
| 89 | Albion | 5,506 | 5,994 | 76.2% | 6.3% | 10.6% | 0.0% |
| 90 | Cedarhurst | 7,320 | 6,026 | 75.9% | 2.1% | 15.4% | 0.0% |
| 91 | Rockville Centre | 25,765 | 6,084 | 77.0% | 4.9% | 9.6% | 5.6% |
| 92 | Fredonia | 9,467 | 6,226 | 77.8% | 4.1% | 12.3% | 2.3% |
| 93 | Watertown | 24,375 | 6,261 | 78.3% | 4.5% | 7.1% | 2.1% |
| 94 | Lockport | 20,610 | 6,270 | 78.2% | 10.4% | 4.9% | 0.4% |
| 95 | East Hills | 7,257 | 6,278 | 77.9% | 0.6% | 8.2% | 11.5% |
| 96 | Bronxville | 6,510 | 6,285 | 78.2% | 0.5% | 10.1% | 5.6% |
| 97 | Brockport | 7,277 | 6,292 | 78.5% | 8.2% | 6.7% | 3.2% |
| 98 | Port Jefferson | 8,091 | 6,295 | 78.3% | 0.4% | 10.5% | 6.4% |
| 99 | Newark | 8,991 | 6,374 | 78.8% | 4.2% | 11.1% | 0.5% |
| 99 | Croton-on-Hudson | 8,202 | 6,375 | 78.7% | 1.8% | 12.3% | 3.1% |
Source: U.S. Census ACS 2020-2024. 168 cities with more than 5,000 residents.
Summary
Summary: Diversity Across New York
If you’re looking for a scientific breakdown of diversity across New York, this is an accurate list.
The most diverse cities in New York are Valley Stream, New York, Westbury, Poughkeepsie, Monticello, Schenectady, Rochester, Spring Valley, New Rochelle, and Buffalo.


