Before you decide to relocate to Washington, it’s important to research the exact cost of living around the state. And that’s what we’re going to help you do.
These are the places in Washington that cost a pretty penny — the most expensive cities in the state.
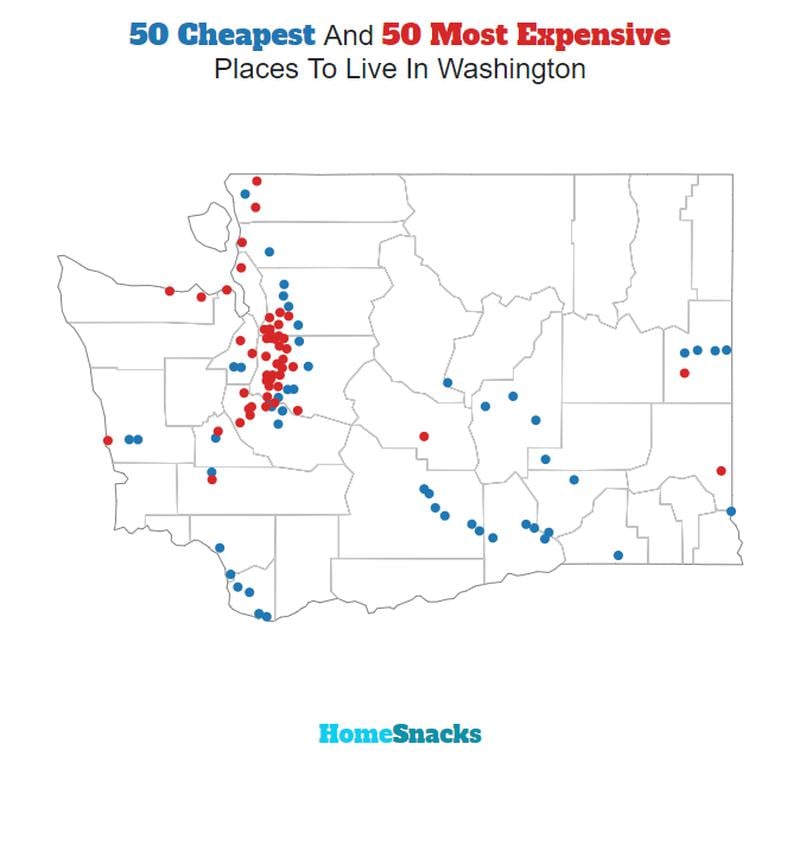
We used Saturday Night Science to compare the 2020-2024 American Community Survey on cost of living for the 122 places in Washington with more than 5,000 people.
After we saved up for months and could finally afford it, we landed on this list of the ten most expensive cities in Washington for 2026.
Table Of Contents: Top Ten | Methodology | Summary | Table
The 10 Most Expensive Places To Live In Washington For 2026
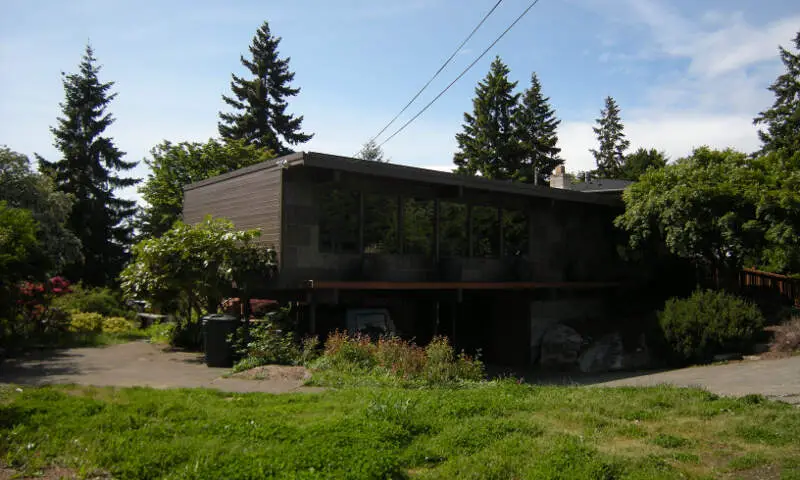
What’s the most expensive place to live in Washington? Well, HomeSnacks crunched the numbers and discovered that Mercer Island is the most expensive place to live in Washington.
Clarkston (the cheapest place to live in Washington) can show these guys how to live on a budget in the coming years. Read on for how these places had costs rise faster than inflation.
And if you already knew these places were expensive, check out some more reading about Washington and the most expensive cities in the country:
The 10 Most Expensive Places To Live In Washington For 2026

/10
Population: 25,307
Cost Of Living Index: 266
Median Income: $219,069
Average Home Price: $2,326,984
Home Price To Income Ratio: 10.6x
More on Mercer Island: Data | Crime | Cost Of Living | Movers
The overall cost of living in Mercer Island is 266. The median income in Mercer Island comes in at $219,069 and the average home value is $2,326,984 for 2026.

/10
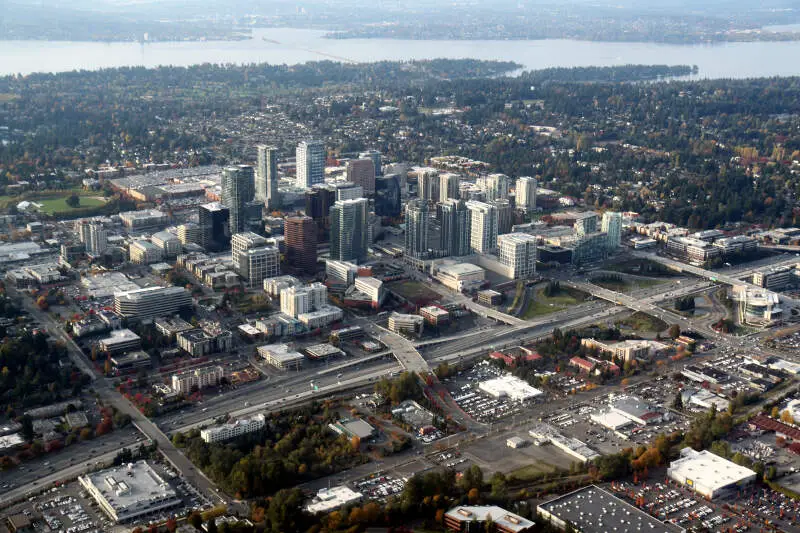
Population: 151,847
Cost Of Living Index: 202
Median Income: $165,576
Average Home Price: $1,516,153
Home Price To Income Ratio: 9.2x
More on Bellevue: Data | Crime | Cost Of Living | Movers
The overall cost of living in Bellevue is 202. The median income in Bellevue comes in at $165,576 and the average home value is $1,516,153 for 2026.

/10
Population: 66,463
Cost Of Living Index: 202
Median Income: $239,690
Average Home Price: $1,627,993
Home Price To Income Ratio: 6.8x
More on Sammamish: Data | Crime | Cost Of Living | Movers
The overall cost of living in Sammamish is 202. The median income in Sammamish comes in at $239,690 and the average home value is $1,627,993 for 2026.

/10
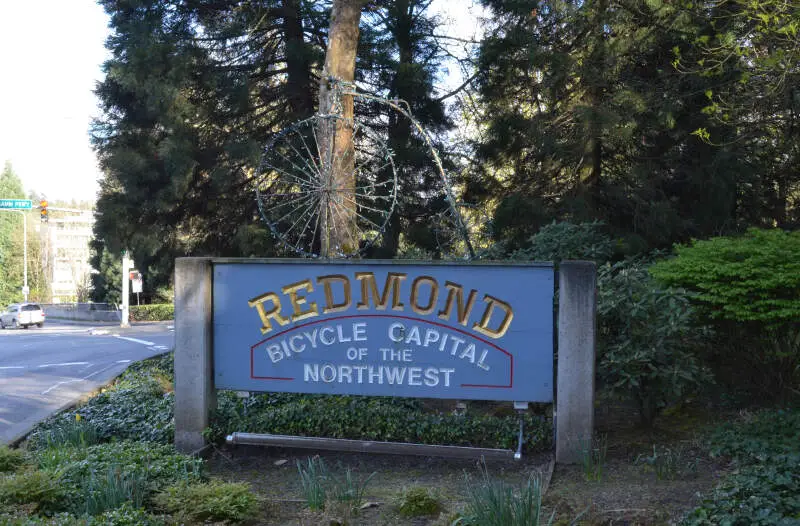
Population: 77,353
Cost Of Living Index: 191
Median Income: $162,560
Average Home Price: $1,402,276
Home Price To Income Ratio: 8.6x
More on Redmond: Data | Crime | Cost Of Living | Movers
The overall cost of living in Redmond is 191. The median income in Redmond comes in at $162,560 and the average home value is $1,402,276 for 2026.

/10
Population: 12,989
Cost Of Living Index: 188
Median Income: $160,278
Average Home Price: $1,424,187
Home Price To Income Ratio: 8.9x
More on Newcastle: Data | Crime | Cost Of Living | Movers
The overall cost of living in Newcastle is 188. The median income in Newcastle comes in at $160,278 and the average home value is $1,424,187 for 2026.

/10
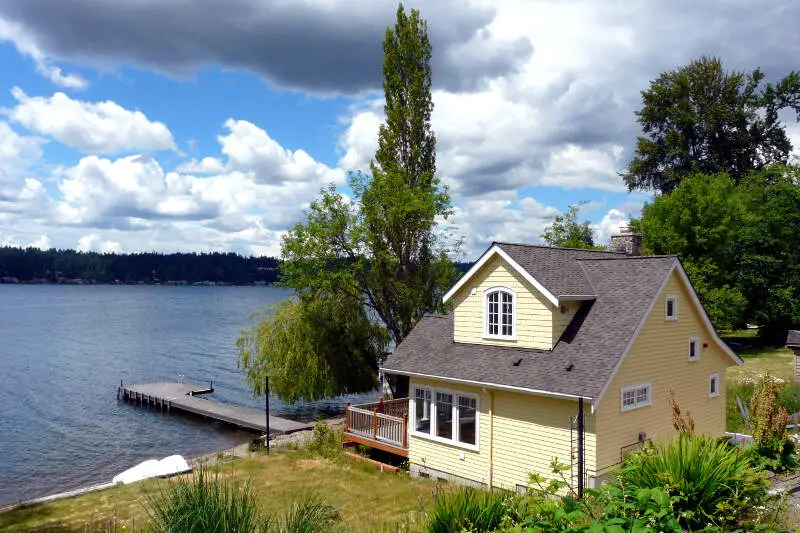
Population: 24,631
Cost Of Living Index: 186
Median Income: $172,188
Average Home Price: $1,173,702
Home Price To Income Ratio: 6.8x
More on Bainbridge Island: Data | Crime | Cost Of Living | Movers
The overall cost of living in Bainbridge Island is 186. The median income in Bainbridge Island comes in at $172,188 and the average home value is $1,173,702 for 2026.

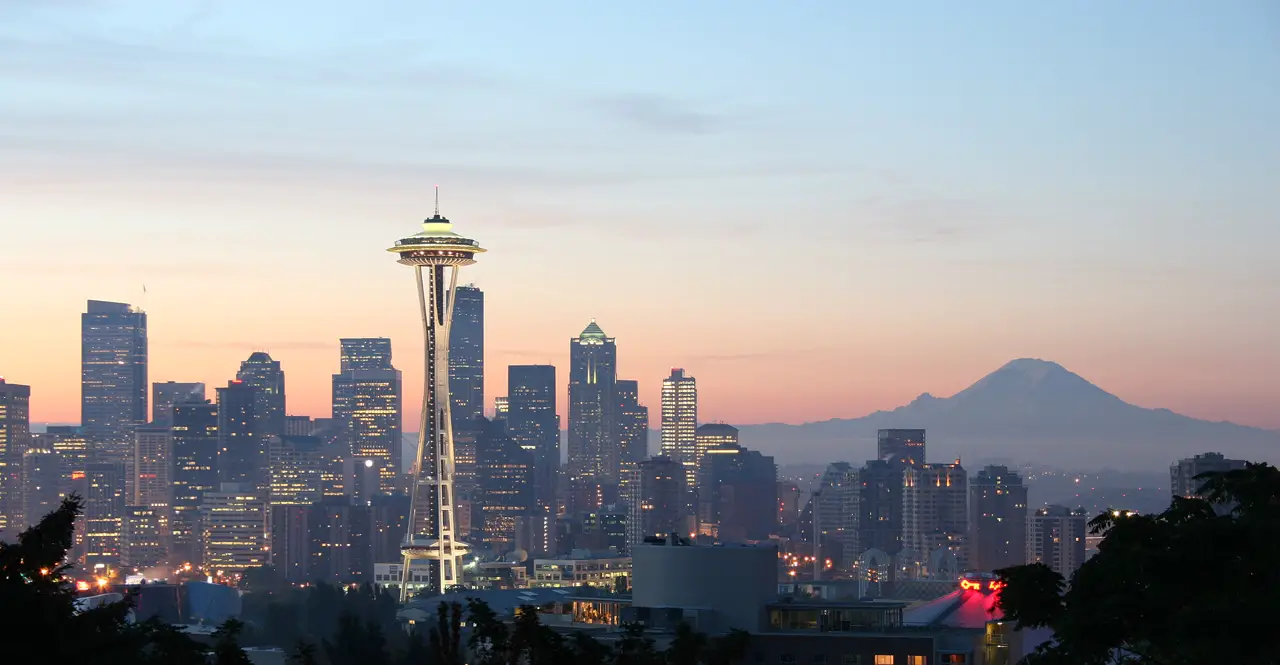
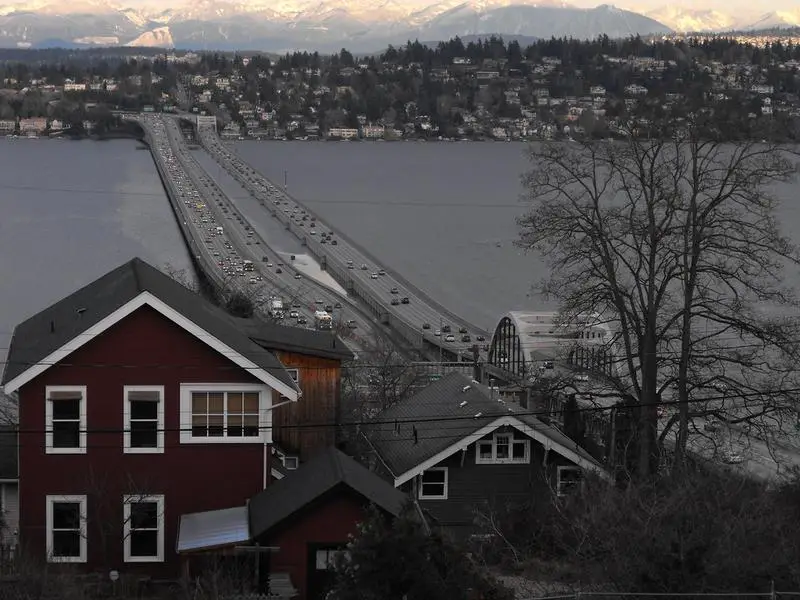
/10
Population: 754,195
Cost Of Living Index: 181
Median Income: $123,860
Average Home Price: $868,680
Home Price To Income Ratio: 7.0x
More on Seattle: Data | Crime | Cost Of Living | Movers
The overall cost of living in Seattle is 181. The median income in Seattle comes in at $123,860 and the average home value is $868,680 for 2026.

/10
Population: 92,621
Cost Of Living Index: 180
Median Income: $150,414
Average Home Price: $1,265,787
Home Price To Income Ratio: 8.4x
More on Kirkland: Data | Crime | Cost Of Living | Movers
The overall cost of living in Kirkland is 180. The median income in Kirkland comes in at $150,414 and the average home value is $1,265,787 for 2026.

/10
Population: 6,659
Cost Of Living Index: 175
Median Income: $162,476
Average Home Price: $1,050,868
Home Price To Income Ratio: 6.5x
More on Normandy Park: Data | Crime | Cost Of Living | Movers
The overall cost of living in Normandy Park is 175. The median income in Normandy Park comes in at $162,476 and the average home value is $1,050,868 for 2026.

/10
Population: 13,335
Cost Of Living Index: 174
Median Income: $159,904
Average Home Price: $1,054,029
Home Price To Income Ratio: 6.6x
More on Lake Forest Park: Data | Crime | Cost Of Living | Movers
The overall cost of living in Lake Forest Park is 174. The median income in Lake Forest Park comes in at $159,904 and the average home value is $1,054,029 for 2026.
Methodology: How We Determined The Most Expensive Places To Live In The Evergreen State For 2026
The two most important things to think about when it comes to being able to afford a city in Washington are:
- How much money do I make?
- How much do I have to spend to live there?
You need to understand your costs in the context of how much money you make.
For example, if the median household earns $100,000 and spends $40,000 on housing, it’s actually cheaper to live there than a place with a median income of $50,000 and housing costs of $21,000. You might spend more on housing, but you have more money overall to play with.
With that example in mind, we derived several statistics from the latest Census American Community Survey 2020-2024 around incomes and costs. They are:
- Overall Cost Of Living Index
- Median Home Price / Median Income (lower is better)
- Median Income / Median Rent (Higher is better)
- Median Home Price
You can then compare these metrics in each of the places in Washington to figure out which is the most expensive.
You are left with a “Cost of Living Index” by taking the average rank of each of these metrics for each city.
So we used that cost of living index to rank all of the 122 places in Washington that have more than 5,000 people.
The place with the highest cost of living in Washington according to the data is Mercer Island. We updated this article for 2026. This article is our eleventh time ranking the most expensive places to live in Washington.
Summary: Taking A Chunk Out Of Your Paycheck In Washington For 2026
Well, there you have it, the places in Washington that have the highest cost of living, with Mercer Island ranking as the most expensive city in the Evergreen State.
The most expensive cities in Washington are Mercer Island, Bellevue, Sammamish, Redmond, Newcastle, Bainbridge Island, Seattle, Kirkland, Normandy Park, and Lake Forest Park.
Here’s a look at the most affordable cities in Washington according to the data:
- Clarkston
- Omak
- Toppenish
For more Washington reading, check out:
- Best Places To Live In Washington
- Cheapest Places To Live In Washington
- Most Dangerous Cities In Washington
- Best Places To Raise A Family In Washington
- Safest Places In Washington
- Worst Places To Live In Washington
Most Expensive Cities In Washington
| Rank | City | Cost Of Living | Population | Median Income | Average Home Price | Home/Income Ratio |
|---|---|---|---|---|---|---|
| 1 | Mercer Island | 266 | 25,307 | $219,069 | $2,326,984 | 10.6x |
| 2 | Bellevue | 202 | 151,847 | $165,576 | $1,516,153 | 9.2x |
| 3 | Sammamish | 202 | 66,463 | $239,690 | $1,627,993 | 6.8x |
| 4 | Redmond | 191 | 77,353 | $162,560 | $1,402,276 | 8.6x |
| 5 | Newcastle | 188 | 12,989 | $160,278 | $1,424,187 | 8.9x |
| 6 | Bainbridge Island | 186 | 24,631 | $172,188 | $1,173,702 | 6.8x |
| 7 | Seattle | 181 | 754,195 | $123,860 | $868,680 | 7.0x |
| 8 | Kirkland | 180 | 92,621 | $150,414 | $1,265,787 | 8.4x |
| 9 | Normandy Park | 175 | 6,659 | $162,476 | $1,050,868 | 6.5x |
| 10 | Lake Forest Park | 174 | 13,335 | $159,904 | $1,054,029 | 6.6x |
| 11 | Issaquah | 173 | 39,591 | $154,669 | $1,158,594 | 7.5x |
| 12 | Woodinville | 172 | 13,438 | $164,398 | $1,390,134 | 8.5x |
| 13 | Snoqualmie | 170 | 13,798 | $214,107 | $1,122,656 | 5.2x |
| 14 | Brier | 167 | 6,545 | $132,045 | $1,012,104 | 7.7x |
| 15 | Mukilteo | 166 | 21,323 | $132,861 | $933,198 | 7.0x |
| 16 | Duvall | 166 | 8,526 | $197,361 | $980,302 | 5.0x |
| 17 | Mill Creek | 164 | 20,956 | $124,364 | $981,773 | 7.9x |
| 18 | Bothell | 162 | 49,610 | $140,427 | $1,061,138 | 7.6x |
| 19 | Shoreline | 161 | 61,431 | $112,751 | $831,856 | 7.4x |
| 20 | North Bend | 161 | 7,953 | $175,109 | $1,008,581 | 5.8x |
| 21 | Edmonds | 160 | 42,735 | $122,449 | $942,130 | 7.7x |
| 22 | Kenmore | 160 | 23,741 | $139,764 | $1,046,651 | 7.5x |
| 23 | Gig Harbor | 151 | 12,424 | $118,395 | $820,740 | 6.9x |
| 24 | Black Diamond | 149 | 5,961 | $141,383 | $776,133 | 5.5x |
| 25 | Maple Valley | 148 | 28,287 | $152,885 | $799,653 | 5.2x |
| 26 | Renton | 146 | 105,317 | $100,432 | $764,374 | 7.6x |
| 27 | Ridgefield | 141 | 13,408 | $116,389 | $665,863 | 5.7x |
| 28 | Burien | 140 | 51,513 | $91,318 | $650,468 | 7.1x |
| 29 | Camas | 140 | 27,007 | $141,126 | $751,542 | 5.3x |
| 30 | Covington | 140 | 21,233 | $134,502 | $678,607 | 5.0x |
| 31 | Mountlake Terrace | 139 | 23,104 | $107,687 | $699,078 | 6.5x |
| 32 | Bellingham | 138 | 93,438 | $66,755 | $668,589 | 10.0x |
| 33 | Lynnwood | 138 | 40,110 | $77,704 | $784,106 | 10.1x |
| 34 | Anacortes | 138 | 17,966 | $91,951 | $725,455 | 7.9x |
| 35 | Bonney Lake | 137 | 22,090 | $136,845 | $676,347 | 4.9x |
| 36 | Lake Stevens | 136 | 40,253 | $122,336 | $705,681 | 5.8x |
| 37 | Monroe | 136 | 19,755 | $110,461 | $733,030 | 6.6x |
| 38 | Edgewood | 136 | 13,032 | $116,132 | $737,911 | 6.4x |
| 39 | Steilacoom | 136 | 6,686 | $100,851 | $640,510 | 6.4x |
| 40 | Poulsbo | 135 | 12,165 | $116,250 | $665,803 | 5.7x |
| 41 | Buckley | 135 | 5,371 | $124,583 | $657,837 | 5.3x |
| 42 | Des Moines | 134 | 32,823 | $92,483 | $612,731 | 6.6x |
| 43 | Kent | 133 | 135,603 | $92,302 | $656,313 | 7.1x |
| 44 | Federal Way | 133 | 99,493 | $86,909 | $601,744 | 6.9x |
| 45 | Auburn | 133 | 85,676 | $97,884 | $614,182 | 6.3x |
| 46 | University Place | 133 | 34,911 | $99,031 | $661,409 | 6.7x |
| 47 | Lynden | 133 | 16,234 | $103,233 | $625,493 | 6.1x |
| 48 | Everett | 132 | 111,845 | $83,512 | $662,785 | 7.9x |
| 49 | Marysville | 132 | 73,002 | $103,974 | $634,695 | 6.1x |
| 50 | Port Orchard | 131 | 17,149 | $89,795 | $556,427 | 6.2x |
| 51 | Snohomish | 131 | 10,239 | $87,250 | $939,009 | 10.8x |
| 52 | DuPont | 131 | 9,931 | $120,781 | $621,241 | 5.1x |
| 53 | Stanwood | 131 | 8,373 | $90,242 | $715,578 | 7.9x |
| 54 | Milton | 130 | 8,894 | $96,540 | $572,123 | 5.9x |
| 55 | Arlington | 129 | 21,095 | $88,231 | $669,005 | 7.6x |
| 56 | Sumner | 129 | 10,733 | $98,191 | $593,647 | 6.0x |
| 57 | Vancouver | 128 | 195,300 | $81,338 | $509,318 | 6.3x |
| 58 | Puyallup | 128 | 42,746 | $97,826 | $570,441 | 5.8x |
| 59 | SeaTac | 128 | 32,414 | $81,104 | $553,220 | 6.8x |
| 60 | Ferndale | 128 | 15,999 | $87,579 | $616,286 | 7.0x |
| 61 | Orting | 128 | 8,978 | $132,877 | $560,310 | 4.2x |
| 62 | Fircrest | 128 | 7,069 | $113,926 | $623,545 | 5.5x |
| 63 | Tumwater | 127 | 26,956 | $95,212 | $526,057 | 5.5x |
| 64 | Tukwila | 127 | 21,451 | $78,381 | $575,995 | 7.3x |
| 65 | Washougal | 127 | 17,490 | $106,368 | $640,871 | 6.0x |
| 66 | Enumclaw | 127 | 12,798 | $121,250 | $680,130 | 5.6x |
| 67 | Liberty Lake | 127 | 12,737 | $118,723 | $558,763 | 4.7x |
| 68 | Fife | 127 | 10,949 | $90,532 | $557,638 | 6.2x |
| 69 | Tacoma | 126 | 222,758 | $85,884 | $493,839 | 5.8x |
| 70 | Battle Ground | 126 | 21,886 | $104,977 | $606,387 | 5.8x |
| 71 | Pacific | 126 | 7,066 | $115,625 | $561,715 | 4.9x |
| 72 | Blaine | 126 | 6,100 | $84,030 | $541,720 | 6.4x |
| 73 | Olympia | 125 | 55,951 | $81,302 | $533,713 | 6.6x |
| 74 | Port Townsend | 125 | 10,438 | $62,606 | $633,222 | 10.1x |
| 75 | Lakewood | 124 | 62,937 | $74,720 | $521,148 | 7.0x |
| 76 | Lacey | 124 | 57,737 | $90,625 | $516,096 | 5.7x |
| 77 | Oak Harbor | 124 | 24,362 | $76,084 | $528,587 | 6.9x |
| 78 | Sultan | 124 | 6,116 | $94,730 | $564,591 | 6.0x |
| 79 | West Richland | 122 | 17,586 | $119,892 | $493,161 | 4.1x |
| 80 | Richland | 121 | 62,753 | $95,813 | $466,467 | 4.9x |
| 81 | Sedro-Woolley | 121 | 12,831 | $80,885 | $497,458 | 6.2x |
| 82 | Yelm | 121 | 11,102 | $90,750 | $489,021 | 5.4x |
| 83 | Bremerton | 120 | 44,830 | $74,940 | $483,131 | 6.4x |
| 84 | Mount Vernon | 119 | 35,377 | $75,777 | $586,879 | 7.7x |
| 85 | Pullman | 119 | 32,229 | $46,812 | $423,692 | 9.1x |
| 86 | East Wenatchee | 119 | 14,199 | $77,558 | $510,449 | 6.6x |
| 87 | Ellensburg | 118 | 20,874 | $55,438 | $453,797 | 8.2x |
| 88 | Burlington | 118 | 10,003 | $80,475 | $539,012 | 6.7x |
| 89 | Selah | 117 | 8,437 | $74,783 | $436,782 | 5.8x |
| 90 | Woodland | 117 | 6,487 | $81,193 | $589,005 | 7.3x |
| 91 | Kennewick | 116 | 85,295 | $73,576 | $430,870 | 5.9x |
| 92 | Wenatchee | 115 | 35,484 | $73,040 | $491,477 | 6.7x |
| 93 | Ocean Shores | 114 | 7,302 | $58,202 | $338,335 | 5.8x |
| 94 | Spokane Valley | 113 | 106,365 | $74,042 | $408,887 | 5.5x |
| 95 | Port Angeles | 113 | 20,118 | $62,606 | $450,576 | 7.2x |
| 96 | Pasco | 112 | 79,575 | $85,586 | $418,088 | 4.9x |
| 97 | Cheney | 111 | 12,804 | $54,503 | $420,133 | 7.7x |
| 98 | Airway Heights | 110 | 11,245 | $62,874 | $372,868 | 5.9x |
| 99 | College Place | 110 | 9,854 | $61,914 | $404,141 | 6.5x |
| 100 | Chehalis | 110 | 7,587 | $73,702 | $478,650 | 6.5x |


