Most Hispanic/Latino cities in Michigan research summary. We used Saturday Night Science to analyze Michigan’s most recent Census data to determine the most Hispanic/Latino cities based on the percentage of Hispanic/Latino residents. Here are the results of our analysis:
-
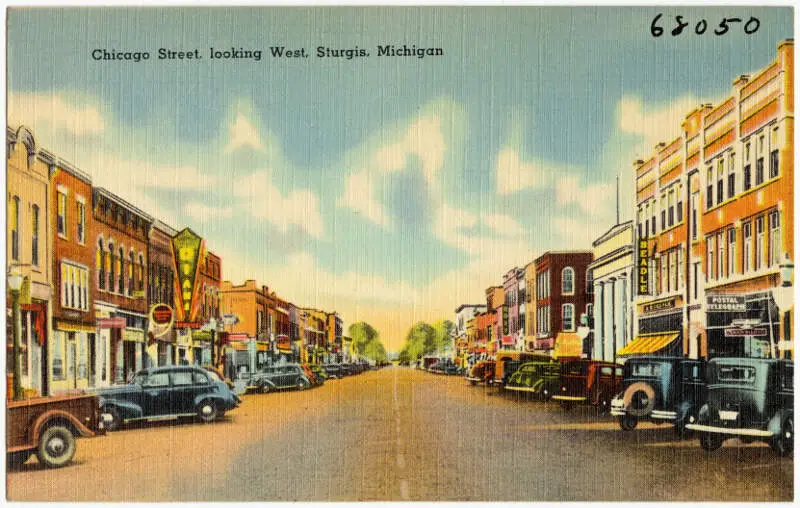
The most Hispanic/Latino city in Michigan is Sturgis, based on the most recent Census data.
-
Sturgis is 27.3% Hispanic/Latino.
-
The least Hispanic/Latino city in Michigan is Gladstone.
-
Gladstone is 0.42% Hispanic/Latino.
-
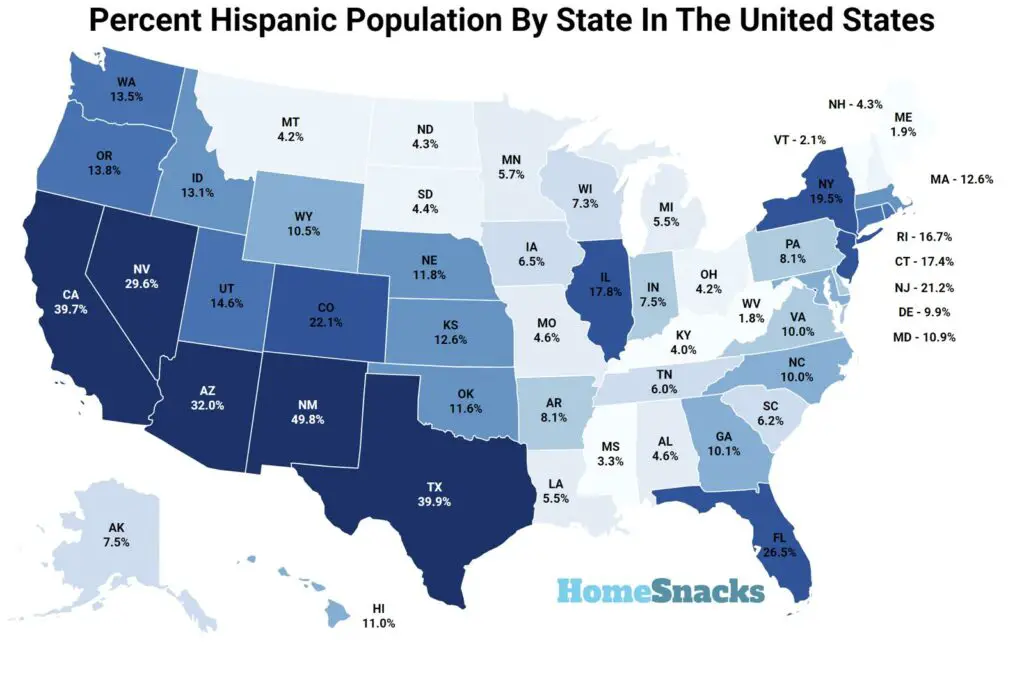
Michigan is 5.9% Hispanic/Latino.
-
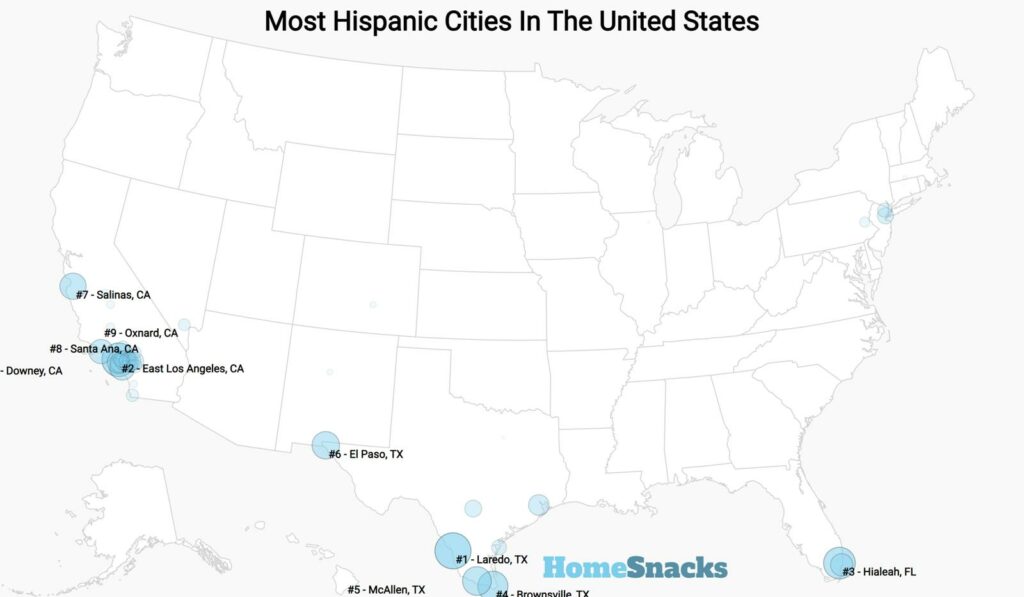
Michigan is the 38th most Hispanic/Latino state in the United States.
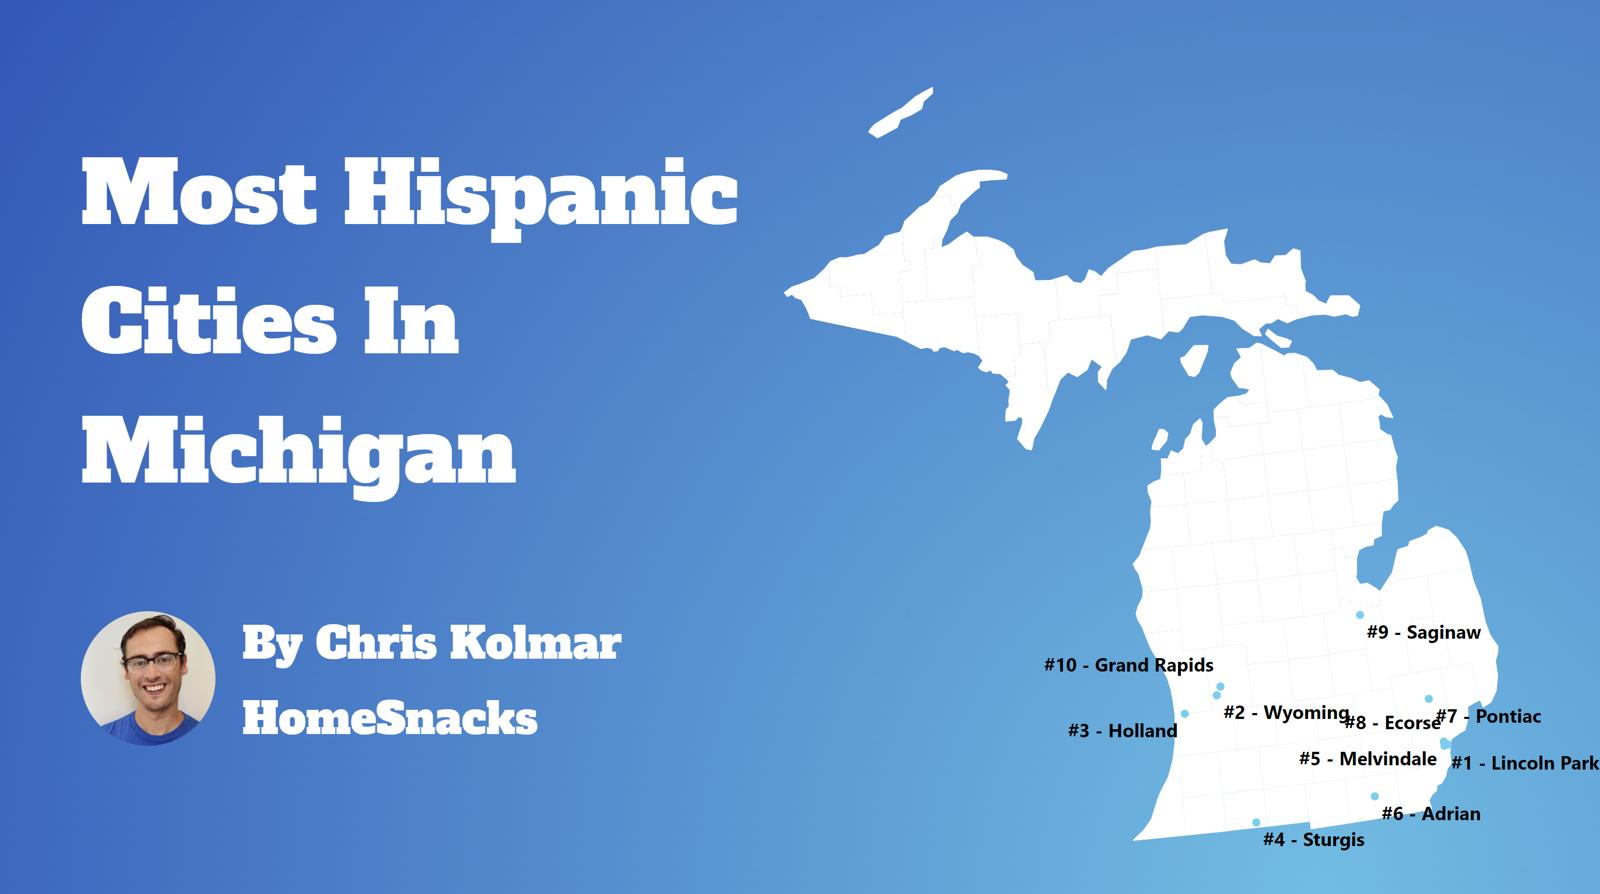
Table Of Contents: Top Ten | Methodology | Summary | Table
The 10 Cities In Michigan With The Largest Hispanic Population For 2026
What’s the city in Michigan with the largest Hispanic/Latino population? Sturgis took the number one overall spot for the largest Hispanic population in Michigan for 2026.
Continue below to see how we crunched the numbers and how your town ranked.
To see where Michigan ranked as a state on diversity, we have a ranking of the most diverse states in America.
And if you already knew these places were Hispanic, check out the best places to live in Michigan or the safest places in Michigan.

/10
Population: 11,054
# Of Hispanic/Latino Residents: 3,018
% Hispanic/Latino: 27.3%
More on Sturgis: Data | Crime | Cost Of Living | Movers

/10
Population: 12,554
# Of Hispanic/Latino Residents: 3,324
% Hispanic/Latino: 26.48%
More on Melvindale: Data | Crime | Cost Of Living | Movers

/10
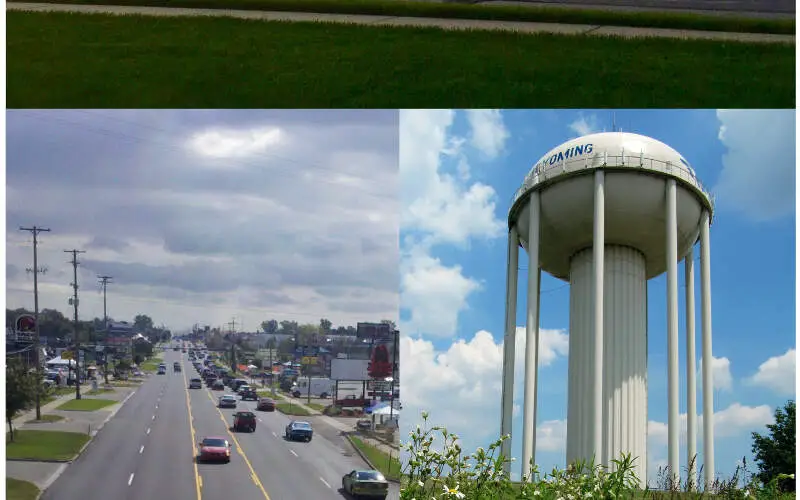
Population: 77,353
# Of Hispanic/Latino Residents: 20,471
% Hispanic/Latino: 26.46%
More on Wyoming: Data | Crime | Cost Of Living | Movers


/10
Population: 39,257
# Of Hispanic/Latino Residents: 10,283
% Hispanic/Latino: 26.19%
More on Lincoln Park: Data | Crime | Cost Of Living | Movers

/10
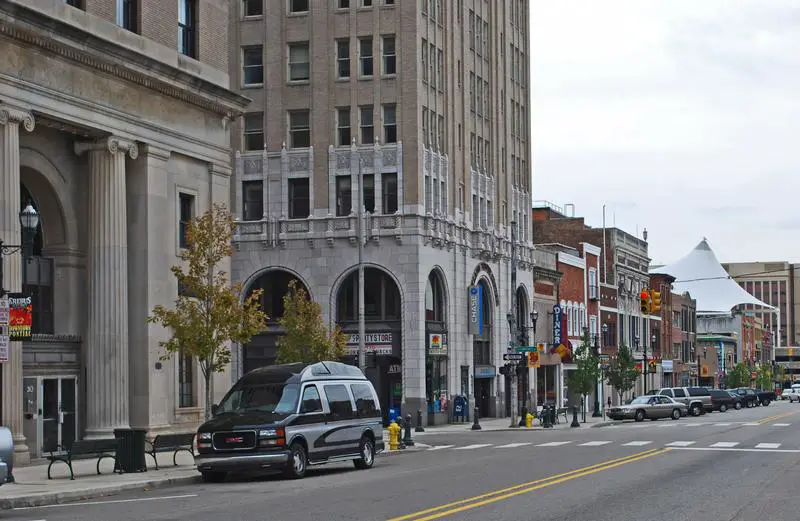
Population: 62,104
# Of Hispanic/Latino Residents: 14,941
% Hispanic/Latino: 24.06%
More on Pontiac: Data | Crime | Cost Of Living | Movers

/10
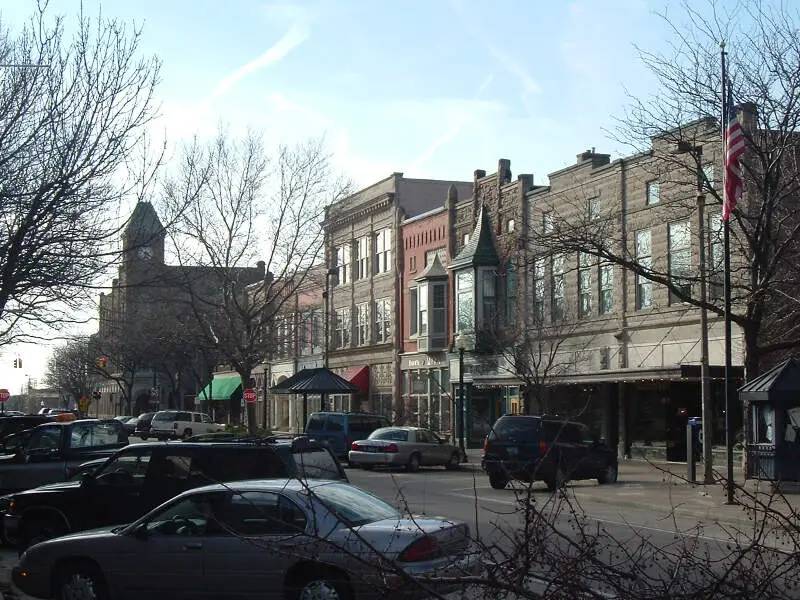
Population: 34,423
# Of Hispanic/Latino Residents: 8,109
% Hispanic/Latino: 23.56%
More on Holland: Data | Crime | Cost Of Living | Movers

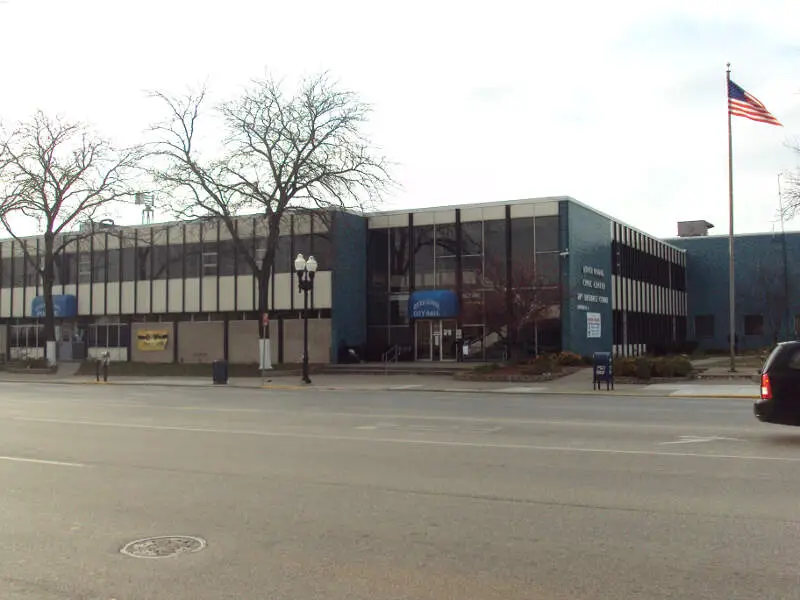
/10
Population: 20,395
# Of Hispanic/Latino Residents: 4,220
% Hispanic/Latino: 20.69%
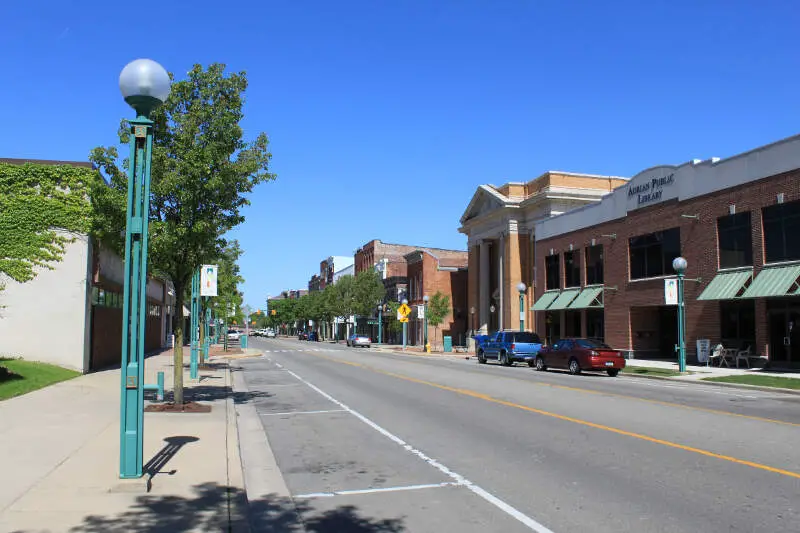
More on Adrian: Data | Crime | Cost Of Living | Movers

/10
Population: 7,008
# Of Hispanic/Latino Residents: 1,189
% Hispanic/Latino: 16.97%
More on River Rouge: Data | Crime | Cost Of Living | Movers

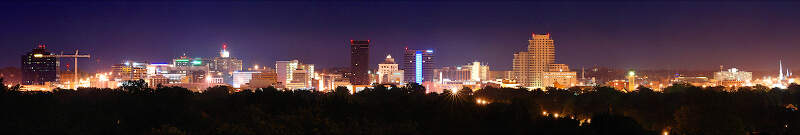
/10
Population: 198,535
# Of Hispanic/Latino Residents: 32,415
% Hispanic/Latino: 16.33%
More on Grand Rapids: Data | Crime | Cost Of Living | Movers

/10
Population: 5,665
# Of Hispanic/Latino Residents: 912
% Hispanic/Latino: 16.1%
More on Zeeland: Data | Crime | Cost Of Living | Movers
Methodology: How We Determined The Cities In Michigan With The Largest Hispanic Population For 2026
We used Saturday Night Science to compare data on race from the US Census for every city in Michigan.
Michigan’s most recently available data comes from the 2020-2024 American Community Survey.
Specifically, we looked at table B03002: Hispanic OR LATINO ORIGIN BY RACE. Here are the category names as defined by the Census:
- Hispanic or Latino
- White alone*
- Black or African American alone*
- American Indian and Alaska Native alone*
- Asian alone*
- Native Hawaiian and Other Pacific Islander alone*
- Some other race alone*
- Two or more races*
Our particular column of interest here was the number of people who identified as Hispanic or Latino.
We limited our analysis to places in Michigan with a population greater than 5,000 people. That left us with 147 cities.
We then calculated the percentage of Hispanic or Latino residents in each Michigan city. The percentages ranked from 27.3% to 0.4%.
Finally, we ranked each city based on the percentage of the Hispanic or Latino population, with a higher score being more Hispanic or Latino than a lower score. Sturgis was the most Hispanic or Latino, while Gladstone was the least Hispanic or Latino city.
We updated this article for 2026. This article represents our eleventh time ranking the cities in Michigan with the largest Hispanic/Latino population.
Read on for more information on how the cities in Michigan ranked by population of Hispanic or Latino residents or, for a more general take on diversity in America, head over to our ranking of the most diverse cities in America.
Summary: Hispanic or Latino Populations Across Michigan
According to the most recent data, this is an accurate list if you’re looking for a breakdown of Latino populations for each place across Michigan.
The most Hispanic/Latino cities in Michigan are Sturgis, Melvindale, Wyoming, Lincoln Park, Pontiac, Holland, Adrian, River Rouge, Grand Rapids, and Zeeland.
If you’re curious enough, here are the least Hispanic or Latino places in Michigan:
- Gladstone
- Kingsford
- Hamtramck
For more Michigan reading, check out:
Most Hispanic Cities In Michigan
| Rank | City | Population | Hispanic Pop. | % Hispanic |
|---|---|---|---|---|
| 1 | Sturgis | 11,054 | 3,018 | 27.3% |
| 2 | Melvindale | 12,554 | 3,324 | 26.48% |
| 3 | Wyoming | 77,353 | 20,471 | 26.46% |
| 4 | Lincoln Park | 39,257 | 10,283 | 26.19% |
| 5 | Pontiac | 62,104 | 14,941 | 24.06% |
| 6 | Holland | 34,423 | 8,109 | 23.56% |
| 7 | Adrian | 20,395 | 4,220 | 20.69% |
| 8 | River Rouge | 7,008 | 1,189 | 16.97% |
| 9 | Grand Rapids | 198,535 | 32,415 | 16.33% |
| 10 | Zeeland | 5,665 | 912 | 16.1% |
| 11 | Saginaw | 43,536 | 6,910 | 15.87% |
| 12 | Ecorse | 9,064 | 1,404 | 15.49% |
| 13 | Allen Park | 27,925 | 3,664 | 13.12% |
| 14 | Alma | 9,396 | 1,216 | 12.94% |
| 15 | Lansing | 113,023 | 14,574 | 12.89% |
| 16 | Auburn Hills | 25,105 | 3,106 | 12.37% |
| 17 | Bay City | 32,320 | 3,706 | 11.47% |
| 18 | Woodhaven | 12,690 | 1,404 | 11.06% |
| 19 | Kentwood | 54,296 | 5,586 | 10.29% |
| 20 | Muskegon | 37,226 | 3,693 | 9.92% |
| 21 | Southgate | 29,366 | 2,750 | 9.36% |
| 22 | Dowagiac | 5,732 | 529 | 9.23% |
| 23 | Riverview | 12,186 | 1,118 | 9.17% |
| 24 | Ionia | 12,753 | 1,150 | 9.02% |
| 25 | Ypsilanti | 19,857 | 1,784 | 8.98% |
| 26 | Howell | 10,021 | 866 | 8.64% |
| 27 | St. Louis | 7,367 | 619 | 8.4% |
| 28 | Detroit | 638,530 | 53,262 | 8.34% |
| 29 | Battle Creek | 52,374 | 4,363 | 8.33% |
| 30 | Belding | 5,960 | 485 | 8.14% |
| 31 | Wyandotte | 24,489 | 1,940 | 7.92% |
| 32 | Kalamazoo | 73,076 | 5,698 | 7.8% |
| 33 | Taylor | 62,081 | 4,734 | 7.63% |
| 34 | Coldwater | 13,671 | 1,038 | 7.59% |
| 35 | Flat Rock | 10,340 | 767 | 7.42% |
| 36 | Albion | 7,560 | 554 | 7.33% |
| 37 | Greenville | 8,995 | 659 | 7.33% |
| 38 | Tecumseh | 8,646 | 625 | 7.23% |
| 39 | Niles | 11,803 | 823 | 6.97% |
| 40 | Jackson | 31,058 | 2,126 | 6.85% |
| 41 | Three Rivers | 7,943 | 529 | 6.66% |
| 42 | East Lansing | 45,758 | 3,008 | 6.57% |
| 43 | Garden City | 26,739 | 1,711 | 6.4% |
| 44 | Port Huron | 28,620 | 1,814 | 6.34% |
| 45 | Mount Pleasant | 21,236 | 1,340 | 6.31% |
| 46 | Walker | 25,386 | 1,562 | 6.15% |
| 47 | Grand Blanc | 7,987 | 485 | 6.07% |
| 48 | Grandville | 16,356 | 986 | 6.03% |
| 49 | Grand Haven | 10,996 | 654 | 5.95% |
| 50 | Benton Harbor | 8,953 | 521 | 5.82% |
| 51 | Springfield | 5,269 | 299 | 5.67% |
| 52 | Lapeer | 9,082 | 506 | 5.57% |
| 53 | Portage | 49,259 | 2,741 | 5.56% |
| 54 | Manistee | 6,275 | 347 | 5.53% |
| 55 | Milan | 5,987 | 330 | 5.51% |
| 56 | Ann Arbor | 122,036 | 6,698 | 5.49% |
| 57 | Dearborn Heights | 61,771 | 3,385 | 5.48% |
| 58 | Hazel Park | 14,963 | 794 | 5.31% |
| 59 | St. Joseph | 7,986 | 415 | 5.2% |
| 60 | Richmond | 5,855 | 302 | 5.16% |
| 61 | Holly | 5,964 | 305 | 5.11% |
| 62 | Grand Ledge | 7,804 | 399 | 5.11% |
| 63 | Rochester Hills | 77,089 | 3,906 | 5.07% |
| 64 | Marshall | 6,804 | 340 | 5.0% |
| 65 | Ludington | 7,676 | 381 | 4.96% |
| 66 | Westland | 83,633 | 3,997 | 4.78% |
| 67 | Ferndale | 19,190 | 909 | 4.74% |
| 68 | Royal Oak | 57,950 | 2,680 | 4.62% |
| 69 | Saline | 9,006 | 415 | 4.61% |
| 70 | Muskegon Heights | 9,841 | 450 | 4.57% |
| 71 | Midland | 42,724 | 1,951 | 4.57% |
| 72 | Clawson | 11,374 | 517 | 4.55% |
| 73 | Novi | 66,717 | 2,993 | 4.49% |
| 74 | Flint | 80,175 | 3,592 | 4.48% |
| 75 | Livonia | 93,851 | 4,168 | 4.44% |
| 76 | Birmingham | 21,763 | 963 | 4.42% |
| 77 | Charlotte | 9,277 | 410 | 4.42% |
| 78 | Trenton | 18,125 | 792 | 4.37% |
| 79 | Wixom | 17,295 | 748 | 4.32% |
| 80 | Iron Mountain | 7,518 | 318 | 4.23% |
| 81 | Eaton Rapids | 5,183 | 215 | 4.15% |
| 82 | Swartz Creek | 5,853 | 234 | 4.0% |
| 83 | Mount Clemens | 15,511 | 616 | 3.97% |
| 84 | Burton | 29,500 | 1,166 | 3.95% |
| 85 | Mason | 8,249 | 321 | 3.89% |
| 86 | Berkley | 15,149 | 581 | 3.84% |
| 87 | Wayne | 17,310 | 661 | 3.82% |
| 88 | Hillsdale | 8,002 | 302 | 3.77% |
| 89 | St. Johns | 7,715 | 288 | 3.73% |
| 90 | Inkster | 25,428 | 940 | 3.7% |
| 91 | Owosso | 14,632 | 540 | 3.69% |
| 92 | Farmington | 11,504 | 423 | 3.68% |
| 93 | New Baltimore | 12,072 | 439 | 3.64% |
| 94 | Traverse City | 15,593 | 563 | 3.61% |
| 95 | Alpena | 10,154 | 346 | 3.41% |
| 96 | Walled Lake | 7,299 | 246 | 3.37% |
| 97 | Davison | 5,076 | 171 | 3.37% |
| 98 | Roseville | 47,123 | 1,587 | 3.37% |
| 99 | Norton Shores | 25,041 | 793 | 3.17% |
| 100 | Flushing | 8,284 | 260 | 3.14% |