

Like all states, Ohio has certain places that are going on hard times. These Ohio places have an above-average percentage of people living in poverty, out of work, or not making as much as they should be.
Even as the economy continues to improve, it’s worthwhile to look at the places in each state struggling to make ends meet. So we set our sites on locating the poorest places in Ohio.
To do so, we used Saturday Night Science to analyze the newest Census data from the American Community Survey for the 248 cities in Ohio with more than 5,000 people.

$22,116 median income · 40.7% poverty · #1 lowest income in Ohio
 Located in
Cuyahoga County, Ohio
Located in
Cuyahoga County, Ohio
East Cleveland, unfortunately, ranks as the poorest place in Ohio thanks to combination of low pay and and a lack of jobs.
The city of 13,534 people averages the lowest median household income in Ohio and the 2nd highest poverty rate. At the very least, the cost of living ranks in the bottom 15% of place in the state, so things like housing are relatively affordable.
Data | Crime | Cost of living | Movers
$34,408 median income · 37.3% poverty · #3 lowest income in Ohio
 Located in
Trumbull County, Ohio
Located in
Trumbull County, Ohio
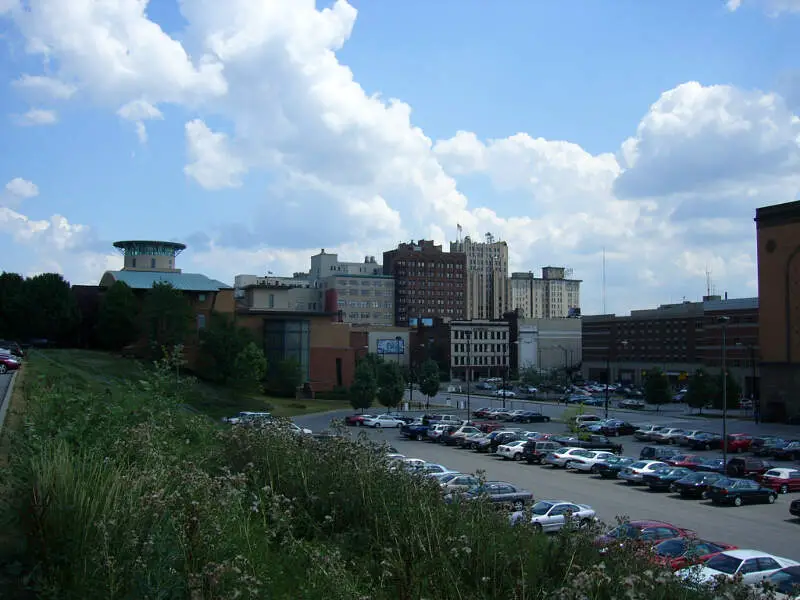
The second poorest city in Ohio is Youngstown.
The city ranks as having the 4th highest incidence of poverty and 3rd lowest median household income. However, the unemployment rate ‘only’ ranks as the 8th highest in the Buckeye State.
Data | Crime | Cost of living | Movers
$34,713 median income · 35.4% poverty · #4 lowest income in Ohio
 Located in
Scioto County, Ohio
Located in
Scioto County, Ohio
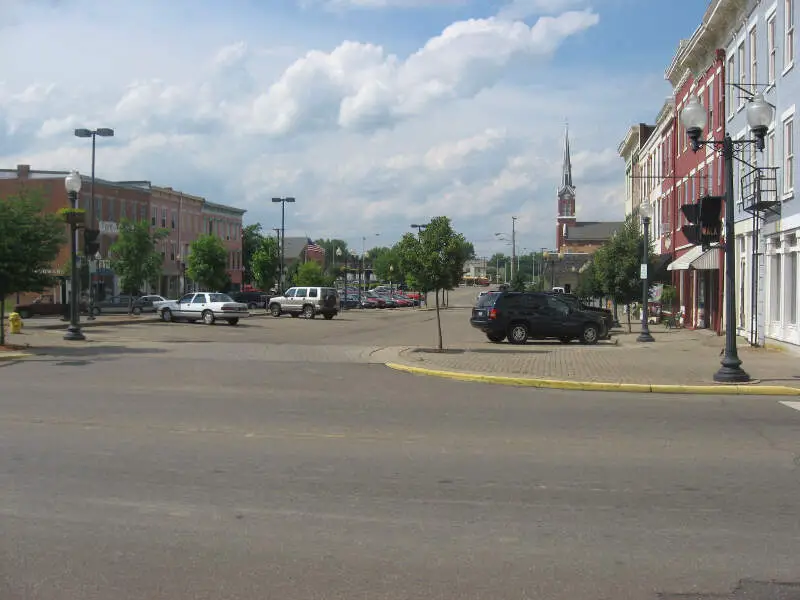
Placing as the third poorest city, Portsmouth’s median income ranks as the 4th lowest.
And that’s a sign that there’s a relatively substantial jump in the quality of the economy from second to third place on our list. The poverty rate is 35.4% and ranks near the bottom of places in the state.
But what makes up for the relatively low incomes of the city is its low cost of living. The income you do make here goes further than in most parts of the Buckeye State.
Data | Crime | Cost of living | Movers
$34,009 median income · 32.9% poverty · #2 lowest income in Ohio
 Located in
Columbiana County, Ohio
Located in
Columbiana County, Ohio
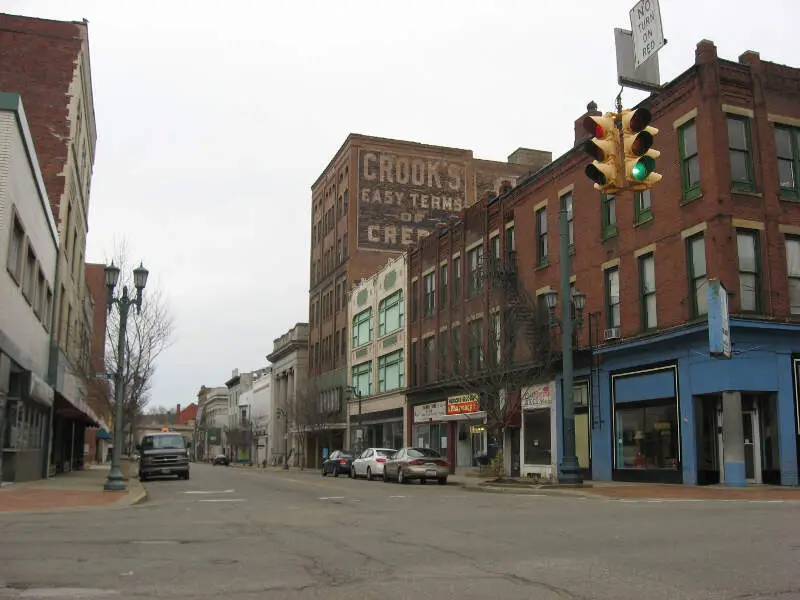
East Liverpool ranks as the fourth poorest place in Ohio.
The town ranks as having the 2nd lowest median household income and the 7th highest incidence of poverty in the state.
That being said, there’s still a ton of cultural diversity in the city as it hosts many events throughout the year.
Data | Crime | Cost of living | Movers
$40,764 median income · 45.5% poverty · #8 lowest income in Ohio
 Located in
Butler County, Ohio
Located in
Butler County, Ohio
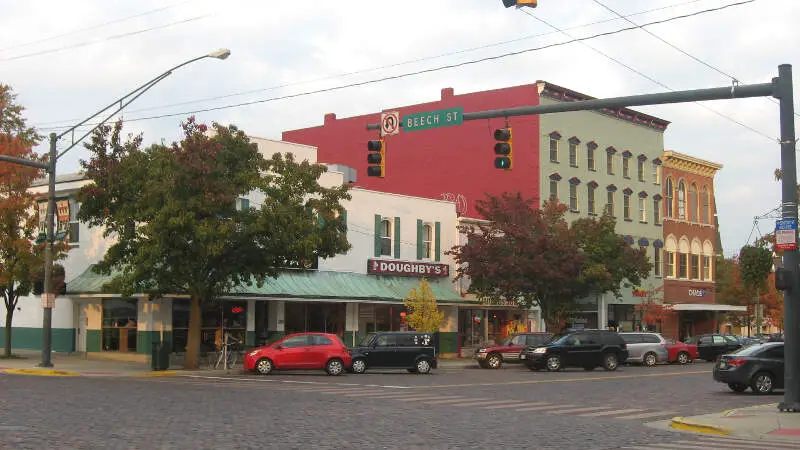
The fifth poorest city in Ohio is Oxford.
The city ranks as having the 8th lowest median income in the state. However, an extremely low cost of living prevents a good number of folks from living in poverty as the poverty rate only ranks as the highest in Ohio.
Still not the best news for Oxford.
Data | Crime | Cost of living | Movers
$38,204 median income · 40.0% poverty · #7 lowest income in Ohio
 Located in
Athens County, Ohio
Located in
Athens County, Ohio
Athens ranks as the sixth poorest place in the Buckeye State.
It ranks as having the 3rd highest incidence of poverty and the 25th highest unemployment rate.
Data | Crime | Cost of living | Movers
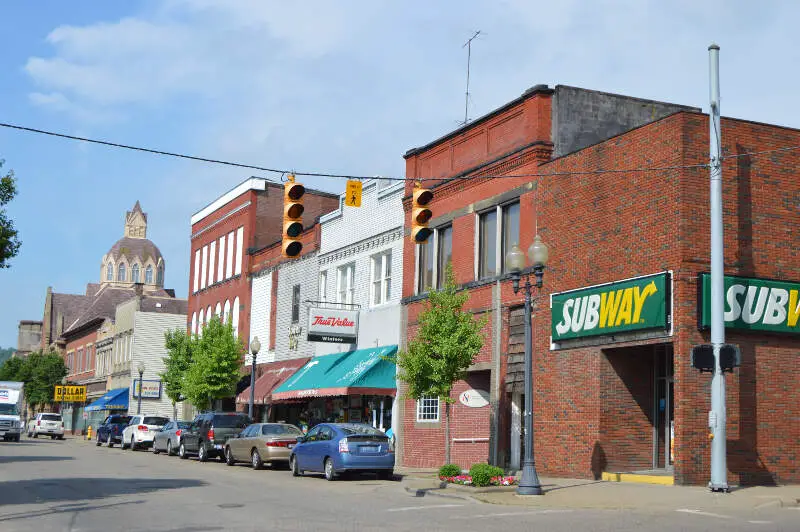
$37,467 median income · 34.3% poverty · #5 lowest income in Ohio
 Located in
Belmont County, Ohio
Located in
Belmont County, Ohio
Martins Ferry places as the seventh poorest city in Ohio.
The city of over 6,140 ranks as having the 6th highest incidence of poverty in the state. However, it has a very low cost of living which helps to pay the bills each month.
Data | Crime | Cost of living | Movers
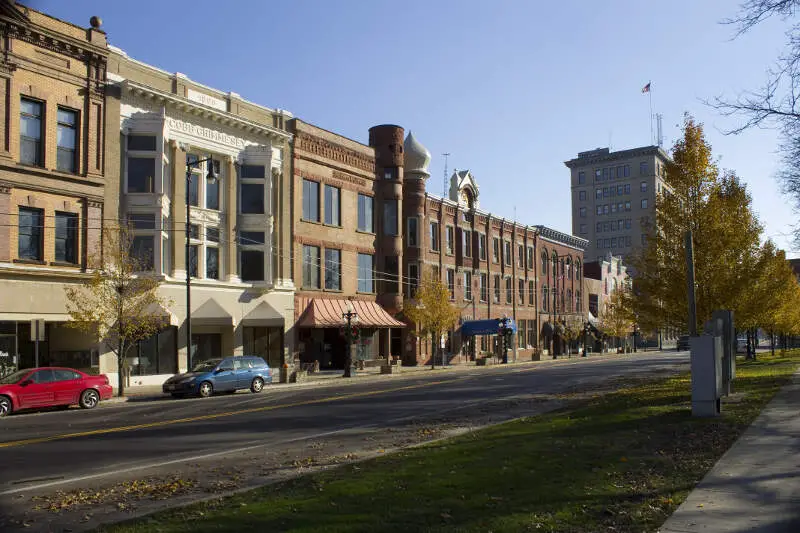
$37,887 median income · 31.9% poverty · #6 lowest income in Ohio
 Located in
Trumbull County, Ohio
Located in
Trumbull County, Ohio
Warren ranks as the eighth poorest city in Ohio.
The big issue for the town is the unemployment rate which ranks as one of the highest in the state.
Data | Crime | Cost of living | Movers

$40,801 median income · 30.6% poverty · #9 lowest income in Ohio
 Located in
Cuyahoga County, Ohio
Located in
Cuyahoga County, Ohio
Cleveland couldn’t stay out of the top ten poorest places in Ohio; it ranks number 9.
While the median income is the 9th lowest, there are a substantial number of people that live below the poverty line. Overall, Cleveland ranks as having the 10th most people living in poverty of all the places we analyzed in Ohio.
Data | Crime | Cost of living | Movers | Compare
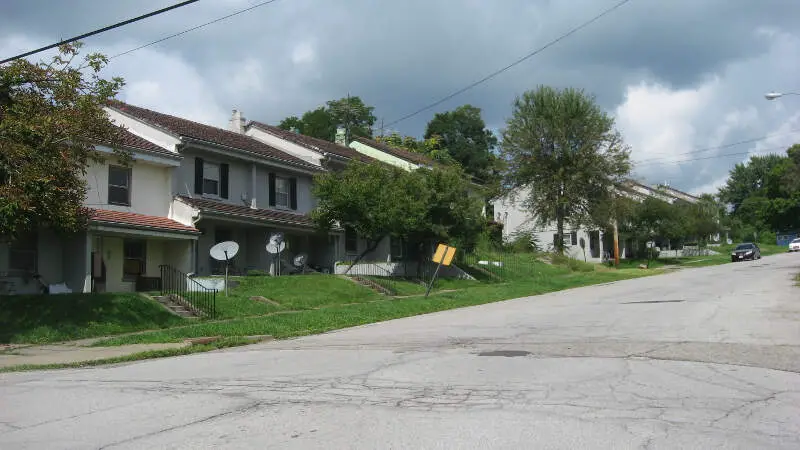
$42,909 median income · 31.1% poverty · #11 lowest income in Ohio
 Located in
Mahoning County, Ohio
Located in
Mahoning County, Ohio
And rounding out the top ten poorest cities in Ohio is Campbell.
The city of 7,784 people ranks in the bottom 20% for both median income and poverty rate in the Buckeye State.
Data | Crime | Cost of living | Movers
The receipts
Compare the top ten
Pick a metric. The bars rescale. The red line is Ohio’s statewide median.
Ohio statewide median: $71,389
Ohio statewide median: 13.3%
Ohio statewide median: 4.8%
On the map
Where poverty hits hardest in Ohio
Saturday Night Science
How we determined the poorest places in Ohio for 2026
The first thing that comes to most people’s minds when they think about determining the poorest places is to simply the poverty rate. That is, the number of people living below a federally established level of income for a household of a certain size.
However, we don’t think that one statistic wholly encompasses what it means to be one of the “poorest places”. So we used Saturday Night Science to look at this set of criteria from the newly released 2020-2024 American Community Survey:
- Poverty Level
- Median Household Income
After we collected the data for all 248 places with more than 5,000 people in Ohio, we ranked each place from 1 to 248 for each of the criteria, with 1 being the poorest.
We then averaged all the rankings for a place into a “Poor Score” with the place having the lowest overall Poor Score, East Cleveland, crowned the “Poorest Place In Ohio For 2026”. The median Ohio home is 55 years old — old enough that it pays to compare home warranty plans before something expensive breaks.
The full plate
Detailed list of the poorest places to live in Ohio
Click any column to sort. Search by city name.
| Rank | City | Poor Score | Population | Median income | Poverty | Unemployment |
|---|---|---|---|---|---|---|
| 1 | East Cleveland | 1.50 | 13,534 | $22,116 | 40.7% | 18.4% |
| 2 | Youngstown | 3.50 | 59,331 | $34,408 | 37.3% | 11.9% |
| 3 | Portsmouth | 4.50 | 17,728 | $34,713 | 35.4% | 8.2% |
| 4 | East Liverpool | 4.50 | 9,783 | $34,009 | 32.9% | 5.9% |
| 5 | Oxford | 4.50 | 21,753 | $40,764 | 45.5% | 14.4% |
| 6 | Athens | 5.00 | 23,396 | $38,204 | 40.0% | 8.2% |
| 7 | Martins Ferry | 5.50 | 6,140 | $37,467 | 34.3% | 14.1% |
| 8 | Warren | 7.00 | 38,912 | $37,887 | 31.9% | 9.4% |
| 9 | Cleveland | 9.50 | 366,097 | $40,801 | 30.6% | 10.8% |
| 10 | Campbell | 10.00 | 7,784 | $42,909 | 31.1% | 12.3% |
| 11 | Cambridge | 12.50 | 10,060 | $42,946 | 27.9% | 3.0% |
| 12 | Ashtabula | 13.50 | 17,856 | $44,120 | 29.8% | 11.8% |
| 13 | Canton | 14.00 | 69,755 | $43,188 | 27.4% | 7.8% |
| 14 | Uhrichsville | 14.50 | 5,189 | $41,846 | 26.0% | 7.2% |
| 15 | Kent | 14.50 | 27,116 | $42,964 | 27.1% | 11.2% |
| 16 | Bowling Green | 15.00 | 29,983 | $45,154 | 28.6% | 5.7% |
| 17 | Dayton | 18.00 | 136,579 | $45,247 | 26.9% | 9.0% |
| 18 | Zanesville | 21.50 | 24,740 | $43,280 | 24.1% | 7.4% |
| 19 | Steubenville | 23.50 | 18,124 | $48,172 | 26.6% | 5.3% |
| 20 | Lima | 24.50 | 35,010 | $46,240 | 23.9% | 8.5% |
| 21 | Mansfield | 24.50 | 47,663 | $44,540 | 23.5% | 7.3% |
| 22 | Coshocton | 25.50 | 11,068 | $48,731 | 25.9% | 7.4% |
| 23 | Lorain | 27.50 | 65,395 | $48,685 | 25.2% | 6.3% |
| 24 | Ironton | 28.00 | 10,768 | $47,648 | 23.7% | 6.8% |
| 25 | Fremont | 28.50 | 15,835 | $47,024 | 22.7% | 5.5% |
| 26 | Springfield | 28.50 | 58,190 | $47,143 | 23.1% | 9.4% |
| 27 | Sandusky | 29.00 | 24,606 | $50,139 | 25.6% | 7.8% |
| 28 | Toledo | 30.50 | 267,463 | $49,724 | 24.3% | 7.7% |
| 29 | Akron | 30.50 | 189,247 | $48,076 | 23.3% | 7.8% |
| 30 | Painesville | 31.50 | 20,548 | $51,516 | 25.6% | 6.5% |
| 31 | Marion | 33.00 | 35,669 | $47,951 | 22.4% | 9.4% |
| 32 | Salem | 33.50 | 11,758 | $47,073 | 21.3% | 6.2% |
| 33 | Moraine | 33.50 | 6,536 | $48,788 | 22.8% | 5.0% |
| 34 | Cincinnati | 35.50 | 311,224 | $52,909 | 25.5% | 6.8% |
| 35 | Maple Heights | 37.00 | 23,258 | $53,414 | 25.4% | 11.6% |
| 36 | Warrensville Heights | 38.50 | 13,545 | $49,669 | 21.4% | 8.3% |
| 37 | Marietta | 38.50 | 13,203 | $47,873 | 19.1% | 4.7% |
| 38 | Trotwood | 39.00 | 23,041 | $50,113 | 21.5% | 8.6% |
| 39 | Cheviot | 43.00 | 8,660 | $53,132 | 22.6% | 8.5% |
| 40 | Logan | 47.00 | 6,993 | $57,882 | 27.3% | 3.6% |
| 41 | Girard | 47.00 | 9,505 | $52,550 | 20.0% | 4.9% |
| 42 | Mount Vernon | 48.00 | 17,052 | $53,845 | 21.9% | 2.8% |
| 43 | Wellston | 49.50 | 5,452 | $56,193 | 25.0% | 3.5% |
| 44 | Bryan | 50.00 | 8,631 | $52,865 | 19.0% | 5.6% |
| 45 | Alliance | 51.00 | 21,478 | $56,106 | 23.8% | 4.3% |
| 46 | Garfield Heights | 51.00 | 29,269 | $54,593 | 22.0% | 8.4% |
| 47 | Mount Healthy | 53.00 | 6,919 | $54,565 | 21.0% | 5.9% |
| 48 | Hillsboro | 54.50 | 6,527 | $55,521 | 21.7% | 5.3% |
| 49 | Jackson | 54.50 | 6,231 | $53,538 | 18.7% | 2.8% |
| 50 | Bellevue | 55.00 | 8,187 | $53,875 | 18.9% | 6.4% |
| 51 | Euclid | 55.50 | 48,823 | $50,285 | 16.6% | 6.1% |
| 52 | Willard | 56.00 | 6,164 | $53,542 | 18.5% | 2.6% |
| 53 | Hamilton | 57.50 | 63,468 | $55,166 | 19.6% | 5.9% |
| 54 | Niles | 59.00 | 18,287 | $50,953 | 16.2% | 4.2% |
| 55 | Whitehall | 59.50 | 20,019 | $51,759 | 16.4% | 8.8% |
| 56 | Greenville | 60.00 | 12,741 | $47,237 | 14.2% | 4.0% |
| 57 | Franklin | 60.00 | 11,712 | $58,587 | 22.5% | 4.6% |
| 58 | Chillicothe | 62.50 | 21,902 | $54,086 | 17.4% | 4.9% |
| 59 | Geneva | 62.50 | 5,886 | $53,557 | 17.1% | 2.9% |
| 60 | Barberton | 64.50 | 24,844 | $52,267 | 15.6% | 4.2% |
| 61 | Kenton | 64.50 | 7,663 | $56,033 | 18.6% | 5.7% |
| 62 | Galion | 65.50 | 10,339 | $52,176 | 15.2% | 5.0% |
| 63 | Xenia | 66.00 | 25,689 | $56,029 | 17.9% | 6.2% |
| 64 | Washington Court House | 66.00 | 14,439 | $55,998 | 17.7% | 5.3% |
| 65 | Fostoria | 66.50 | 12,344 | $54,151 | 16.4% | 6.2% |
| 66 | Elyria | 68.00 | 53,035 | $54,945 | 16.7% | 5.6% |
| 67 | Ravenna | 68.50 | 11,274 | $59,971 | 19.1% | 6.0% |
| 68 | Eaton | 69.00 | 8,339 | $51,467 | 14.1% | 1.5% |
| 69 | Struthers | 70.00 | 9,923 | $53,447 | 15.0% | 4.7% |
| 70 | Wilmington | 72.00 | 12,620 | $57,199 | 17.5% | 4.2% |
| 71 | Bellefontaine | 72.00 | 13,807 | $58,806 | 18.1% | 5.3% |
| 72 | Circleville | 72.00 | 14,142 | $60,296 | 18.9% | 6.8% |
| 73 | Belpre | 72.00 | 6,654 | $54,592 | 15.8% | 3.1% |
| 74 | Bedford Heights | 72.00 | 10,847 | $50,269 | 12.7% | 6.5% |
| 75 | Middletown | 73.00 | 51,617 | $57,102 | 17.1% | 5.9% |
| 76 | Bucyrus | 74.50 | 11,594 | $54,349 | 14.9% | 6.2% |
| 77 | Conneaut | 75.50 | 12,357 | $61,741 | 19.4% | 12.5% |
| 78 | Toronto | 77.00 | 5,293 | $55,972 | 15.2% | 2.9% |
| 79 | Port Clinton | 79.50 | 5,970 | $60,909 | 17.5% | 4.4% |
| 80 | Van Wert | 79.50 | 10,790 | $55,113 | 14.2% | 4.2% |
| 81 | Ashland | 80.00 | 18,911 | $60,029 | 16.6% | 3.8% |
| 82 | North College Hill | 80.00 | 9,555 | $64,655 | 20.6% | 4.6% |
| 83 | Clyde | 80.50 | 6,331 | $50,574 | 11.3% | 4.9% |
| 84 | New Philadelphia | 81.00 | 17,520 | $58,547 | 15.9% | 3.7% |
| 85 | Tiffin | 83.00 | 17,818 | $56,198 | 14.8% | 3.8% |
| 86 | New Carlisle | 83.50 | 5,544 | $64,443 | 18.7% | 13.3% |
| 87 | Norwalk | 84.50 | 17,095 | $60,844 | 16.3% | 5.4% |
| 88 | Newark | 84.50 | 50,783 | $61,670 | 17.1% | 3.8% |
| 89 | Massillon | 87.00 | 32,338 | $56,446 | 13.9% | 4.4% |
| 90 | Columbus | 87.50 | 914,802 | $66,082 | 18.1% | 5.1% |
| 91 | West Carrollton | 89.50 | 12,976 | $61,619 | 16.0% | 3.1% |
| 92 | Riverside | 90.50 | 24,435 | $61,352 | 15.3% | 6.6% |
| 93 | Bedford | 91.00 | 12,931 | $57,308 | 13.6% | 8.1% |
| 94 | Piqua | 92.50 | 20,646 | $67,796 | 17.6% | 3.7% |
| 95 | Sidney | 92.50 | 20,501 | $60,668 | 14.2% | 4.8% |
| 96 | Rittman | 92.50 | 6,044 | $60,154 | 14.0% | 8.2% |
| 97 | Shelby | 93.00 | 8,865 | $58,351 | 13.2% | 4.2% |
| 98 | Defiance | 95.50 | 17,276 | $61,439 | 14.7% | 5.5% |
| 99 | Lancaster | 96.50 | 41,249 | $59,133 | 12.6% | 5.0% |
| 100 | Parma Heights | 97.00 | 20,581 | $61,009 | 13.9% | 4.1% |
Source: U.S. Census ACS 2020-2024. 248 cities with more than 5,000 residents.
Summary
The poorest cities in Ohio for 2026
Like we said earlier, when we set out to identify the poorest places in Ohio, we weren’t sure what we’d encounter, but it ended up being some of the best places to live in Ohio.
When you look at the data, the cities and places mentioned above meet the criteria for being at the very bottom of the income ladder for everyone that lives there. Not sold on Ohio? Take the two-minute Find Your Place quiz and see which state actually fits you.
Questions and answers
Poorest Places In Ohio FAQs
What is the poorest city in Ohio?
East Cleveland is the poorest city in Ohio for 2026. The median household income in East Cleveland is $22,116, against a statewide median of $71,389. Youngstown and Portsmouth are next.
What are the 10 poorest cities in Ohio?
The ten poorest cities in Ohio are East Cleveland, Youngstown, Portsmouth, East Liverpool, Oxford, Athens, Martins Ferry, Warren, Cleveland, and Campbell. We ranked all 248 places with more than 5,000 residents on income, poverty, and unemployment.
What is the poverty rate in East Cleveland?
The poverty rate in East Cleveland is 40.7%, compared to 13.3% across Ohio as a whole. Poverty rate is one of the three measures in our Poor Score, along with income and unemployment.
What income counts as poor in Ohio?
The ten poorest cities in Ohio all post median household incomes of $42,909 or less. The statewide median is $71,389, so these places sit well below the typical Ohio paycheck.
How do you decide which places in Ohio are the poorest?
We pull median household income, poverty rate, and unemployment for every Ohio place with more than 5,000 residents from the Census American Community Survey, rank each measure, and average the ranks into a Poor Score. East Cleveland has the worst combined score for 2026.



