

Most African American cities in Alabama research summary. We used Saturday Night Science to analyze Alabama’s most recent Census data to determine the cities with the largest Black population, based on the percentage of Black residents.
The city with the largest African American population in Alabama is Fairfield (90.7% Black); the least is Cullman (0.6%). Statewide, Alabama is 25.6% Black — the 5th blackest state in the country.
Roughly 42 million people identifying as Black or African American live in the United States, about 12% of the total population. In Alabama, the Black population is 1,302,911, at 25.6% of the state total.
We broke down the most recent Census data to determine the cities in Alabama with the largest African American population in 2026.
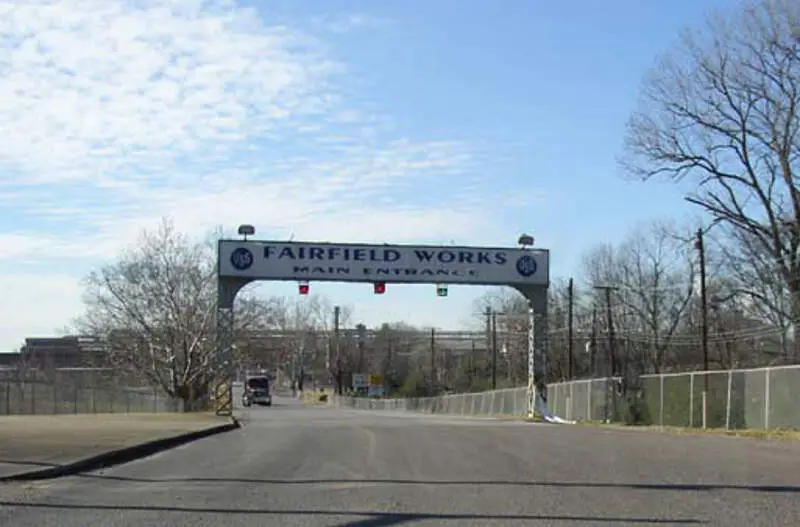
#1 most African American in Alabama
 Located in
Jefferson County, Alabama
Located in
Jefferson County, Alabama
Fairfield is a city in western Jefferson County, Alabama, United States. It is part of the Birmingham metropolitan area and is located southeast of Pleasant Grove. The population was 11,117 at the 2010 census.
Data | Crime | Cost of living | Movers
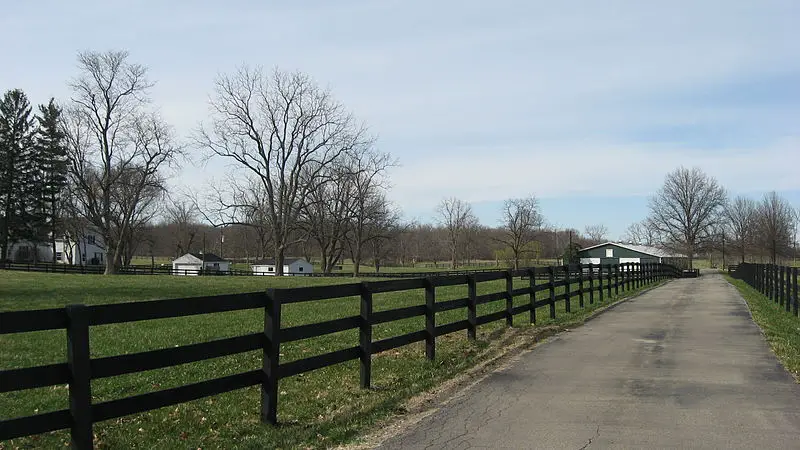
#2 most African American in Alabama
 Located in
Mobile County, Alabama
Located in
Mobile County, Alabama
Prichard is a city in Mobile County, Alabama, United States.
Data | Crime | Cost of living | Movers
#3 most African American in Alabama
Data | Movers
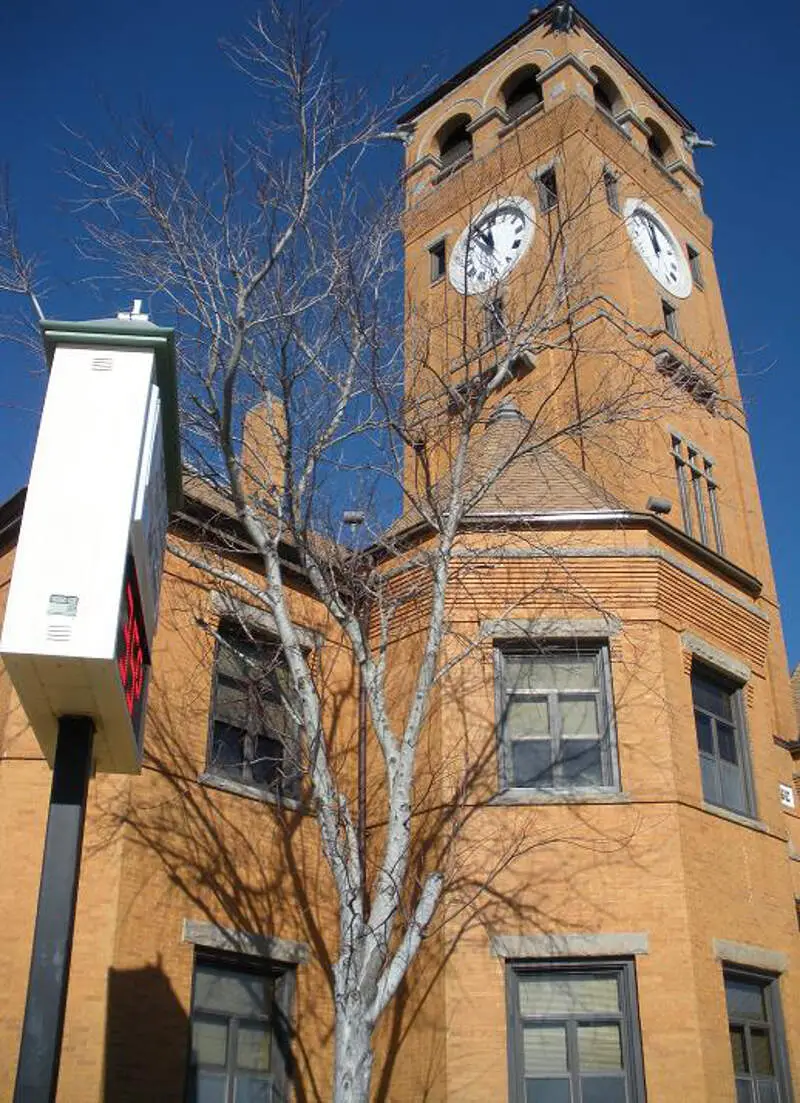
#4 most African American in Alabama
 Located in
Macon County, Alabama
Located in
Macon County, Alabama
Tuskegee is a city in Macon County, Alabama, United States. It was founded and laid out in 1833 by General Thomas Simpson Woodward, a Creek War veteran under Andrew Jackson, and made the county seat that year. It was incorporated in 1843. It is also the largest city in Macon County. At the 2010 census the population was 9,865, down from 11,846 in 2000.
Data | Crime | Cost of living | Movers
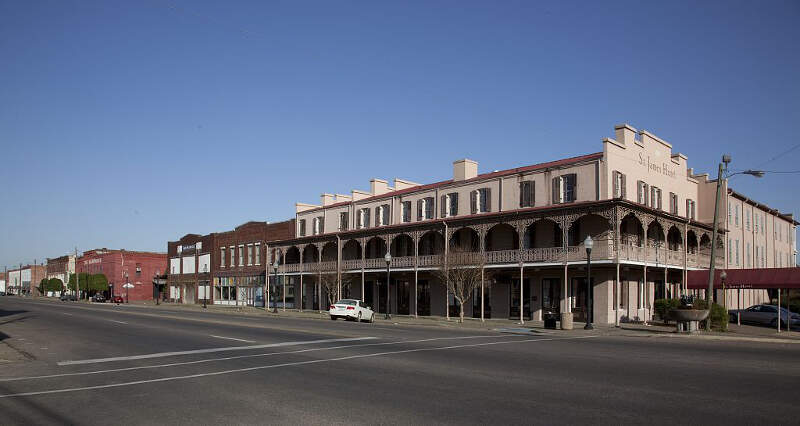
#5 most African American in Alabama
 Located in
Dallas County, Alabama
Located in
Dallas County, Alabama
Selma is a city in and the county seat of Dallas County, in the Black Belt region of south central Alabama and extending to the west. Located on the banks of the Alabama River, the city has a population of 20,756 as of the 2010 census.
Data | Crime | Cost of living | Movers
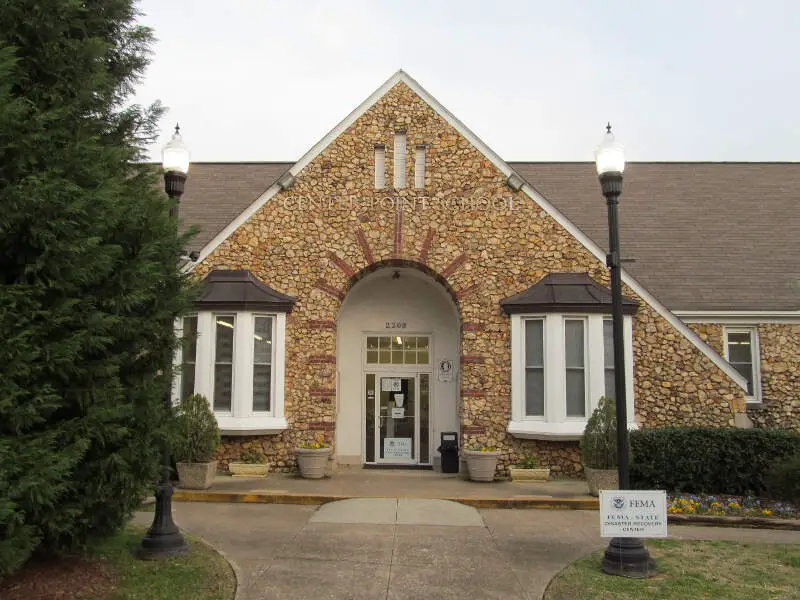
#6 most African American in Alabama
 Located in
Jefferson County, Alabama
Located in
Jefferson County, Alabama
Data | Crime | Cost of living | Movers
#7 most African American in Alabama
 Located in
Jefferson County, Alabama
Located in
Jefferson County, Alabama
Pleasant Grove is a city in western Jefferson County, Alabama. It is part of the Birmingham metropolitan area. Its nickname is “The Good Neighbor City”. At the 2010 census the population was 10,110.
Data | Crime | Cost of living | Movers
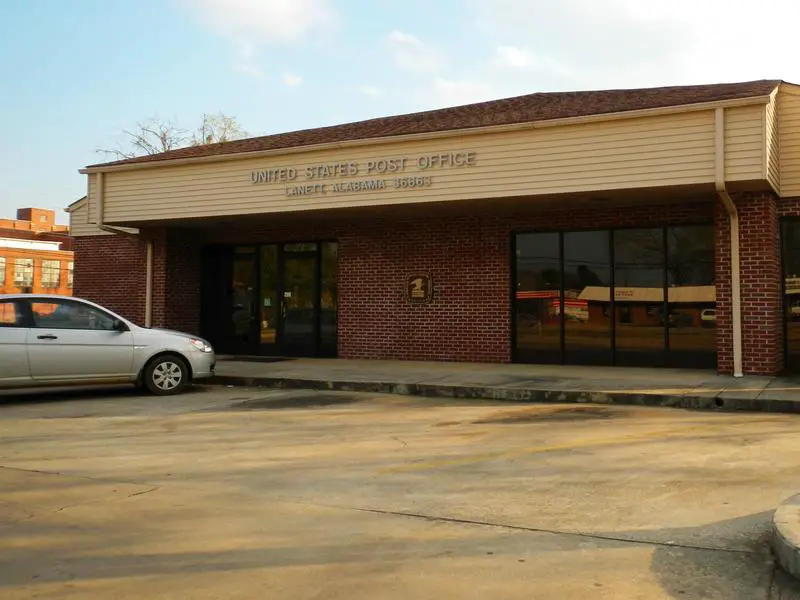
#8 most African American in Alabama
 Located in
Chambers County, Alabama
Located in
Chambers County, Alabama
Data | Crime | Cost of living | Movers
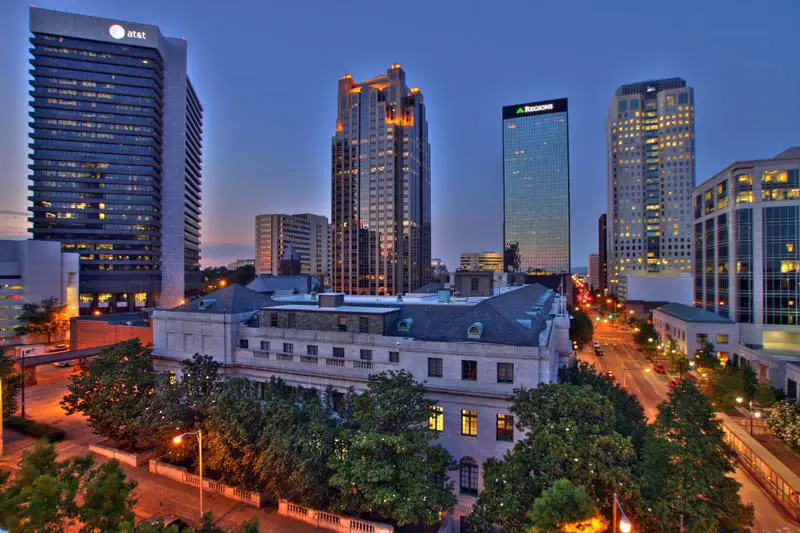
#9 most African American in Alabama
 Located in
Shelby County, Alabama
Located in
Shelby County, Alabama
Birmingham is the most populous city in the U.S. state of Alabama and the county seat of Jefferson County. The city’s population was 212,237 in the 2010 United States Census. In the 2010 US Census, the Birmingham-Hoover Metropolitan Statistical Area had a population of about 1,128,047, which is approximately one-quarter of Alabama’s population.
Data | Crime | Cost of living | Movers
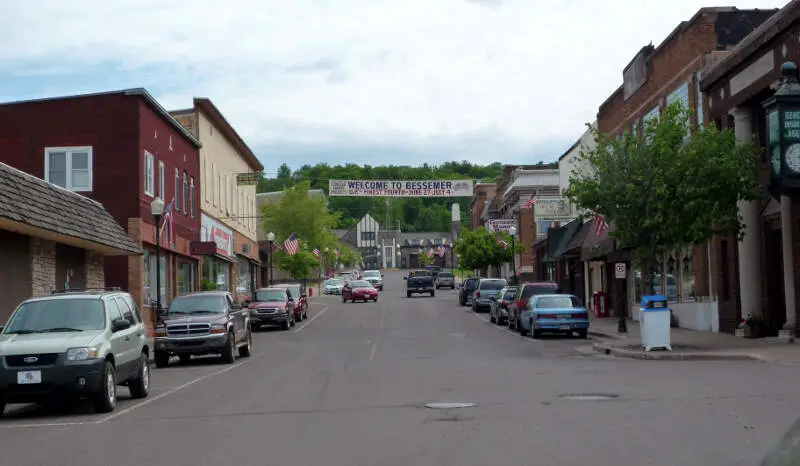
#10 most African American in Alabama
 Located in
Jefferson County, Alabama
Located in
Jefferson County, Alabama
Bessemer is a city southwest of Birmingham in Jefferson County, Alabama, United States, 8 miles west of Hoover. The population was 27,456 at the 2010 Census.
Data | Crime | Cost of living | Movers
The receipts
Compare the top ten
Pick a metric. The bars rescale. The red line is Alabama’s statewide median.
On the map
Where Alabama’s Black communities live
Saturday Night Science
Methodology: How We Determined The Cities In Alabama With The Largest Black Population For 2026
We still believe in the accuracy of data — especially from the Census. So that’s where we went to get the race breakdown across Alabama.
That leads us to the Census’s most recently available data, the 2020-2024 American Community Survey data from the US Census.
Specifically, we looked at table B03002: Hispanic OR LATINO ORIGIN BY RACE. Here are the category names as defined by the Census:
- Hispanic or Latino
- White alone*
- Black or African American alone*
- American Indian and Alaska Native alone*
- Asian alone*
- Native Hawaiian and Other Pacific Islander alone*
- Some other race alone*
- Two or more races*
Our particular column of interest was the number of people who identified as Black or African American.
We limited our analysis to non-CDPs with a population greater than 5,000 people in Alabama. That left us with 100 cities.
We then calculated the percentage of residents that are Black or African American. The percentages ranked from 90.7% to 0.6%.
Finally, we ranked each city based on the percentage of the Black population, with a higher score being more Black than a lower score. Fairfield took the distinction of being the most Black, while Cullman was the least African American city.
We updated this article for 2026. This is our eleventh time ranking the cities in Alabama with the largest African American population.
The full plate
African American Population By City In Alabama
Click any column to sort. Search by city name.
| Rank | City | Population | African American Population | % African American |
|---|---|---|---|---|
| 1 | Fairfield | 9,728 | 8,828 | 90.7% |
| 2 | Prichard | 18,961 | 16,698 | 88.1% |
| 3 | Midfield | 5,045 | 4,240 | 84.0% |
| 4 | Tuskegee | 8,938 | 7,510 | 84.0% |
| 5 | Selma | 17,057 | 14,074 | 82.5% |
| 6 | Center Point | 15,914 | 11,316 | 71.1% |
| 7 | Pleasant Grove | 9,442 | 6,526 | 69.1% |
| 8 | Lanett | 6,814 | 4,661 | 68.4% |
| 9 | Birmingham | 198,173 | 132,151 | 66.7% |
| 10 | Bessemer | 25,400 | 16,925 | 66.6% |
| 11 | Greenville | 7,163 | 4,567 | 63.8% |
| 12 | Montgomery | 197,494 | 124,120 | 62.8% |
| 13 | Monroeville | 5,802 | 3,550 | 61.2% |
| 14 | Atmore | 8,334 | 4,247 | 51.0% |
| 15 | Chickasaw | 6,332 | 3,207 | 50.6% |
| 16 | Anniston | 21,271 | 10,732 | 50.5% |
| 17 | Mobile | 203,416 | 102,103 | 50.2% |
| 18 | Talladega | 14,760 | 7,387 | 50.0% |
| 19 | Pinson | 7,832 | 3,774 | 48.2% |
| 20 | Phenix City | 38,499 | 18,311 | 47.6% |
| 21 | Tarrant | 5,925 | 2,668 | 45.0% |
| 22 | Eufaula | 12,584 | 5,582 | 44.4% |
| 23 | Demopolis | 6,908 | 2,983 | 43.2% |
| 24 | Clay | 10,273 | 4,416 | 43.0% |
| 25 | Hueytown | 16,414 | 6,897 | 42.0% |
| 26 | Troy | 17,716 | 7,349 | 41.5% |
| 27 | Tuscaloosa | 111,038 | 44,822 | 40.4% |
| 28 | Roanoke | 5,336 | 2,131 | 39.9% |
| 29 | Bay Minette | 8,295 | 3,305 | 39.8% |
| 30 | Opelika | 32,820 | 12,379 | 37.7% |
| 31 | Valley | 10,277 | 3,803 | 37.0% |
| 32 | Gadsden | 33,374 | 12,009 | 36.0% |
| 33 | Dothan | 71,514 | 25,520 | 35.7% |
| 34 | Fultondale | 9,384 | 3,259 | 34.7% |
| 35 | Sylacauga | 12,309 | 4,142 | 33.7% |
| 36 | Ozark | 14,327 | 4,623 | 32.3% |
| 37 | Wetumpka | 7,437 | 2,387 | 32.1% |
| 38 | Calera | 17,714 | 5,430 | 30.7% |
| 39 | Brewton | 5,186 | 1,557 | 30.0% |
| 40 | Smiths Station | 5,496 | 1,639 | 29.8% |
| 41 | Alexander City | 14,606 | 4,295 | 29.4% |
| 42 | Huntsville | 222,791 | 64,092 | 28.8% |
| 43 | Irondale | 13,464 | 3,845 | 28.6% |
| 44 | Andalusia | 8,766 | 2,388 | 27.2% |
| 45 | Montevallo | 7,556 | 2,049 | 27.1% |
| 46 | Northport | 31,218 | 8,254 | 26.4% |
| 47 | Millbrook | 17,189 | 4,531 | 26.4% |
| 48 | Tuscumbia | 9,115 | 2,240 | 24.6% |
| 49 | Jacksonville | 14,437 | 3,476 | 24.1% |
| 50 | Prattville | 39,482 | 9,375 | 23.7% |
| 51 | Sheffield | 9,340 | 2,215 | 23.7% |
| 52 | Decatur | 57,361 | 13,213 | 23.0% |
| 53 | Gardendale | 16,534 | 3,504 | 21.2% |
| 54 | Lincoln | 7,305 | 1,485 | 20.3% |
| 55 | Enterprise | 29,505 | 5,907 | 20.0% |
| 56 | Hoover | 92,642 | 17,144 | 18.5% |
| 57 | Pell City | 13,587 | 2,505 | 18.4% |
| 58 | Helena | 21,769 | 3,921 | 18.0% |
| 59 | Auburn | 80,594 | 13,717 | 17.0% |
| 60 | Athens | 29,002 | 4,866 | 16.8% |
| 61 | Homewood | 27,829 | 4,551 | 16.4% |
| 62 | Opp | 6,709 | 1,093 | 16.3% |
| 63 | Alabaster | 33,917 | 5,459 | 16.1% |
| 64 | Florence | 41,701 | 6,552 | 15.7% |
| 65 | Daphne | 29,453 | 4,546 | 15.4% |
| 66 | Clanton | 8,958 | 1,374 | 15.3% |
| 67 | Muscle Shoals | 16,951 | 2,599 | 15.3% |
| 68 | Oxford | 22,063 | 3,326 | 15.1% |
| 69 | Leeds | 12,028 | 1,599 | 13.3% |
| 70 | Jasper | 14,442 | 1,911 | 13.2% |
| 71 | Saraland | 16,404 | 2,155 | 13.1% |
| 72 | Madison | 60,106 | 7,581 | 12.6% |
| 73 | Robertsdale | 7,194 | 890 | 12.4% |
| 74 | Rainbow City | 10,284 | 1,216 | 11.8% |
| 75 | Moody | 13,488 | 1,561 | 11.6% |
| 76 | Pelham | 24,827 | 2,796 | 11.3% |
| 77 | Trussville | 26,673 | 2,902 | 10.9% |
| 78 | Russellville | 10,799 | 1,055 | 9.8% |
| 79 | Guntersville | 8,916 | 848 | 9.5% |
| 80 | Hamilton | 6,922 | 617 | 8.9% |
| 81 | Satsuma | 6,822 | 603 | 8.8% |
| 82 | Attalla | 5,775 | 494 | 8.6% |
| 83 | Chelsea | 16,260 | 1,376 | 8.5% |
| 84 | Hartselle | 15,847 | 1,058 | 6.7% |
| 85 | Scottsboro | 15,712 | 995 | 6.3% |
| 86 | Foley | 24,026 | 1,506 | 6.3% |
| 87 | Southside | 9,483 | 549 | 5.8% |
| 88 | Spanish Fort | 10,662 | 583 | 5.5% |
| 89 | Vestavia Hills | 38,616 | 2,016 | 5.2% |
| 90 | Albertville | 22,813 | 1,060 | 4.6% |
| 91 | Orange Beach | 8,407 | 329 | 3.9% |
| 92 | Fairhope | 24,190 | 786 | 3.2% |
| 93 | Oneonta | 6,971 | 200 | 2.9% |
| 94 | Gulf Shores | 16,401 | 439 | 2.7% |
| 95 | Fort Payne | 14,927 | 194 | 1.3% |
| 96 | Glencoe | 5,353 | 67 | 1.3% |
| 97 | Boaz | 10,814 | 124 | 1.1% |
| 98 | Arab | 8,679 | 71 | 0.8% |
| 99 | Mountain Brook | 22,029 | 137 | 0.6% |
| 100 | Cullman | 19,319 | 114 | 0.6% |
Source: U.S. Census ACS 2020-2024. 100 cities with more than 5,000 residents.
Summary
Summary: Black Populations Across Alabama
If you’re looking for a breakdown of African American populations across Alabama according to the most recent data, this is an accurate list.
The blackest cities in Alabama are Fairfield, Prichard, Midfield, Tuskegee, Selma, Center Point, Pleasant Grove, Lanett, Birmingham, and Bessemer.



