Most Hispanic/Latino cities in Washington research summary. We used Saturday Night Science to analyze Washington’s most recent Census data to determine the most Hispanic/Latino cities based on the percentage of Hispanic/Latino residents.
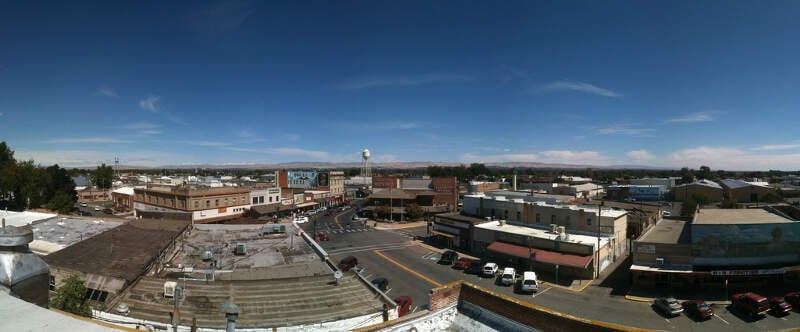
90.9% Hispanic · #1 most Hispanic in Washington
Toppenish is a city in Yakima County, Washington, United States. As of the 2010 census, the city population was 8,949. It is located within the Yakama Indian Reservation, established in 1855.
Data | Crime | Cost of living | Movers
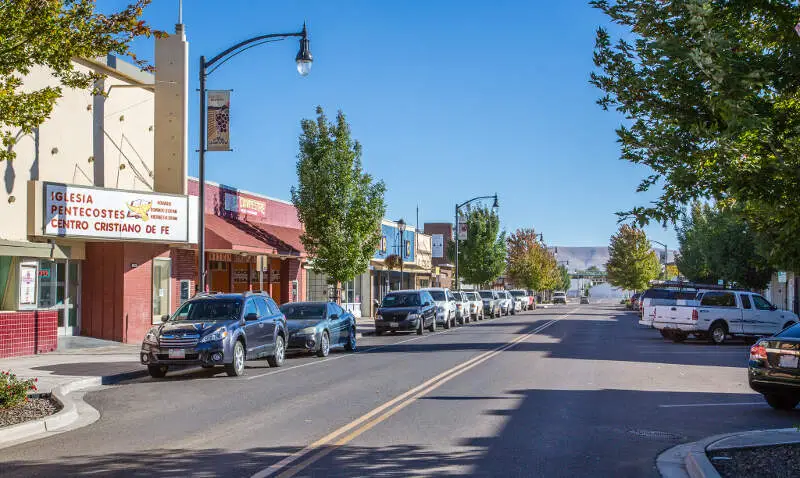
86.3% Hispanic · #2 most Hispanic in Washington
Grandview is a city in Yakima County, Washington, United States. It is about 38 miles west of Kennewick and 38 miles southeast of Yakima. The population was 10,862 at the 2010 census. Grandview-s economy is agriculture based; with apples, cherries, concord and wine grapes, hops, asparagus, corn, wheat, dairy and other fruit and vegetable production supported by processing plants and cold storage facilities.
Data | Crime | Cost of living | Movers
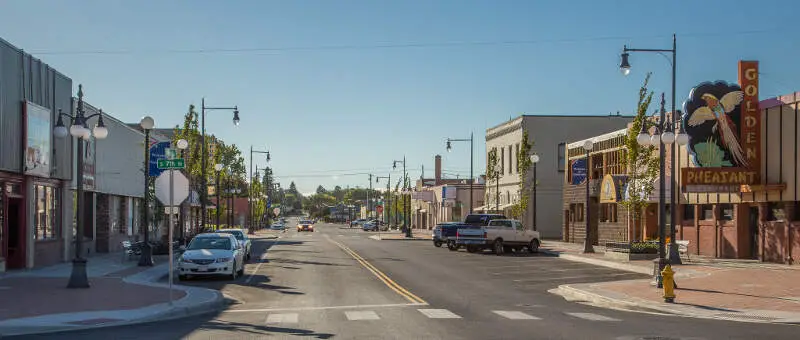
82.7% Hispanic · #3 most Hispanic in Washington
Sunnyside is a city in Yakima County, Washington, United States. As of the 2010 census the population was 15,858.
Data | Crime | Cost of living | Movers
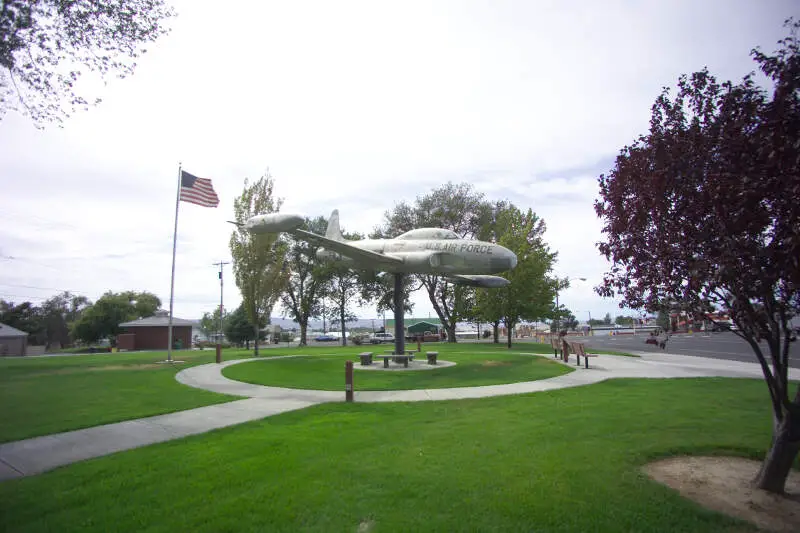
79.6% Hispanic · #4 most Hispanic in Washington
Othello is a city in Adams County, Washington, United States. The population was 5,847 at the 2000 census and grew 25.9% over the next decade to 7,364 at the 2010 census. Othello refers to the city as being in the “Heart” of the Columbia Basin Project. It is located approximately 100 miles southwest of Spokane, 180 miles east of Seattle, and about 25 miles south of Interstate 90, at the intersection of SR 17 and SR 26.
Data | Crime | Cost of living | Movers
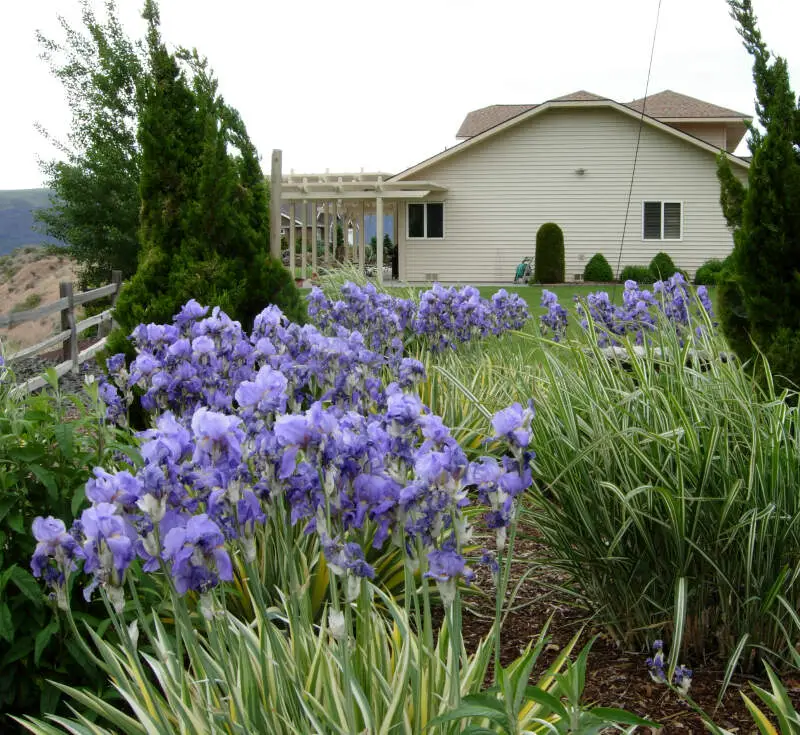
76.2% Hispanic · #5 most Hispanic in Washington
Quincy is a city in Grant County, Washington, United States. The population was 6,750 at the 2010 census.
Data | Crime | Cost of living | Movers
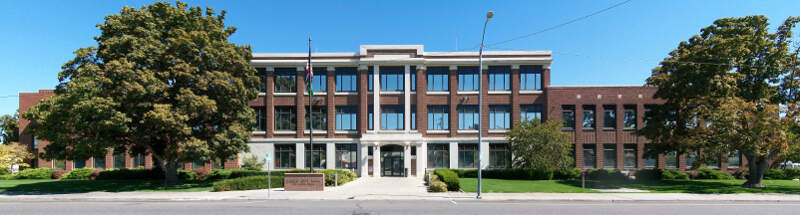
58.5% Hispanic · #6 most Hispanic in Washington
Pasco is a city in and the county seat of Franklin County, Washington, United States.
Data | Crime | Cost of living | Movers
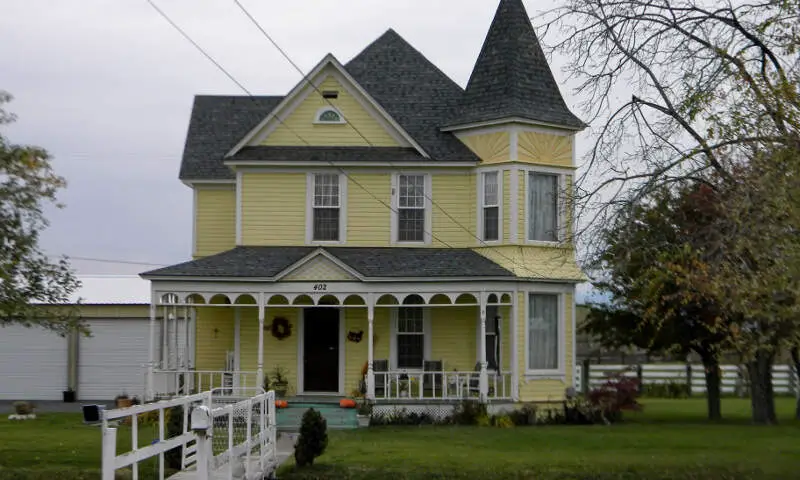
57.6% Hispanic · #7 most Hispanic in Washington
Union Gap is a city in Yakima County, Washington, United States. As of the 2010 census, the city population was 6,047. Union Gap has a storied history and in recent years has become the retail hub for the entire Yakima Valley as a result of Valley Mall and other thriving businesses being located here. Part of the city is part of the Yakama Nation.
Data | Crime | Cost of living | Movers
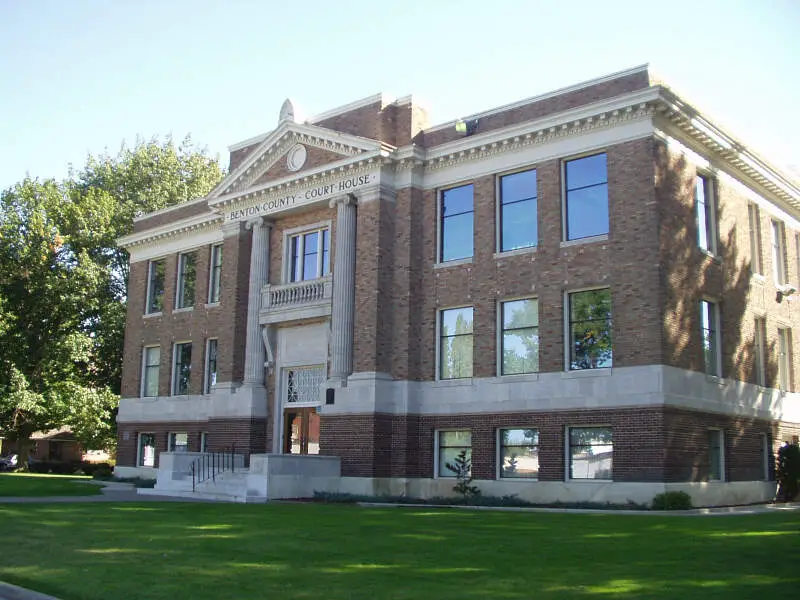
53.1% Hispanic · #8 most Hispanic in Washington
Prosser is a city in and the county seat of Benton County, Washington, United States, along the Yakima River with only one zip code 99350. The population was 5,714 at the 2010 census.
Data | Crime | Cost of living | Movers
49.4% Hispanic · #9 most Hispanic in Washington
Yakima is a U.S. city located about 60 miles southeast of Mount Rainier in Washington. Yakima is the county seat of Yakima County, Washington, and the state’s eleventh largest city by population. As of the 2010 census, the city had a total population of 91,067 and a metropolitan population of 243,231. The unincorporated suburban areas of West Valley and Terrace Heights are considered a part of greater Yakima.
Data | Crime | Cost of living | Movers
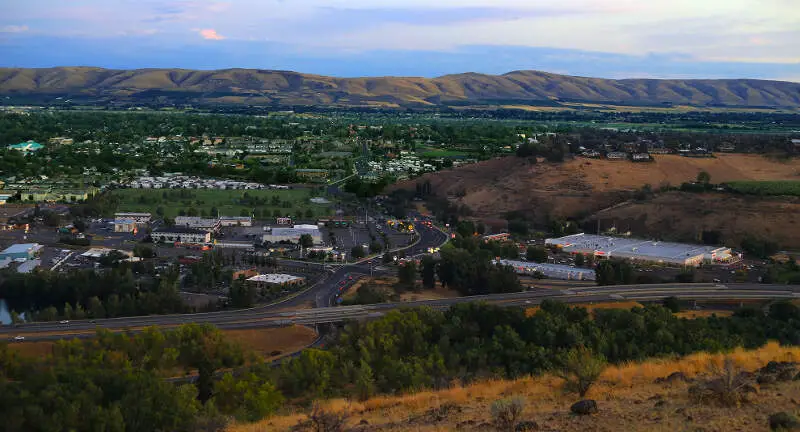
37.2% Hispanic · #10 most Hispanic in Washington
East Wenatchee is a city in Douglas County, Washington, United States, as well as a suburb of Wenatchee. The population at the 2010 census was 13,190, a 129.1% increase on the 2000 census. As of April 1, 2016, the Office of Financial Management estimates that the current population is 13,500.
Data | Crime | Cost of living | Movers
The receipts
Compare the top ten
Pick a metric. The bars rescale. The red line is Washington’s statewide median.
On the map
Where Washington’s Hispanic and Latino communities live
Saturday Night Science
Methodology: How We Determined The Cities In Washington With The Largest Hispanic Population For 2026
We used Saturday Night Science to compare data on race from the US Census for every city in Washington.
Washington’s most recently available data comes from the 2020-2024 American Community Survey.
Specifically, we looked at table B03002: Hispanic OR LATINO ORIGIN BY RACE. Here are the category names as defined by the Census:
- Hispanic or Latino
- White alone*
- Black or African American alone*
- American Indian and Alaska Native alone*
- Asian alone*
- Native Hawaiian and Other Pacific Islander alone*
- Some other race alone*
- Two or more races*
Our particular column of interest here was the number of people who identified as Hispanic or Latino.
We limited our analysis to places in Washington with a population greater than 6,000 people. That left us with 115 cities.
We then calculated the percentage of Hispanic or Latino residents in each Washington city. The percentages ranked from 90.9% to 2.4%.
Finally, we ranked each city based on the percentage of the Hispanic or Latino population, with a higher percentage being more Hispanic or Latino. Toppenish was the most Hispanic or Latino, while Mercer Island was the least Hispanic or Latino city.
We updated this article for 2026. This article represents our eleventh time ranking the cities in Washington with the largest Hispanic/Latino population.
The full plate
Cities In Washington By Hispanic Population
Click any column to sort. Search by city name.
| Rank | City | Population | Hispanic Population | % Hispanic |
|---|---|---|---|---|
| 1 | Toppenish | 8,723 | 7,932 | 90.9% |
| 2 | Grandview | 11,187 | 9,655 | 86.3% |
| 3 | Sunnyside | 16,277 | 13,453 | 82.7% |
| 4 | Othello | 8,795 | 7,004 | 79.6% |
| 5 | Quincy | 7,998 | 6,095 | 76.2% |
| 6 | Pasco | 79,575 | 46,524 | 58.5% |
| 7 | Union Gap | 6,584 | 3,792 | 57.6% |
| 8 | Prosser | 6,305 | 3,350 | 53.1% |
| 9 | Yakima | 96,961 | 47,937 | 49.4% |
| 10 | East Wenatchee | 14,199 | 5,281 | 37.2% |
| 11 | Mount Vernon | 35,377 | 13,014 | 36.8% |
| 12 | Wenatchee | 35,484 | 12,654 | 35.7% |
| 13 | Moses Lake | 26,083 | 9,106 | 34.9% |
| 14 | Ephrata | 8,560 | 2,889 | 33.8% |
| 15 | Kennewick | 85,295 | 28,174 | 33.0% |
| 16 | Burlington | 10,003 | 2,864 | 28.6% |
| 17 | Selah | 8,437 | 2,406 | 28.5% |
| 18 | Shelton | 10,612 | 2,996 | 28.2% |
| 19 | Walla Walla | 33,925 | 8,731 | 25.7% |
| 20 | Burien | 51,513 | 12,452 | 24.2% |
| 21 | Tukwila | 21,451 | 5,145 | 24.0% |
| 22 | Woodland | 6,487 | 1,507 | 23.2% |
| 23 | Aberdeen | 17,088 | 3,903 | 22.8% |
| 24 | SeaTac | 32,414 | 7,384 | 22.8% |
| 25 | Pacific | 7,066 | 1,584 | 22.4% |
| 26 | Sumner | 10,733 | 2,266 | 21.1% |
| 27 | Auburn | 85,676 | 17,784 | 20.8% |
| 28 | Sedro-Woolley | 12,831 | 2,599 | 20.3% |
| 29 | Federal Way | 99,493 | 19,934 | 20.0% |
| 30 | Des Moines | 32,823 | 6,504 | 19.8% |
| 31 | Centralia | 18,830 | 3,702 | 19.7% |
| 32 | College Place | 9,854 | 1,906 | 19.3% |
| 33 | Lakewood | 62,937 | 11,845 | 18.8% |
| 34 | Everett | 111,845 | 20,214 | 18.1% |
| 35 | Duvall | 8,526 | 1,504 | 17.6% |
| 36 | Monroe | 19,755 | 3,480 | 17.6% |
| 37 | Marysville | 73,002 | 12,323 | 16.9% |
| 38 | Vancouver | 195,300 | 32,853 | 16.8% |
| 39 | Kent | 135,603 | 22,531 | 16.6% |
| 40 | Yelm | 11,102 | 1,809 | 16.3% |
| 41 | Arlington | 21,095 | 3,368 | 16.0% |
| 42 | Milton | 8,894 | 1,417 | 15.9% |
| 43 | Renton | 105,317 | 16,450 | 15.6% |
| 44 | Lynnwood | 40,110 | 6,251 | 15.6% |
| 45 | Mountlake Terrace | 23,104 | 3,524 | 15.3% |
| 46 | Fife | 10,949 | 1,665 | 15.2% |
| 47 | Richland | 62,753 | 9,309 | 14.8% |
| 48 | Chehalis | 7,587 | 1,106 | 14.6% |
| 49 | West Richland | 17,586 | 2,561 | 14.6% |
| 50 | Oak Harbor | 24,362 | 3,422 | 14.0% |
| 51 | Lynden | 16,234 | 2,262 | 13.9% |
| 52 | Tacoma | 222,758 | 30,834 | 13.8% |
| 53 | North Bend | 7,953 | 1,061 | 13.3% |
| 54 | Bremerton | 44,830 | 5,943 | 13.3% |
| 55 | Steilacoom | 6,686 | 877 | 13.1% |
| 56 | Ellensburg | 20,874 | 2,674 | 12.8% |
| 57 | Longview | 38,069 | 4,802 | 12.6% |
| 58 | Ferndale | 15,999 | 2,008 | 12.6% |
| 59 | University Place | 34,911 | 4,337 | 12.4% |
| 60 | DuPont | 9,931 | 1,220 | 12.3% |
| 61 | Airway Heights | 11,245 | 1,290 | 11.5% |
| 62 | Lacey | 57,737 | 6,582 | 11.4% |
| 63 | Washougal | 17,490 | 1,988 | 11.4% |
| 64 | Lake Stevens | 40,253 | 4,568 | 11.3% |
| 65 | Puyallup | 42,746 | 4,795 | 11.2% |
| 66 | Covington | 21,233 | 2,376 | 11.2% |
| 67 | Poulsbo | 12,165 | 1,321 | 10.9% |
| 68 | Cheney | 12,804 | 1,369 | 10.7% |
| 69 | Port Orchard | 17,149 | 1,822 | 10.6% |
| 70 | Olympia | 55,951 | 5,910 | 10.6% |
| 71 | Kelso | 12,684 | 1,305 | 10.3% |
| 72 | Bellingham | 93,438 | 9,516 | 10.2% |
| 73 | Mukilteo | 21,323 | 2,089 | 9.8% |
| 74 | Kenmore | 23,741 | 2,315 | 9.8% |
| 75 | Orting | 8,978 | 860 | 9.6% |
| 76 | Port Angeles | 20,118 | 1,870 | 9.3% |
| 77 | Tumwater | 26,956 | 2,503 | 9.3% |
| 78 | Pullman | 32,229 | 2,970 | 9.2% |
| 79 | Bonney Lake | 22,090 | 1,998 | 9.0% |
| 80 | Snohomish | 10,239 | 914 | 8.9% |
| 81 | Shoreline | 61,431 | 5,374 | 8.7% |
| 82 | Mill Creek | 20,956 | 1,803 | 8.6% |
| 83 | Seattle | 754,195 | 63,894 | 8.5% |
| 84 | Bothell | 49,610 | 4,156 | 8.4% |
| 85 | Spokane | 230,293 | 19,282 | 8.4% |
| 86 | Battle Ground | 21,886 | 1,826 | 8.3% |
| 87 | Stanwood | 8,373 | 675 | 8.1% |
| 88 | Woodinville | 13,438 | 1,069 | 8.0% |
| 89 | Edgewood | 13,032 | 1,035 | 7.9% |
| 90 | Bellevue | 151,847 | 11,936 | 7.9% |
| 91 | Kirkland | 92,621 | 7,183 | 7.8% |
| 92 | Hoquiam | 8,800 | 681 | 7.7% |
| 93 | Spokane Valley | 106,365 | 7,556 | 7.1% |
| 94 | Enumclaw | 12,798 | 896 | 7.0% |
| 95 | Redmond | 77,353 | 5,173 | 6.7% |
| 96 | Camas | 27,007 | 1,764 | 6.5% |
| 97 | Edmonds | 42,735 | 2,605 | 6.1% |
| 98 | Lake Forest Park | 13,335 | 789 | 5.9% |
| 99 | Gig Harbor | 12,424 | 733 | 5.9% |
| 100 | Anacortes | 17,966 | 1,053 | 5.9% |
Source: U.S. Census ACS 2020-2024. 115 cities with more than 6,000 residents.
Summary
Summary: Hispanic or Latino Populations Across Washington
According to the most recent data, this is an accurate list if you’re looking for a breakdown of Latino populations for each place across Washington.
The most Hispanic/Latino cities in Washington are Toppenish, Grandview, Sunnyside, Othello, Quincy, Pasco, Union Gap, Prosser, Yakima, and East Wenatchee.


