Whitest cities in Washington research summary. We analyzed Washington’s most recent Census data to determine the whitest cities in Washington based on the percentage of White residents.
89.0% White · #1 whitest in Washington
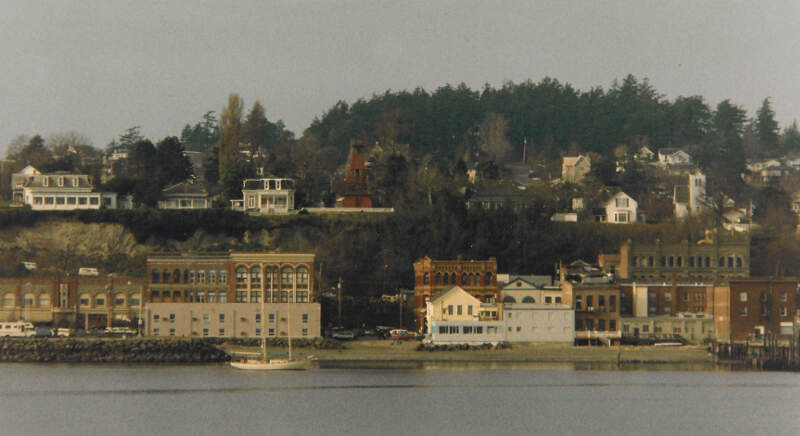
Port Townsend is a city in Jefferson County, Washington, United States. The population was 9,113 at the 2010 census, an increase of 9.3% over the 2000 census. It is the county seat and only incorporated city of Jefferson County. In addition to its natural scenery at the northeast tip of the Olympic Peninsula, the city is also known for the many Victorian buildings remaining from its late 19th century heyday, numerous annual cultural events, and as a maritime center for independent boatbuilders and related industries and crafts. The Port Townsend Historic District is a U.S. National Historic Landmark District.
Data | Crime | Cost of living | Movers
87.6% White · #2 whitest in Washington
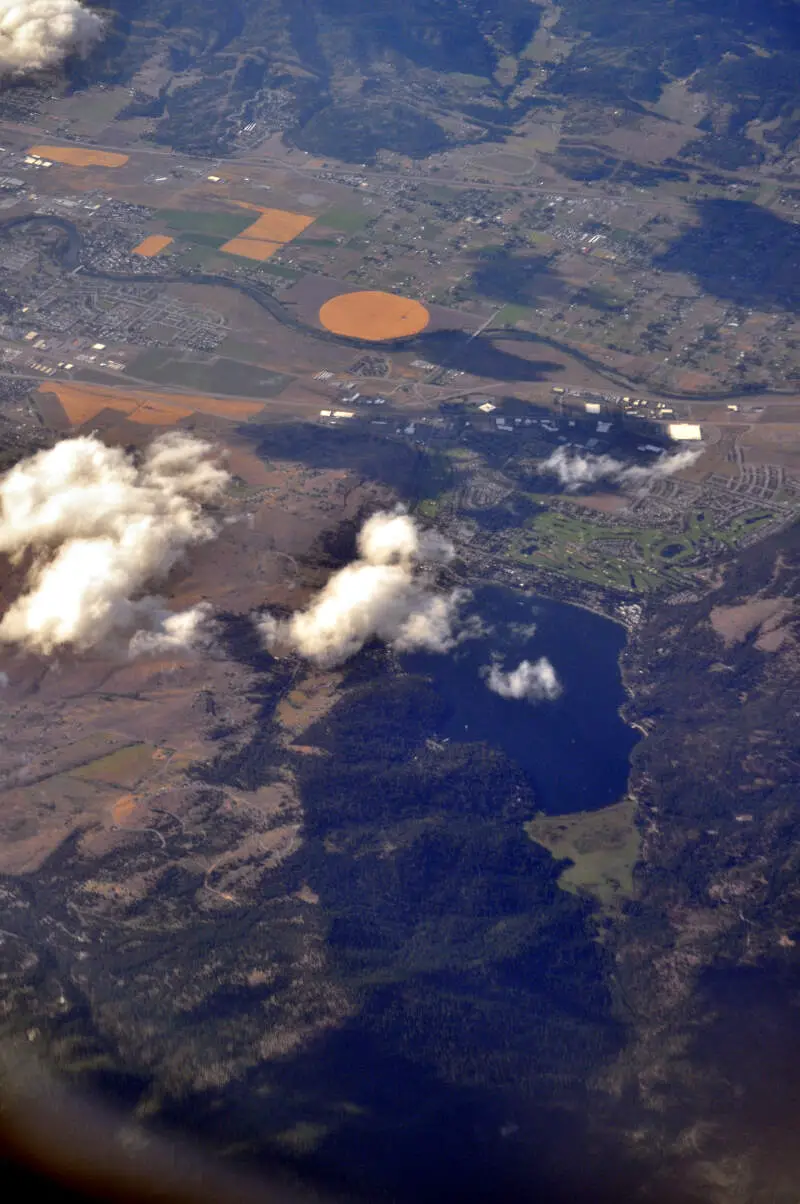
Liberty Lake is an incorporated city in Spokane County, Washington, United States, on the Idaho state line. Liberty Lake is a suburb of Spokane, Washington. Thus, it is situated between Spokane and Coeur d’Alene, Idaho. The population was 7,591 at the 2010 census.
Data | Crime | Cost of living | Movers
85.0% White · #3 whitest in Washington
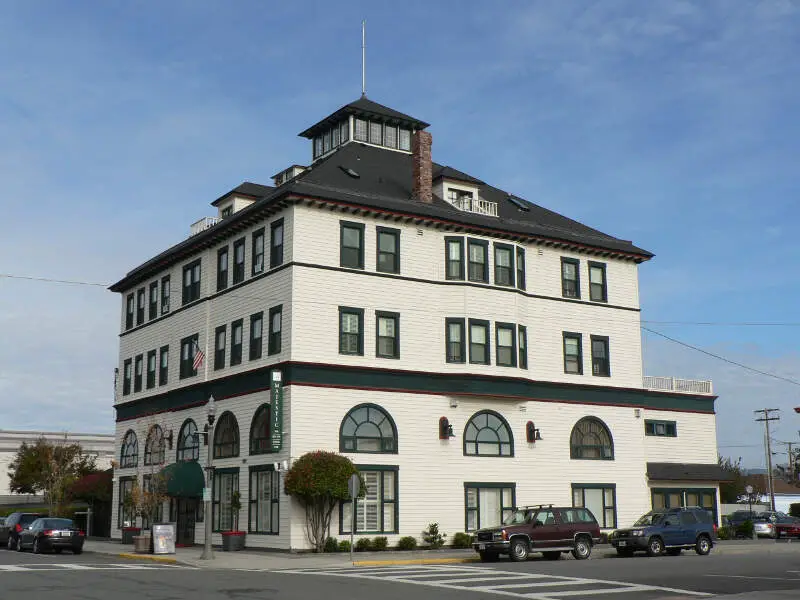
Anacortes is a city in Skagit County, Washington, United States. The name “Anacortes” is an adaptation of the name of Anne Curtis Bowman, who was the wife of early Fidalgo Island settler Amos Bowman. Anacortes’ population was 15,778 at the time of the 2010 census. It is one of two principal cities of and included in the Mount Vernon-Anacortes Metropolitan Statistical Area.
Data | Crime | Cost of living | Movers
84.3% White · #4 whitest in Washington
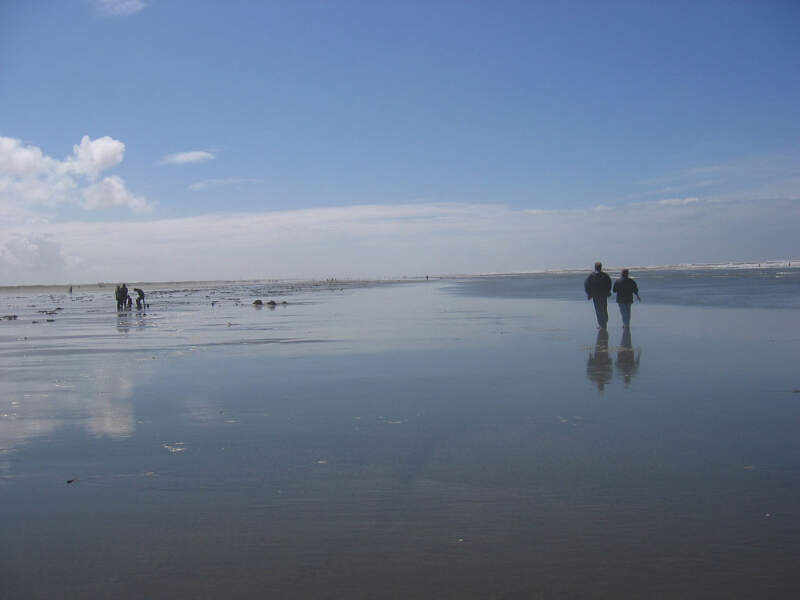
Ocean Shores is a city in Grays Harbor County, Washington, United States. The population was 5,569 at the 2010 census.
Data | Crime | Cost of living | Movers
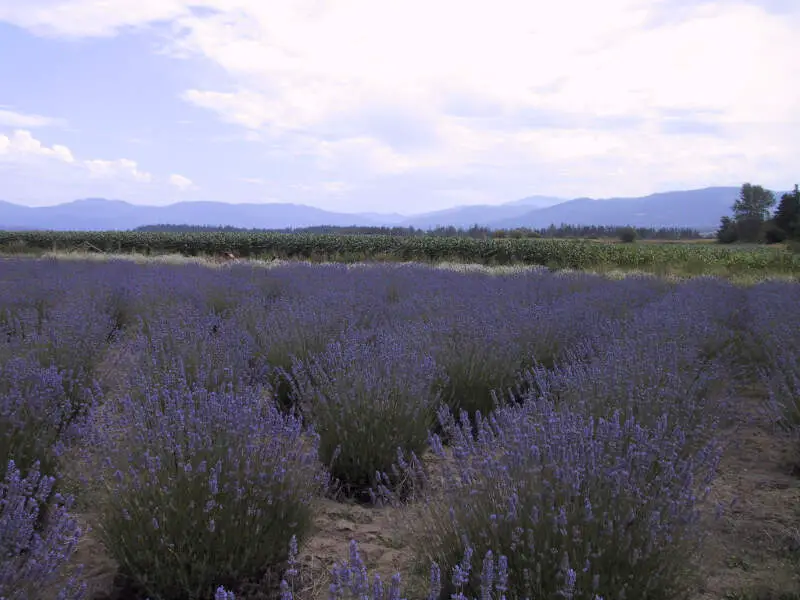
83.1% White · #5 whitest in Washington
Sequim is a city in Clallam County, Washington, United States. The 2010 census counted a population of 6,606. Sequim with the surrounding area has a population of about 28,000. Sequim is located along the Dungeness River near the base of the Olympic Mountains. The population served by the Sequim School District population is a little over 29,000. The city has been increasing in population in recent years due to the influx of retirees seeking good weather and a relaxed lifestyle.
Data | Crime | Cost of living | Movers
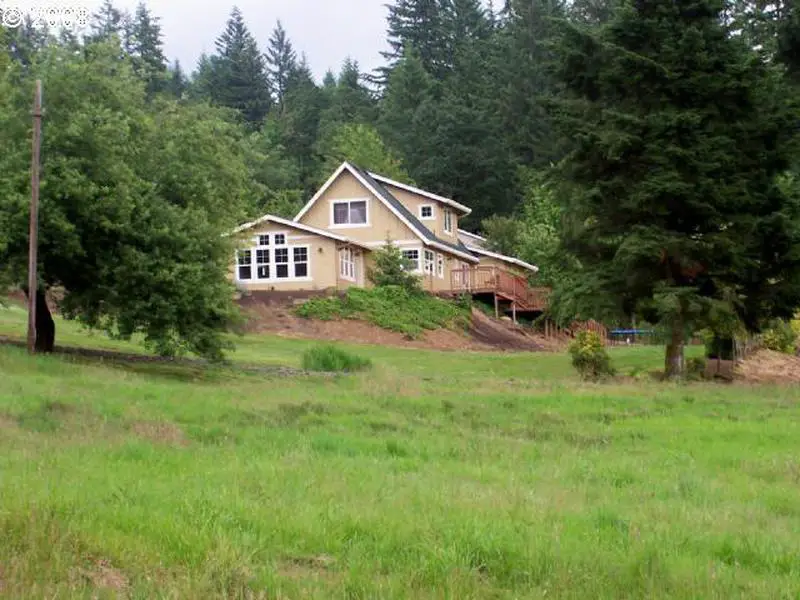
82.7% White · #6 whitest in Washington
Battle Ground is a city in Clark County, Washington, United States. The population was 17,571 at the 2010 census. Between 2000 and 2005, Battle Ground ranked fourth in the state for population growth, out of 279 eligible incorperated communities.
Data | Crime | Cost of living | Movers
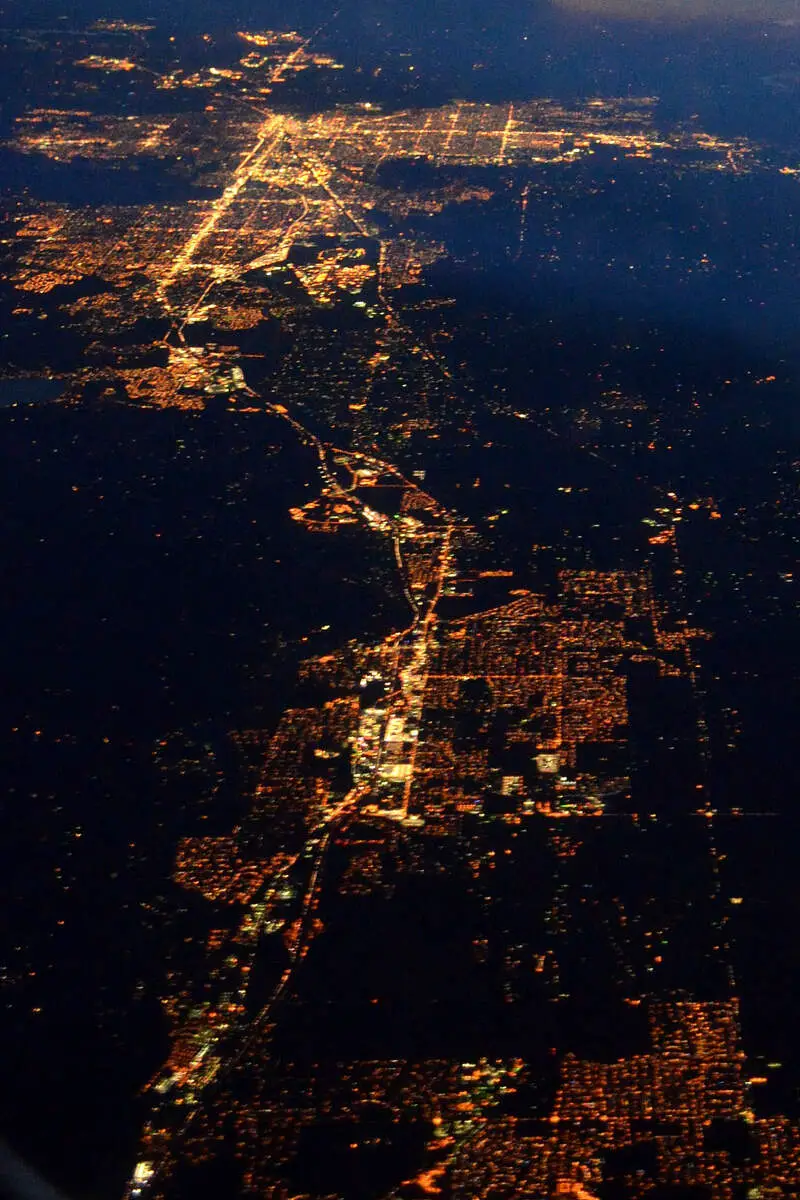
82.5% White · #7 whitest in Washington
Spokane Valley is a city in Spokane County, Washington, United States, and the largest suburb of Spokane. It is located east of Spokane, west of Coeur d’Alene, Idaho and surrounds the town of Millwood on three sides. The city incorporated as the City of Spokane Valley on March 31, 2003. The Washington State Office of Financial Management estimates the city-s population as 94,919 as of 2015. Spokane Valley is named after the valley of the Spokane River, in which it is located. Before becoming an incorporated city, the area was and still is referred to as “The Valley” by residents of the Spokane Metro Area.
Data | Crime | Cost of living | Movers
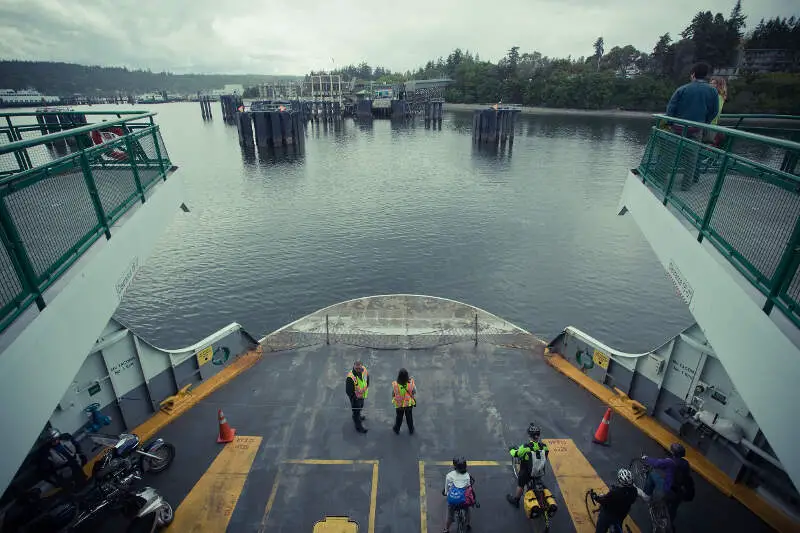
82.0% White · #8 whitest in Washington
Bainbridge Island is a city in Kitsap County, Washington, United States, and is coextensive with the eponymous island in Puget Sound. The population was 23,025 at the 2010 census, making Bainbridge Island the second largest city in Kitsap County.
Data | Crime | Cost of living | Movers
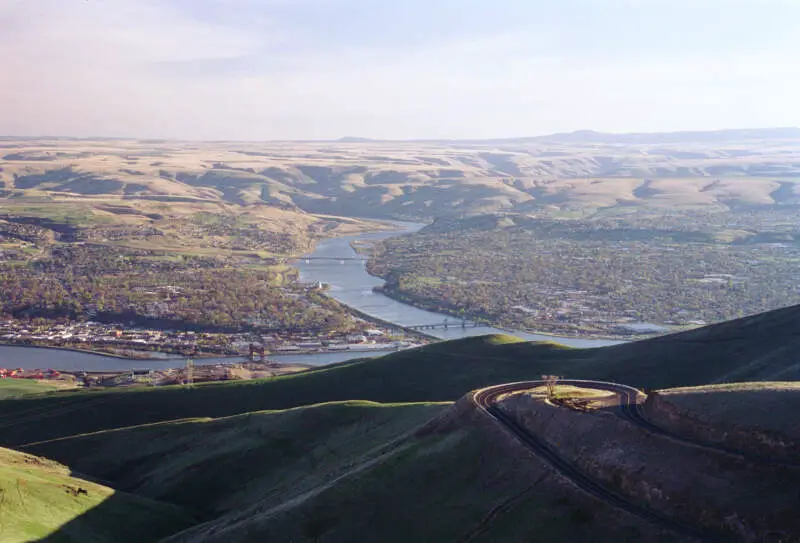
81.9% White · #9 whitest in Washington
Clarkston is a city in Asotin County, Washington, United States. It is part of the Lewiston metropolitan area, and is located west of Lewiston, Idaho, across the Snake River.
Data | Crime | Cost of living | Movers
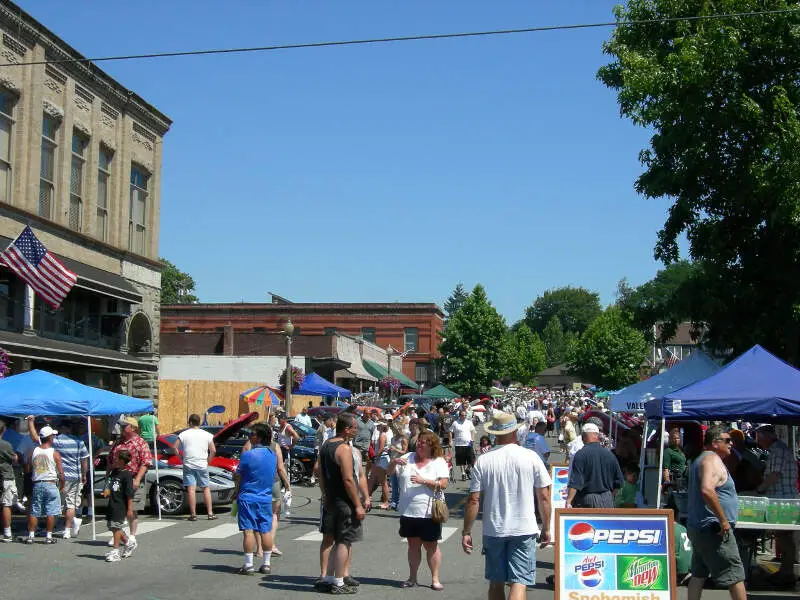
81.7% White · #10 whitest in Washington
Snohomish is a city in Snohomish County, Washington, United States. The population was 9,098 at the 2010 census. The mayor of Snohomish is John T. Kartak and the interim city administrator is Steve Schuller. Snohomish prides itself for its historical downtown, and is known for its many antique shops. Snohomish is also referred to as the “Antique Capital of the Northwest.” The historic business and residential center of the town constitutes the Snohomish Historic District, which is listed on the National Register of Historic Places. Many houses bear plaques with the year the house was built and the name of the people who originally occupied it. Each year the city gives tours of the historic houses; one of them, the Blackman House, is a year-round museum. A general aviation airfield, Harvey Airfield, is less than one mile southwest of downtown Snohomish.
Data | Crime | Cost of living | Movers
The receipts
Compare the top ten
Pick a metric. The bars rescale. The red line is Washington’s statewide median.
On the map
Where Washington’s White population is concentrated
Saturday Night Science
Methodology: How we determined the whitest places in Washington for 2026
To rank the whitest places in Washington, we used Saturday Night Science to look at Census demographic data.
We had to look at the number of white people living in each city in Washington on a per capita basis. In other words, the percentage of white people living in each city in Washington.
We looked at table B03002: Hispanic OR LATINO ORIGIN BY RACE. Here are the category names as defined by the Census:
- Hispanic or Latino
- White alone*
- Black or African American alone*
- American Indian and Alaska Native alone*
- Asian alone*
- Native Hawaiian and Other Pacific Islander alone*
- Some other race alone*
- Two or more races*
Our particular column of interest here was the number of people who identified as White alone.
We limited our analysis to places with a population greater than 6,000 people. That left us with 115 cities.
We then calculated the percentage of residents that are White. The percentages ranked from 89.0% to 4.3%.
Finally, we ranked each city based on the percentage of the White population, with a higher percentage being more White. Port Townsend took the distinction of being the most White, while Toppenish was the least White city.
We updated this article for 2026. This report represents our eleventh time ranking the whitest cities in Washington.
The full plate
Cities In Washington By White Population
Click any column to sort. Search by city name.
| Rank | City | Population | White Population | % White |
|---|---|---|---|---|
| 1 | Port Townsend | 10,438 | 9,293 | 89.0% |
| 2 | Liberty Lake | 12,737 | 11,152 | 87.6% |
| 3 | Anacortes | 17,966 | 15,276 | 85.0% |
| 4 | Ocean Shores | 7,302 | 6,152 | 84.3% |
| 5 | Sequim | 8,161 | 6,784 | 83.1% |
| 6 | Battle Ground | 21,886 | 18,110 | 82.7% |
| 7 | Spokane Valley | 106,365 | 87,755 | 82.5% |
| 8 | Bainbridge Island | 24,631 | 20,202 | 82.0% |
| 9 | Clarkston | 7,191 | 5,888 | 81.9% |
| 10 | Snohomish | 10,239 | 8,365 | 81.7% |
| 11 | Hoquiam | 8,800 | 7,171 | 81.5% |
| 12 | Stanwood | 8,373 | 6,772 | 80.9% |
| 13 | Enumclaw | 12,798 | 10,320 | 80.6% |
| 14 | Gig Harbor | 12,424 | 9,829 | 79.1% |
| 15 | Normandy Park | 6,659 | 5,255 | 78.9% |
| 16 | Port Angeles | 20,118 | 15,843 | 78.8% |
| 17 | Washougal | 17,490 | 13,757 | 78.7% |
| 18 | Spokane | 230,293 | 178,707 | 77.6% |
| 19 | Orting | 8,978 | 6,957 | 77.5% |
| 20 | Lynden | 16,234 | 12,533 | 77.2% |
| 21 | Longview | 38,069 | 29,380 | 77.2% |
| 22 | Chehalis | 7,587 | 5,812 | 76.6% |
| 23 | Bellingham | 93,438 | 71,196 | 76.2% |
| 24 | Snoqualmie | 13,798 | 10,499 | 76.1% |
| 25 | Ellensburg | 20,874 | 15,813 | 75.8% |
| 26 | Bonney Lake | 22,090 | 16,708 | 75.6% |
| 27 | Kelso | 12,684 | 9,564 | 75.4% |
| 28 | Cheney | 12,804 | 9,523 | 74.4% |
| 29 | Port Orchard | 17,149 | 12,600 | 73.5% |
| 30 | Poulsbo | 12,165 | 8,936 | 73.5% |
| 31 | West Richland | 17,586 | 12,904 | 73.4% |
| 32 | Edmonds | 42,735 | 30,991 | 72.5% |
| 33 | Centralia | 18,830 | 13,631 | 72.4% |
| 34 | Richland | 62,753 | 45,321 | 72.2% |
| 35 | Woodland | 6,487 | 4,666 | 71.9% |
| 36 | Sumner | 10,733 | 7,671 | 71.5% |
| 37 | Arlington | 21,095 | 15,060 | 71.4% |
| 38 | Olympia | 55,951 | 39,834 | 71.2% |
| 39 | Brier | 6,545 | 4,649 | 71.0% |
| 40 | College Place | 9,854 | 6,999 | 71.0% |
| 41 | Edgewood | 13,032 | 9,246 | 70.9% |
| 42 | Sedro-Woolley | 12,831 | 9,053 | 70.6% |
| 43 | Camas | 27,007 | 18,912 | 70.0% |
| 44 | Ferndale | 15,999 | 11,199 | 70.0% |
| 45 | Fircrest | 7,069 | 4,900 | 69.3% |
| 46 | Puyallup | 42,746 | 29,505 | 69.0% |
| 47 | North Bend | 7,953 | 5,469 | 68.8% |
| 48 | Lake Forest Park | 13,335 | 9,111 | 68.3% |
| 49 | Steilacoom | 6,686 | 4,559 | 68.2% |
| 50 | Pullman | 32,229 | 21,930 | 68.0% |
| 51 | Maple Valley | 28,287 | 19,144 | 67.7% |
| 52 | Lake Stevens | 40,253 | 27,203 | 67.6% |
| 53 | Tumwater | 26,956 | 17,935 | 66.5% |
| 54 | Duvall | 8,526 | 5,646 | 66.2% |
| 55 | Aberdeen | 17,088 | 11,200 | 65.5% |
| 56 | Vancouver | 195,300 | 127,582 | 65.3% |
| 57 | Walla Walla | 33,925 | 22,037 | 65.0% |
| 58 | Woodinville | 13,438 | 8,682 | 64.6% |
| 59 | Milton | 8,894 | 5,739 | 64.5% |
| 60 | Bothell | 49,610 | 31,945 | 64.4% |
| 61 | Monroe | 19,755 | 12,532 | 63.4% |
| 62 | Lacey | 57,737 | 36,554 | 63.3% |
| 63 | Mercer Island | 25,307 | 16,021 | 63.3% |
| 64 | Shelton | 10,612 | 6,716 | 63.3% |
| 65 | Yelm | 11,102 | 7,012 | 63.2% |
| 66 | Bremerton | 44,830 | 28,264 | 63.0% |
| 67 | Marysville | 73,002 | 46,011 | 63.0% |
| 68 | Kenmore | 23,741 | 14,880 | 62.7% |
| 69 | Kirkland | 92,621 | 57,710 | 62.3% |
| 70 | Burlington | 10,003 | 6,227 | 62.3% |
| 71 | Shoreline | 61,431 | 37,828 | 61.6% |
| 72 | Selah | 8,437 | 5,185 | 61.5% |
| 73 | Mill Creek | 20,956 | 12,836 | 61.3% |
| 74 | Ephrata | 8,560 | 5,238 | 61.2% |
| 75 | Oak Harbor | 24,362 | 14,791 | 60.7% |
| 76 | Mountlake Terrace | 23,104 | 13,815 | 59.8% |
| 77 | Mukilteo | 21,323 | 12,623 | 59.2% |
| 78 | University Place | 34,911 | 20,594 | 59.0% |
| 79 | Covington | 21,233 | 12,501 | 58.9% |
| 80 | Seattle | 754,195 | 443,250 | 58.8% |
| 81 | Kennewick | 85,295 | 49,663 | 58.2% |
| 82 | Wenatchee | 35,484 | 20,557 | 57.9% |
| 83 | Airway Heights | 11,245 | 6,482 | 57.6% |
| 84 | DuPont | 9,931 | 5,701 | 57.4% |
| 85 | Everett | 111,845 | 63,694 | 56.9% |
| 86 | Issaquah | 39,591 | 22,070 | 55.7% |
| 87 | Tacoma | 222,758 | 123,755 | 55.6% |
| 88 | East Wenatchee | 14,199 | 7,771 | 54.7% |
| 89 | Moses Lake | 26,083 | 14,264 | 54.7% |
| 90 | Mount Vernon | 35,377 | 18,946 | 53.6% |
| 91 | Pacific | 7,066 | 3,630 | 51.4% |
| 92 | Sammamish | 66,463 | 32,717 | 49.2% |
| 93 | Lynnwood | 40,110 | 19,660 | 49.0% |
| 94 | Auburn | 85,676 | 41,286 | 48.2% |
| 95 | Burien | 51,513 | 23,537 | 45.7% |
| 96 | Lakewood | 62,937 | 28,313 | 45.0% |
| 97 | Prosser | 6,305 | 2,836 | 45.0% |
| 98 | Redmond | 77,353 | 34,633 | 44.8% |
| 99 | Des Moines | 32,823 | 14,446 | 44.0% |
| 100 | Yakima | 96,961 | 41,379 | 42.7% |
Source: U.S. Census ACS 2020-2024. 115 cities with more than 6,000 residents.
Summary
Summary: White Populations Across Washington
We measured the locations with the highest percentage of white people in Washington. According to the most recent data, this list provides accurate information on the whitest places in Washington.
The most White cities in Washington are Port Townsend, Liberty Lake, Anacortes, Ocean Shores, Sequim, Battle Ground, Spokane Valley, Bainbridge Island, Clarkston, and Snohomish. Not sold on Washington? Take the two-minute Find Your Place quiz and see which state actually fits you.


