

Most African American cities in California research summary. We used Saturday Night Science to analyze California’s most recent Census data to determine the cities with the largest Black population, based on the percentage of Black residents.
The city with the largest African American population in California is Inglewood (38.5% Black); the least is Anderson (0.0%). Statewide, California is 5.2% Black — the 29th blackest state in the country.
Roughly 42 million people identifying as Black or African American live in the United States, about 12% of the total population. In California, the Black population is 2,040,095, at 5.2% of the state total.
We broke down the most recent Census data to determine the cities in California with the largest African American population in 2026.
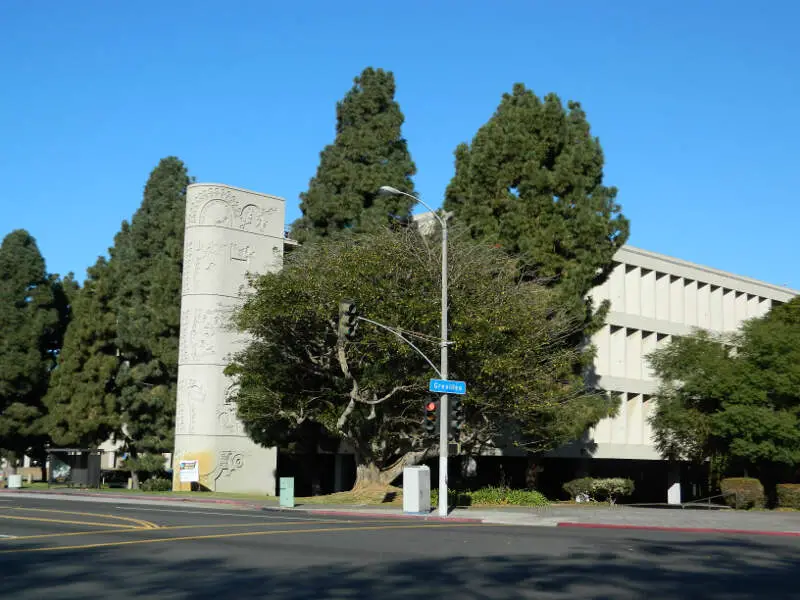
#1 most African American in California
 Located in
Los Angeles County, California
Located in
Los Angeles County, California
Inglewood is a city in southwestern Los Angeles County, California, southwest of downtown Los Angeles. As of the 2010 U.S. Census, the city had a population of 109,673. It was incorporated on February 14, 1908. The city is in the South Bay region of Los Angeles County. Los Angeles Stadium at Hollywood Park is currently under construction in the city and when completed around 2020 will be the new home of both the National Football League’s Los Angeles Rams and the Los Angeles Chargers. The city is also close to the Los Angeles International Airport.
Data | Crime | Cost of living | Movers
#2 most African American in California
 Located in
Los Angeles County, California
Located in
Los Angeles County, California
Hawthorne is a city in southwestern Los Angeles County, California, United States. The city at the 2010 census had a population of 84,293, up from 84,112 in 2000. In 2013, the population was 86,199.
Data | Crime | Cost of living | Movers
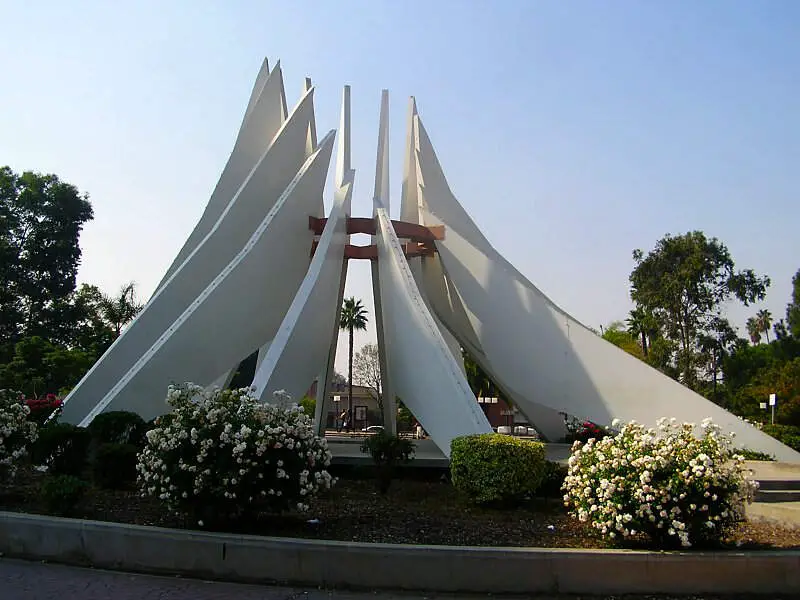
#3 most African American in California
 Located in
Los Angeles County, California
Located in
Los Angeles County, California
Compton is a city in southern Los Angeles County, California, United States, situated south of downtown Los Angeles. Compton is one of the oldest cities in the county and on May 11, 1888, was the eighth city to incorporate. As of the 2010 United States Census, the city had a total population of 96,455. It is known as the “Hub City” due to its geographic centrality in Los Angeles County. Neighborhoods in Compton include Sunny Cove, Leland, Downtown Compton, and Richland Farms. The city is generally a working class city with some middle-class neighborhoods, and is home to a relatively young community, at an average 25 years of age, compared to the American median age of 35.
Data | Crime | Cost of living | Movers | Compare
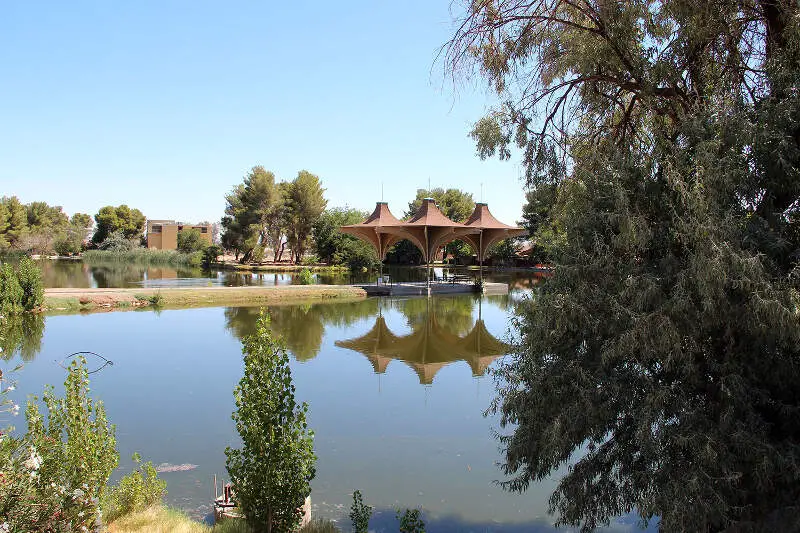
#4 most African American in California
California City is a city incorporated in 1965 in the northern Antelope Valley in Kern County, California, 65 miles southwest of Death Valley National Park. The population was 14,120 at the 2010 census making California City the 331st largest city in the state by population. Covering 203.631 square miles, the city is the third largest city in the state by area.
Data | Crime | Cost of living | Movers
#5 most African American in California
 Located in
Los Angeles County, California
Located in
Los Angeles County, California
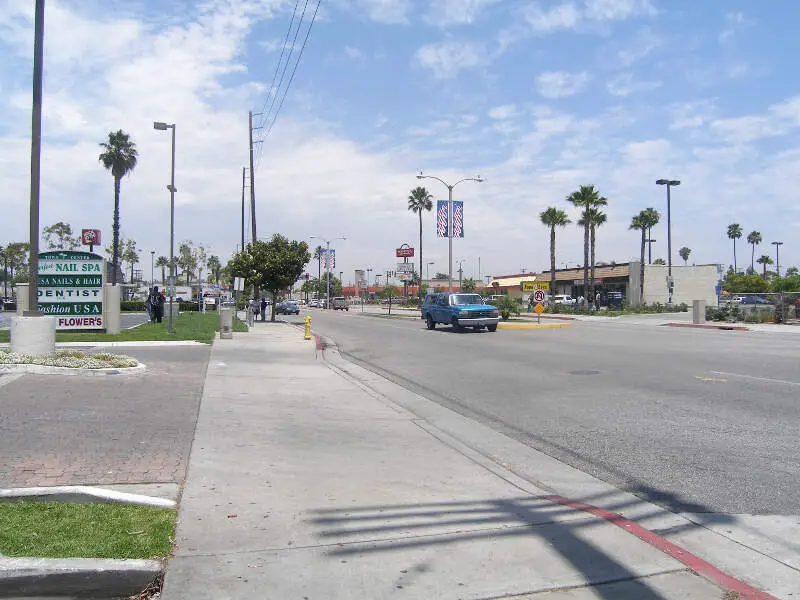
Carson is a city in Los Angeles County, California. As of the 2010 census, Carson had a population of 91,714. Located 13 miles south of downtown Los Angeles and approximately 14 miles away from the Los Angeles International Airport. Incorporated on February 20, 1968, Carson is the youngest municipality in the South Bay region of Metropolitan Los Angeles. The city is generally a working class city with some middle-class neighborhoods.
Data | Crime | Cost of living | Movers
#6 most African American in California
 Located in
Alameda County, California
Located in
Alameda County, California
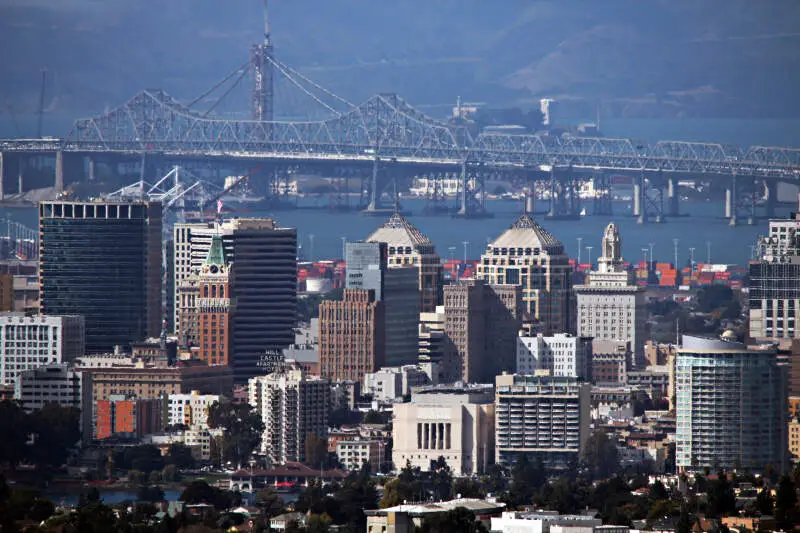
Oakland is the largest city and the county seat of Alameda County, California, United States. A major West Coast port city, Oakland is the largest city in the East Bay region of the San Francisco Bay Area, the third largest city overall in the San Francisco Bay Area, the eighth most populated city in California, and the 45th largest city in the United States. With a population of 419,267 as of 2015, it serves as a trade center for the San Francisco Bay Area; its Port of Oakland is the busiest port in the San Francisco Bay, the entirety of Northern California, and the fifth busiest in the United States of America. The city was incorporated in 1852.
Data | Crime | Cost of living | Movers | Compare
#7 most African American in California
 Located in
Alameda County, California
Located in
Alameda County, California
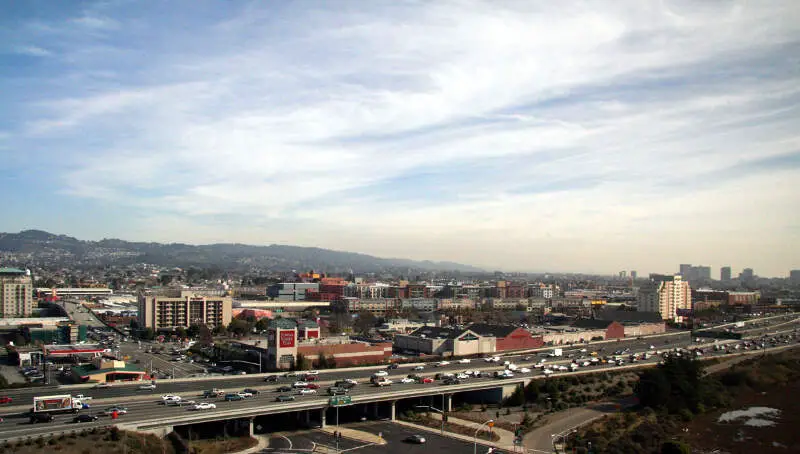
Emeryville is a small city located in northwest Alameda County, California, in the United States. It is located in a corridor between the cities of Berkeley and Oakland, extending to the shore of San Francisco Bay. Its proximity to San Francisco, the Bay Bridge, the University of California, Berkeley, and Silicon Valley has been a catalyst for recent economic growth.
Data | Crime | Cost of living | Movers
#8 most African American in California
 Located in
Los Angeles County, California
Located in
Los Angeles County, California
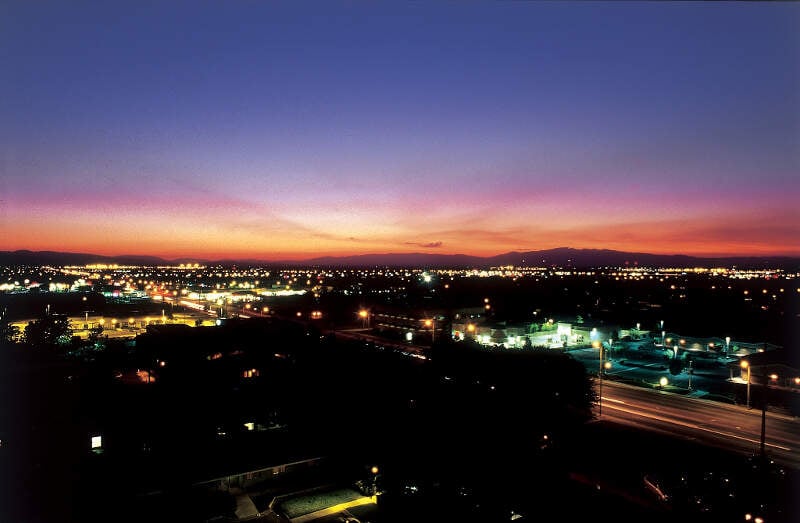
Lancaster is a charter city in northern Los Angeles County, in the Antelope Valley of the western Mojave Desert in Southern California. As of 2013, Lancaster was the 31st largest city in California. Lancaster is part of a twin city complex with its southern neighbor Palmdale and together they are the principal cities within the Antelope Valley region and California’s High Desert.
Data | Crime | Cost of living | Movers | Compare
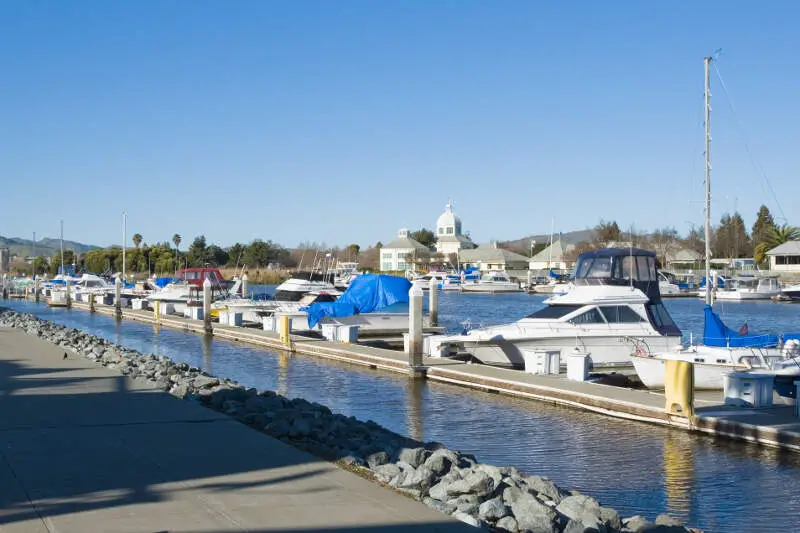
#9 most African American in California
Suisun City is a city in Solano County, California, United States. The population was 28,111 at the 2010 census. The city takes its name from the adjacent Suisun Bay, which in turn is named for the Suisunes, an indigenous tribe of the area.
Data | Crime | Cost of living | Movers
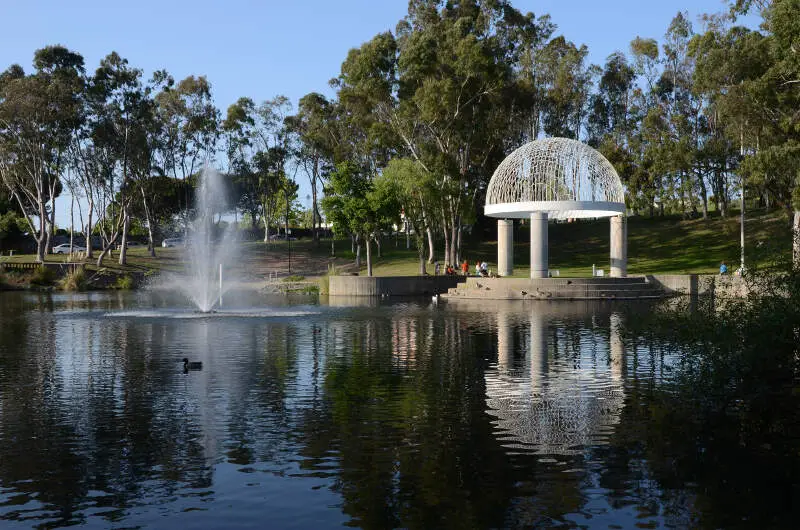
#10 most African American in California
 Located in
Contra Costa County, California
Located in
Contra Costa County, California
Hercules is a city in western Contra Costa County, California. Situated along the coast of San Pablo Bay, it is located in the eastern region of the San Francisco Bay Area, about 10 miles north of Berkeley, California. As of 2010, its population was 24,060, according to the United States Census Bureau. Hercules was founded in 1881 as a company town for the Hercules Powder Company, one of several explosive manufacturers that were active along the Pinole shoreline in the late 19th to the mid-20th century. Starting in the 1970s, Hercules was heavily redeveloped as suburban bedroom community that lies along the I-80 corridor in Eastern Contra Costa County. It has a very ethnically diverse population.
Data | Crime | Cost of living | Movers
The receipts
Compare the top ten
Pick a metric. The bars rescale. The red line is California’s statewide median.
On the map
Where California’s Black communities live
Saturday Night Science
Methodology: How We Determined The Cities In California With The Largest Black Population For 2026
We still believe in the accuracy of data — especially from the Census. So that’s where we went to get the race breakdown across California.
That leads us to the Census’s most recently available data, the 2020-2024 American Community Survey data from the US Census.
Specifically, we looked at table B03002: Hispanic OR LATINO ORIGIN BY RACE. Here are the category names as defined by the Census:
- Hispanic or Latino
- White alone*
- Black or African American alone*
- American Indian and Alaska Native alone*
- Asian alone*
- Native Hawaiian and Other Pacific Islander alone*
- Some other race alone*
- Two or more races*
Our particular column of interest was the number of people who identified as Black or African American.
We limited our analysis to non-CDPs with a population greater than 5,000 people in California. That left us with 421 cities.
We then calculated the percentage of residents that are Black or African American. The percentages ranked from 38.5% to 0.0%.
Finally, we ranked each city based on the percentage of the Black population, with a higher score being more Black than a lower score. Inglewood took the distinction of being the most Black, while Anderson was the least African American city.
We updated this article for 2026. This is our eleventh time ranking the cities in California with the largest African American population.
The full plate
African American Population By City In California
Click any column to sort. Search by city name.
| Rank | City | Population | African American Population | % African American |
|---|---|---|---|---|
| 1 | Inglewood | 104,569 | 40,277 | 38.5% |
| 2 | Hawthorne | 85,191 | 21,099 | 24.8% |
| 3 | Compton | 92,698 | 21,933 | 23.7% |
| 4 | California City | 14,414 | 3,387 | 23.5% |
| 5 | Carson | 92,871 | 20,111 | 21.7% |
| 6 | Oakland | 439,418 | 86,626 | 19.7% |
| 7 | Emeryville | 13,081 | 2,509 | 19.2% |
| 8 | Lancaster | 169,169 | 32,313 | 19.1% |
| 9 | Suisun City | 29,286 | 5,576 | 19.0% |
| 10 | Hercules | 26,302 | 4,813 | 18.3% |
| 11 | Antioch | 116,477 | 21,188 | 18.2% |
| 12 | Gardena | 59,422 | 10,250 | 17.2% |
| 13 | Vallejo | 124,268 | 21,053 | 16.9% |
| 14 | Barstow | 25,100 | 4,111 | 16.4% |
| 15 | Richmond | 115,505 | 18,583 | 16.1% |
| 16 | Adelanto | 37,964 | 6,004 | 15.8% |
| 17 | Moreno Valley | 211,666 | 32,785 | 15.5% |
| 18 | Victorville | 137,627 | 20,613 | 15.0% |
| 19 | Fairfield | 120,785 | 17,126 | 14.2% |
| 20 | Pittsburg | 76,257 | 10,464 | 13.7% |
| 21 | Palmdale | 164,634 | 21,015 | 12.8% |
| 22 | Blythe | 17,396 | 2,097 | 12.1% |
| 23 | Lemon Grove | 27,686 | 3,314 | 12.0% |
| 24 | Sacramento | 528,706 | 62,548 | 11.8% |
| 25 | Long Beach | 455,548 | 51,973 | 11.4% |
| 26 | Rialto | 104,143 | 11,764 | 11.3% |
| 27 | Stockton | 322,326 | 34,746 | 10.8% |
| 28 | San Bernardino | 222,724 | 23,592 | 10.6% |
| 29 | Bellflower | 76,819 | 8,029 | 10.5% |
| 30 | Elk Grove | 179,155 | 18,571 | 10.4% |
| 31 | Rio Vista | 10,102 | 1,036 | 10.3% |
| 32 | Corcoran | 22,491 | 2,283 | 10.2% |
| 33 | Susanville | 14,177 | 1,431 | 10.1% |
| 34 | San Pablo | 31,720 | 3,193 | 10.1% |
| 35 | Crescent City | 6,046 | 604 | 10.0% |
| 36 | Rancho Cordova | 81,849 | 8,148 | 10.0% |
| 37 | Hemet | 91,326 | 8,992 | 9.8% |
| 38 | San Leandro | 87,826 | 8,358 | 9.5% |
| 39 | East Palo Alto | 29,069 | 2,740 | 9.4% |
| 40 | Twentynine Palms | 27,355 | 2,533 | 9.3% |
| 41 | Paramount | 52,050 | 4,784 | 9.2% |
| 42 | Pinole | 18,761 | 1,685 | 9.0% |
| 43 | Desert Hot Springs | 33,200 | 2,963 | 8.9% |
| 44 | Oakley | 45,183 | 3,971 | 8.8% |
| 45 | Calipatria | 6,548 | 568 | 8.7% |
| 46 | Lynwood | 64,578 | 5,447 | 8.4% |
| 47 | Rancho Cucamonga | 175,411 | 14,634 | 8.3% |
| 48 | Vacaville | 102,596 | 8,484 | 8.3% |
| 49 | Perris | 80,511 | 6,569 | 8.2% |
| 50 | Beaumont | 56,266 | 4,585 | 8.1% |
| 51 | Los Angeles | 3,857,263 | 311,633 | 8.1% |
| 52 | Pasadena | 136,969 | 10,912 | 8.0% |
| 53 | Loma Linda | 25,122 | 1,960 | 7.8% |
| 54 | Berkeley | 120,257 | 9,284 | 7.7% |
| 55 | La Mesa | 60,797 | 4,689 | 7.7% |
| 56 | Brentwood | 65,208 | 5,020 | 7.7% |
| 57 | Marina | 22,563 | 1,731 | 7.7% |
| 58 | Fontana | 214,169 | 16,320 | 7.6% |
| 59 | Hayward | 158,801 | 12,032 | 7.6% |
| 60 | Colton | 53,772 | 4,023 | 7.5% |
| 61 | Chino | 92,652 | 6,884 | 7.4% |
| 62 | Apple Valley | 75,473 | 5,540 | 7.3% |
| 63 | Menifee | 110,305 | 7,951 | 7.2% |
| 64 | Banning | 31,093 | 2,217 | 7.1% |
| 65 | Lakewood | 79,850 | 5,611 | 7.0% |
| 66 | Soledad | 26,365 | 1,818 | 6.9% |
| 67 | Lathrop | 35,052 | 2,411 | 6.9% |
| 68 | Claremont | 36,595 | 2,508 | 6.9% |
| 69 | Culver City | 39,931 | 2,654 | 6.6% |
| 70 | Sierra Madre | 10,940 | 724 | 6.6% |
| 71 | Fresno | 545,970 | 35,606 | 6.5% |
| 72 | Lawndale | 30,781 | 1,966 | 6.4% |
| 73 | Tracy | 96,966 | 6,173 | 6.4% |
| 74 | Signal Hill | 11,468 | 721 | 6.3% |
| 75 | Lake Elsinore | 72,461 | 4,527 | 6.2% |
| 76 | Tehachapi | 11,946 | 713 | 6.0% |
| 77 | Alameda | 77,238 | 4,596 | 6.0% |
| 78 | Upland | 79,257 | 4,715 | 5.9% |
| 79 | Montclair | 37,810 | 2,244 | 5.9% |
| 80 | Riverside | 319,069 | 18,872 | 5.9% |
| 81 | Chowchilla | 19,020 | 1,117 | 5.9% |
| 82 | Ontario | 180,547 | 10,450 | 5.8% |
| 83 | El Cajon | 104,449 | 6,019 | 5.8% |
| 84 | Cerritos | 47,867 | 2,746 | 5.7% |
| 85 | Lemoore | 27,102 | 1,550 | 5.7% |
| 86 | Bakersfield | 411,986 | 23,536 | 5.7% |
| 87 | Hanford | 59,754 | 3,344 | 5.6% |
| 88 | Redlands | 73,375 | 4,093 | 5.6% |
| 89 | Highland | 56,675 | 3,141 | 5.5% |
| 90 | Monrovia | 37,571 | 2,071 | 5.5% |
| 91 | Hesperia | 100,775 | 5,549 | 5.5% |
| 92 | San Diego | 1,389,526 | 73,967 | 5.3% |
| 93 | Folsom | 83,916 | 4,446 | 5.3% |
| 94 | Pomona | 147,943 | 7,786 | 5.3% |
| 95 | Murrieta | 112,064 | 5,851 | 5.2% |
| 96 | Artesia | 15,889 | 827 | 5.2% |
| 97 | Santa Monica | 91,169 | 4,741 | 5.2% |
| 98 | El Cerrito | 25,994 | 1,343 | 5.2% |
| 99 | National City | 58,893 | 2,981 | 5.1% |
| 100 | San Jacinto | 55,180 | 2,758 | 5.0% |
Source: U.S. Census ACS 2020-2024. 421 cities with more than 5,000 residents.
Summary
Summary: Black Populations Across California
If you’re looking for a breakdown of African American populations across California according to the most recent data, this is an accurate list.
The blackest cities in California are Inglewood, Hawthorne, Compton, California City, Carson, Oakland, Emeryville, Lancaster, Suisun City, and Hercules. Not sold on California? Take the two-minute Find Your Place quiz and see which state actually fits you.
Questions and answers
Cities In California With The Largest Black Population FAQs
What city in California has the largest Black population share?
Inglewood has the largest Black population share in California for 2026, at 38.5% of residents. Hawthorne and Compton are next.
What are the most African American cities in California?
The California cities with the largest Black population shares are Inglewood, Hawthorne, Compton, California City, Carson, Oakland, Emeryville, Lancaster, Suisun City, and Hercules. We ranked all 421 places with more than 5,000 residents by their Black share of the population.
What percent of California is Black?
California is 5.2% Black, which works out to 2,040,095 residents. That makes it the 29th blackest state in the country.
What is the least African American city in California?
Anderson has the smallest Black population share in California, at 0.0%. It sits at the opposite end of the same ranking.
Where does this data come from?
Every share is calculated from the Census Bureau’s American Community Survey (2020-2024), based on residents identifying as Black or African American. We rank each California place with more than 5,000 residents.



