Most African American cities in Indiana research summary. We used Saturday Night Science to analyze Indiana’s most recent Census data to determine the cities with the largest Black population, based on the percentage of Black residents.
The city with the largest African American population in Indiana is Gary (75.7% Black); the least is New Whiteland (0.0%). Statewide, Indiana is 9.1% Black — the 22nd blackest state in the country.
Roughly 42 million people identifying as Black or African American live in the United States, about 12% of the total population. In Indiana, the Black population is 622,085, at 9.1% of the state total.
We broke down the most recent Census data to determine the cities in Indiana with the largest African American population in 2026.
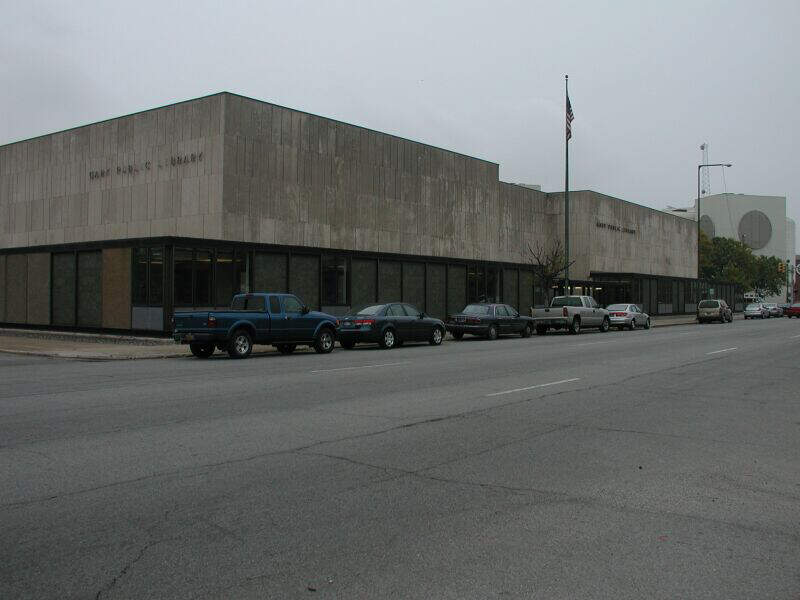
#1 most African American in Indiana
Gary is a city in Lake County, Indiana, United States, 25 miles from downtown Chicago, Illinois.
Data | Crime | Cost of living | Movers
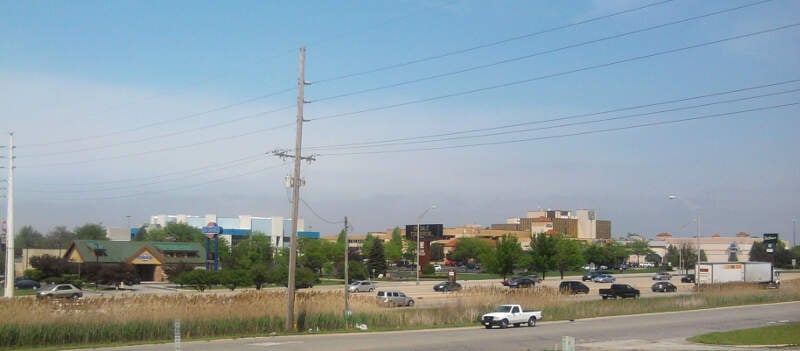
#2 most African American in Indiana
Merrillville is a town in Ross Township, Lake County, Indiana. The population was 35,246 at the 2010 census. Merrillville is located in the east-central portion of Lake County, in the Chicago metropolitan area. On January 1, 2015, Merrillville became the most populated town in Indiana, as Fishers in Hamilton County was converted from a town to a city.
Data | Crime | Cost of living | Movers
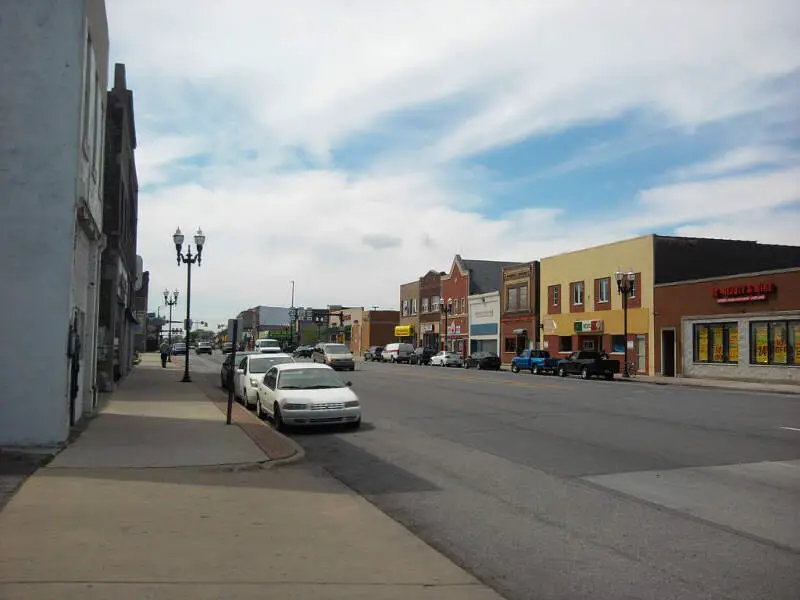
#3 most African American in Indiana
East Chicago is a city in Lake County, Indiana, United States. The population was 29,698 at the 2010 census. It is the home of Marktown, Clayton Mark’s planned worker community.
Data | Crime | Cost of living | Movers
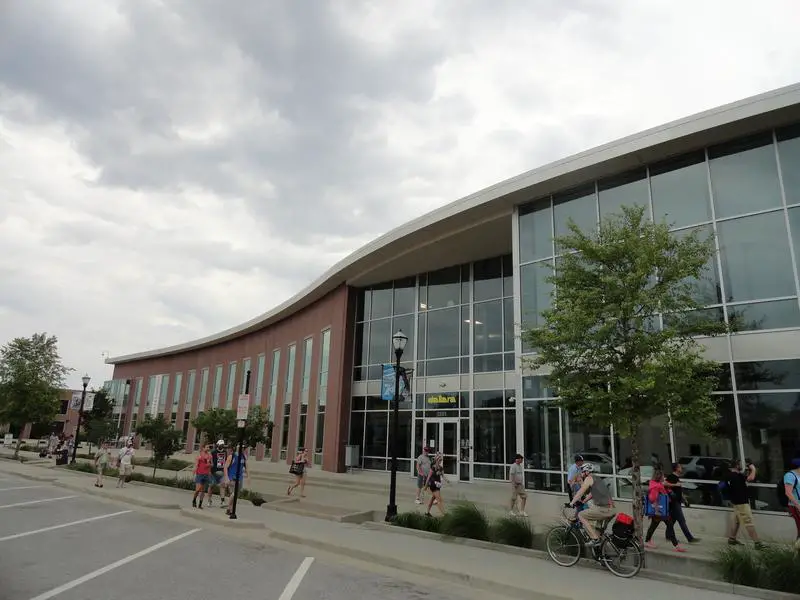
#4 most African American in Indiana
Speedway is a town in Wayne Township, Marion County, Indiana, United States. The population was 11,812 at the 2010 census. Speedway is home of the Indianapolis Motor Speedway; it is an enclave of Indianapolis.
Data | Crime | Cost of living | Movers
#5 most African American in Indiana
Lawrence is a city in Marion County, Indiana, United States. It is one of four “excluded cities” in Marion County. The city is home to Fort Benjamin Harrison within Fort Harrison State Park. The population was 46,001 at the 2010 census. The city is also adjacent to the east side of Indianapolis.
Data | Crime | Cost of living | Movers
#6 most African American in Indiana
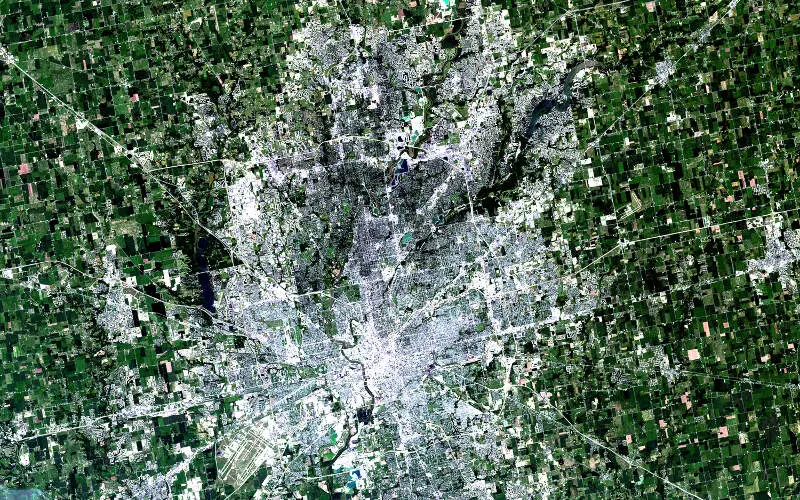
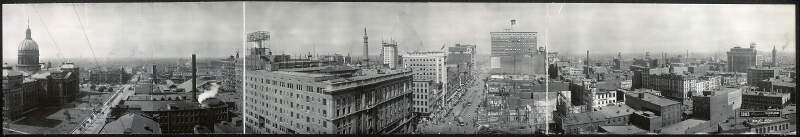
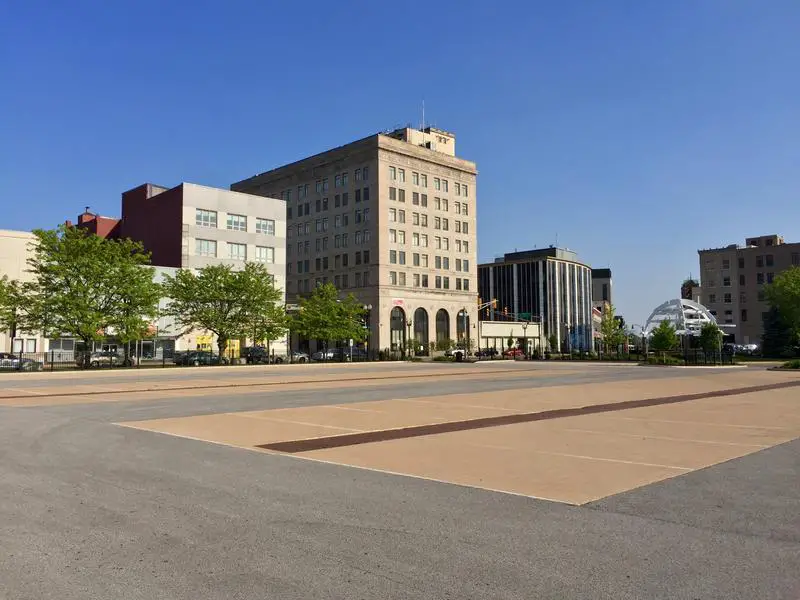
Indianapolis is the capital and most populous city of the U.S. state of Indiana and the seat of Marion County. It is in the East North Central region of the Midwestern United States. With an estimated population of 855,164 in 2016, Indianapolis is the second most populous city in the Midwest and 15th most populous in the U.S. The city is the economic and cultural center of the Indianapolis metropolitan area, home to 2 million people, the 34th most populous metropolitan statistical area in the U.S. Its combined statistical area ranks 27th, with 2.38 million inhabitants. Indianapolis covers 368 square miles, making it the 16th largest city by land area in the U.S.
Data | Crime | Cost of living | Movers | Compare
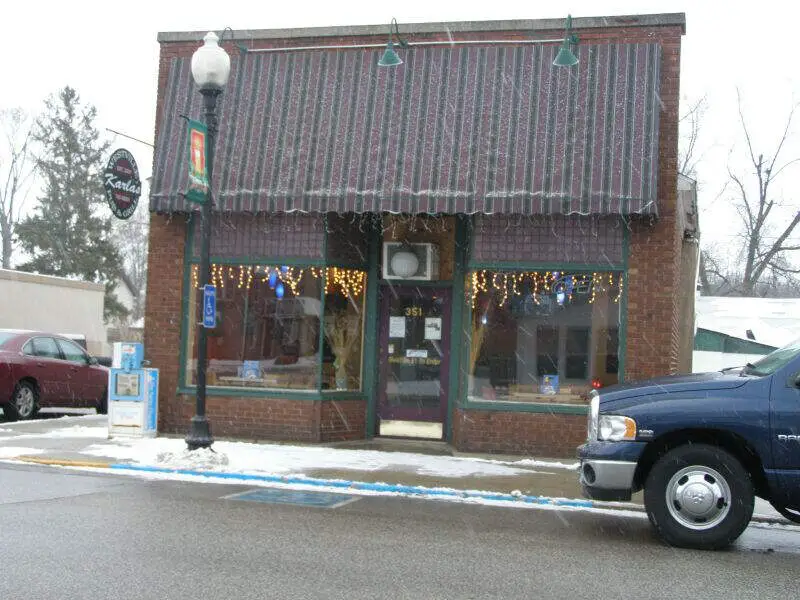
#7 most African American in Indiana
Westville is a town in New Durham Township, LaPorte County, Indiana, United States. The population was 5,853 at the 2010 census. It is included in the Michigan City, Indiana-La Porte, Indiana Metropolitan Statistical Area. Westville is located in a part of Indiana referred to by locals as The Region.
Data | Crime | Cost of living | Movers
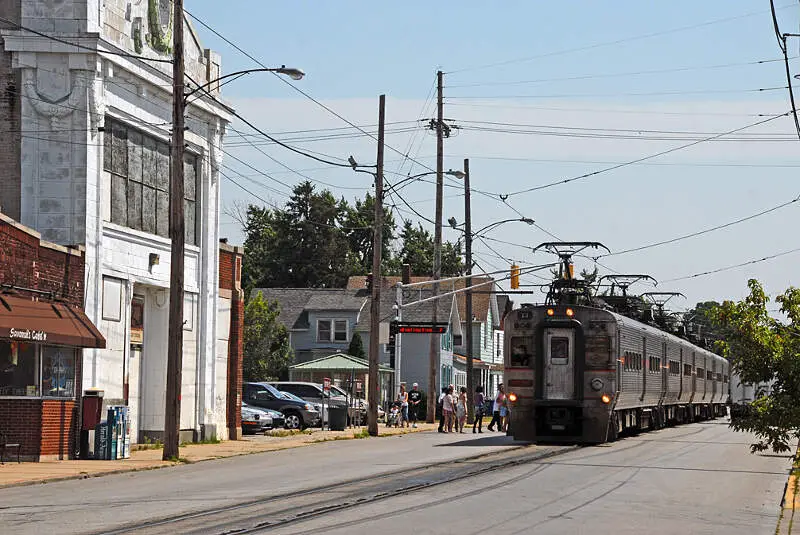
#8 most African American in Indiana
Michigan City is a city in LaPorte County, Indiana, United States. It is one of the two principal cities of the Michigan City-La Porte, Indiana Metropolitan Statistical Area, which is included in the Chicago-Naperville-Michigan City Combined Statistical Area.
Data | Crime | Cost of living | Movers
#9 most African American in Indiana
Hammond is a city in Lake County, Indiana, United States. It is part of the Chicago metropolitan area. First settled in the mid-19th century, it is one of the oldest cities of northern Lake County. As of the 2010 United States census, it is also the largest in population: the 2010 population was 80,830, replacing Gary as the most populous city in Lake County. From north to south, Hammond runs from Lake Michigan down to the Little Calumet River; from east to west along its southern border, it runs from the Illinois state line to Cline Avenue. The city is traversed by numerous railroads and expressways, including the South Shore Line, Borman Expressway, and Indiana Toll Road.
Data | Crime | Cost of living | Movers
#10 most African American in Indiana
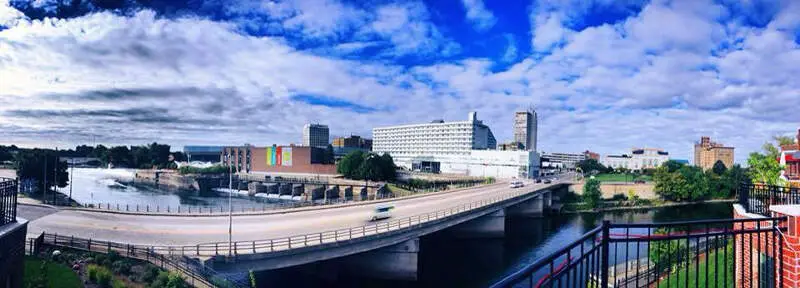
South Bend is a city in and the county seat of St. Joseph County, Indiana, United States, on the St. Joseph River near its southernmost bend, from which it derives its name. As of the 2010 census, the city had a total of 101,168 residents; its Metropolitan Statistical Area had a population of 318,586 and Combined Statistical Area of 721,296. It is the fourth-largest city in Indiana, serving as the economic and cultural hub of Northern Indiana. The highly ranked University of Notre Dame is located just to the north in unincorporated Notre Dame, Indiana and is an integral contributor to the region’s economy.
Data | Crime | Cost of living | Movers | Compare
The receipts
Compare the top ten
Pick a metric. The bars rescale. The red line is Indiana’s statewide median.
On the map
Where Indiana’s Black communities live
Saturday Night Science
Methodology: How We Determined The Cities In Indiana With The Largest Black Population For 2026
We still believe in the accuracy of data — especially from the Census. So that’s where we went to get the race breakdown across Indiana.
That leads us to the Census’s most recently available data, the 2020-2024 American Community Survey data from the US Census.
Specifically, we looked at table B03002: Hispanic OR LATINO ORIGIN BY RACE. Here are the category names as defined by the Census:
- Hispanic or Latino
- White alone*
- Black or African American alone*
- American Indian and Alaska Native alone*
- Asian alone*
- Native Hawaiian and Other Pacific Islander alone*
- Some other race alone*
- Two or more races*
Our particular column of interest was the number of people who identified as Black or African American.
We limited our analysis to non-CDPs with a population greater than 5,000 people in Indiana. That left us with 112 cities.
We then calculated the percentage of residents that are Black or African American. The percentages ranked from 75.7% to 0.0%.
Finally, we ranked each city based on the percentage of the Black population, with a higher score being more Black than a lower score. Gary took the distinction of being the most Black, while New Whiteland was the least African American city.
We updated this article for 2026. This is our eleventh time ranking the cities in Indiana with the largest African American population.
The full plate
African American Population By City In Indiana
Click any column to sort. Search by city name.
| Rank | City | Population | African American Population | % African American |
|---|---|---|---|---|
| 1 | Gary | 68,113 | 51,585 | 75.7% |
| 2 | Merrillville | 36,476 | 16,811 | 46.1% |
| 3 | East Chicago | 26,022 | 9,386 | 36.1% |
| 4 | Speedway | 13,968 | 4,545 | 32.5% |
| 5 | Lawrence | 49,517 | 14,076 | 28.4% |
| 6 | Indianapolis | 885,860 | 244,161 | 27.6% |
| 7 | Westville | 5,279 | 1,337 | 25.3% |
| 8 | Michigan City | 31,814 | 7,580 | 23.8% |
| 9 | Hammond | 76,768 | 17,292 | 22.5% |
| 10 | South Bend | 103,085 | 23,141 | 22.4% |
| 11 | Griffith | 16,273 | 2,364 | 14.5% |
| 12 | Hobart | 29,558 | 4,235 | 14.3% |
| 13 | Fort Wayne | 268,589 | 37,558 | 14.0% |
| 14 | Avon | 23,437 | 3,228 | 13.8% |
| 15 | Brownsburg | 31,215 | 3,883 | 12.4% |
| 16 | Elkhart | 53,733 | 6,670 | 12.4% |
| 17 | Jeffersonville | 51,043 | 6,103 | 12.0% |
| 18 | Evansville | 116,116 | 13,643 | 11.7% |
| 19 | Plainfield | 36,369 | 4,256 | 11.7% |
| 20 | Anderson | 55,367 | 6,436 | 11.6% |
| 21 | Mishawaka | 51,021 | 5,471 | 10.7% |
| 22 | Cumberland | 6,267 | 656 | 10.5% |
| 23 | Lafayette | 71,159 | 7,356 | 10.3% |
| 24 | Kokomo | 59,122 | 5,868 | 9.9% |
| 25 | Marion | 27,531 | 2,691 | 9.8% |
| 26 | Portage | 38,082 | 3,546 | 9.3% |
| 27 | Clarksville | 22,016 | 1,925 | 8.7% |
| 28 | Terre Haute | 58,427 | 5,076 | 8.7% |
| 29 | Highland | 23,680 | 2,050 | 8.7% |
| 30 | Muncie | 64,751 | 5,217 | 8.1% |
| 31 | Crown Point | 34,393 | 2,728 | 7.9% |
| 32 | New Albany | 37,581 | 2,884 | 7.7% |
| 33 | Schererville | 29,701 | 2,278 | 7.7% |
| 34 | Munster | 23,733 | 1,754 | 7.4% |
| 35 | Beech Grove | 14,913 | 1,089 | 7.3% |
| 36 | Richmond | 35,581 | 2,203 | 6.2% |
| 37 | Greenwood | 66,029 | 3,704 | 5.6% |
| 38 | Greencastle | 9,864 | 504 | 5.1% |
| 39 | Noblesville | 73,362 | 3,697 | 5.0% |
| 40 | Princeton | 8,372 | 412 | 4.9% |
| 41 | Bloomington | 80,049 | 3,939 | 4.9% |
| 42 | Zionsville | 32,095 | 1,518 | 4.7% |
| 43 | New Haven | 15,698 | 660 | 4.2% |
| 44 | La Porte | 22,449 | 897 | 4.0% |
| 45 | Washington | 12,367 | 447 | 3.6% |
| 46 | New Castle | 17,367 | 607 | 3.5% |
| 47 | Vincennes | 16,586 | 577 | 3.5% |
| 48 | West Lafayette | 45,159 | 1,567 | 3.5% |
| 49 | Valparaiso | 34,733 | 1,148 | 3.3% |
| 50 | Charlestown | 8,294 | 270 | 3.3% |
| 51 | Carmel | 101,651 | 3,087 | 3.0% |
| 52 | Peru | 10,901 | 320 | 2.9% |
| 53 | Franklin | 26,168 | 717 | 2.7% |
| 54 | Lake Station | 13,185 | 336 | 2.5% |
| 55 | Shelbyville | 20,296 | 515 | 2.5% |
| 56 | Tipton | 5,280 | 132 | 2.5% |
| 57 | Columbus | 51,824 | 1,295 | 2.5% |
| 58 | Nappanee | 6,815 | 169 | 2.5% |
| 59 | Dyer | 16,400 | 391 | 2.4% |
| 60 | Goshen | 34,420 | 798 | 2.3% |
| 61 | Rensselaer | 5,573 | 129 | 2.3% |
| 62 | St. John | 22,567 | 520 | 2.3% |
| 63 | Madison | 12,223 | 266 | 2.2% |
| 64 | Greenfield | 24,940 | 530 | 2.1% |
| 65 | Logansport | 17,790 | 333 | 1.9% |
| 66 | Alexandria | 5,155 | 96 | 1.9% |
| 67 | Bluffton | 10,529 | 194 | 1.8% |
| 68 | Mooresville | 9,751 | 178 | 1.8% |
| 69 | Crawfordsville | 16,491 | 292 | 1.8% |
| 70 | Rushville | 6,036 | 106 | 1.8% |
| 71 | Angola | 9,408 | 165 | 1.8% |
| 72 | Warsaw | 16,768 | 292 | 1.7% |
| 73 | Chesterton | 14,446 | 242 | 1.7% |
| 74 | Huntington | 17,030 | 239 | 1.4% |
| 75 | Tell City | 7,505 | 98 | 1.3% |
| 76 | Yor | 11,699 | 139 | 1.2% |
| 77 | Connersville | 13,109 | 142 | 1.1% |
| 78 | Rochester | 6,215 | 67 | 1.1% |
| 79 | Seymour | 22,371 | 239 | 1.1% |
| 80 | Jasper | 15,991 | 154 | 1.0% |
| 81 | Ellettsville | 6,698 | 64 | 1.0% |
| 82 | North Vernon | 7,078 | 66 | 0.9% |
| 83 | Scottsburg | 7,362 | 67 | 0.9% |
| 84 | Frankfort | 15,917 | 134 | 0.8% |
| 85 | Mount Vernon | 6,400 | 52 | 0.8% |
| 86 | Gas City | 6,076 | 47 | 0.8% |
| 87 | Batesville | 7,282 | 56 | 0.8% |
| 88 | Brazil | 7,831 | 60 | 0.8% |
| 89 | Hartford City | 5,794 | 43 | 0.7% |
| 90 | Plymouth | 10,664 | 78 | 0.7% |
| 91 | Elwood | 8,356 | 61 | 0.7% |
| 92 | Decatur | 9,811 | 68 | 0.7% |
| 93 | Lebanon | 17,812 | 113 | 0.6% |
| 94 | Sellersburg | 10,137 | 63 | 0.6% |
| 95 | Portland | 6,416 | 39 | 0.6% |
| 96 | Bedford | 13,837 | 83 | 0.6% |
| 97 | Danville | 11,714 | 61 | 0.5% |
| 98 | Huntingburg | 6,396 | 30 | 0.5% |
| 99 | Greensburg | 12,229 | 57 | 0.5% |
| 100 | Martinsville | 11,933 | 50 | 0.4% |
Source: U.S. Census ACS 2020-2024. 112 cities with more than 5,000 residents.
Summary
Summary: Black Populations Across Indiana
If you’re looking for a breakdown of African American populations across Indiana according to the most recent data, this is an accurate list.
The blackest cities in Indiana are Gary, Merrillville, East Chicago, Speedway, Lawrence, Indianapolis, Westville, Michigan City, Hammond, and South Bend. Not sold on Indiana? Take the two-minute Find Your Place quiz and see which state actually fits you.


