Most Asian cities in Arizona research summary. We analyzed Arizona’s most recent Census data to determine the most Asian cities in Arizona based on the percentage of Asian residents. Here are the results of our analysis:
-
The most Asian city in Arizona is Chandler based on the most recent Census data.
-
Chandler is 11.7% Asian.
-
The least Asian city in Arizona is Tolleson.
-
Tolleson is 0.0% Asian.
-
Arizona is 3.5% Asian.
-
Arizona is the 19th most Asian state in the United States.
Table Of Contents: Top Ten | Methodology | Summary | Table
Here are the cities in Arizona with the largest Asian population in 2026:
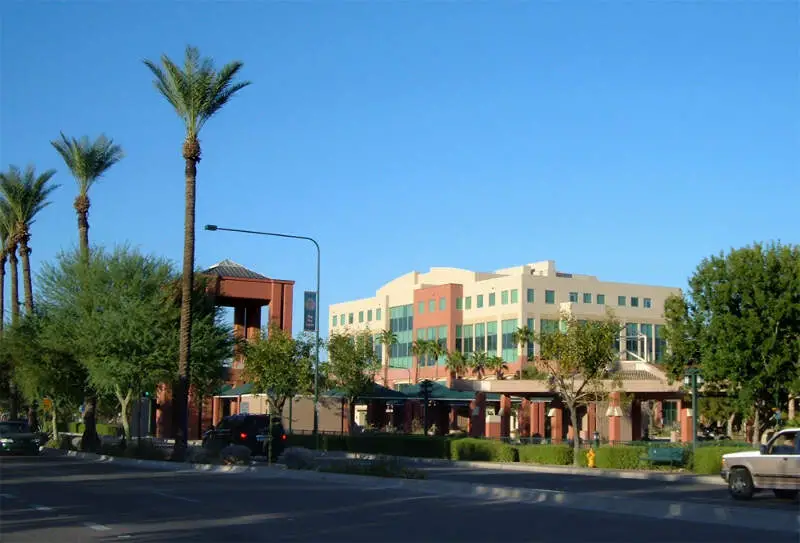
Which city in Arizona had the largest Asian population? Chandler took the number one overall spot for the largest Asian in Arizona for 2026. 11.7% of Chandler identify as Asian.
Read below to see how we crunched the numbers and how your town ranked.
To see where Arizona ranked as a state on diversity, we have a ranking of the most diverse states in America.
And if you already knew these places were Asian, check out the best places to live in Arizona or the most diverse places in Arizona.
The 10 Most Asian Cities In Arizona For 2026

/10
Population: 280,136
% Asian: 11.7%
# Of Asian Residents: 32,774
More on Chandler: Data | Crime | Cost Of Living | Movers

/10
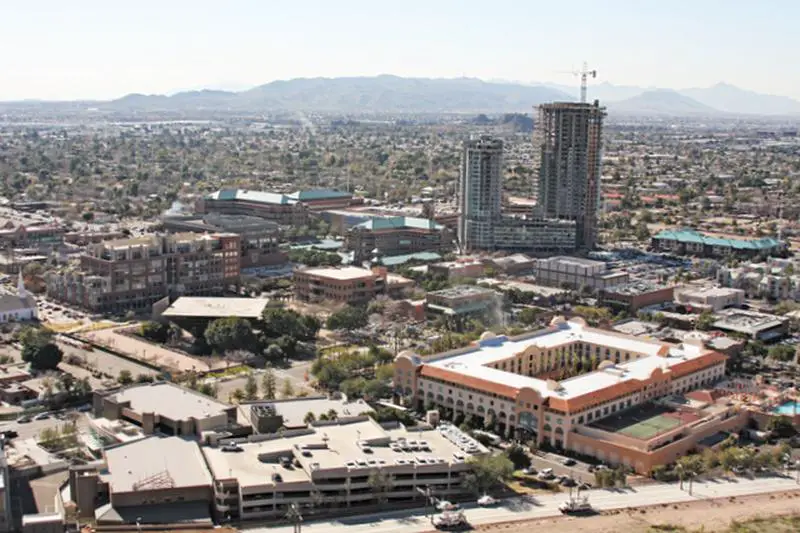
Population: 188,065
% Asian: 9.66%
# Of Asian Residents: 18,166
More on Tempe: Data | Crime | Cost Of Living | Movers

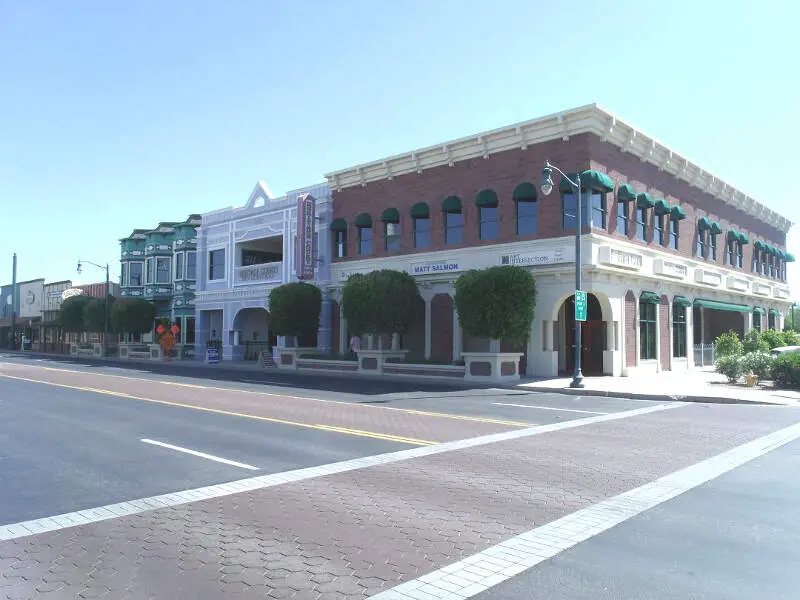
/10
Population: 280,262
% Asian: 6.66%
# Of Asian Residents: 18,661
More on Gilbert: Data | Crime | Cost Of Living | Movers

/10
Population: 196,906
% Asian: 5.28%
# Of Asian Residents: 10,401
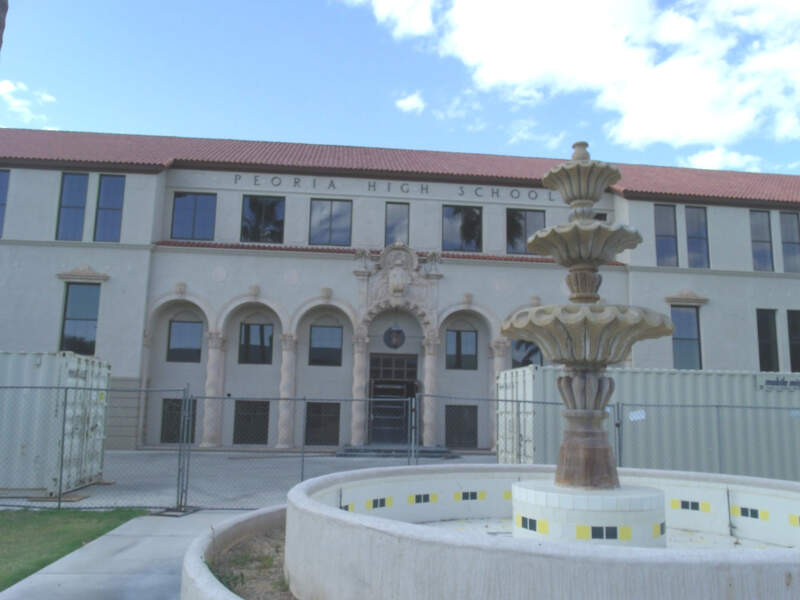
More on Peoria: Data | Crime | Cost Of Living | Movers

/10
Population: 243,821
% Asian: 4.9%
# Of Asian Residents: 11,946
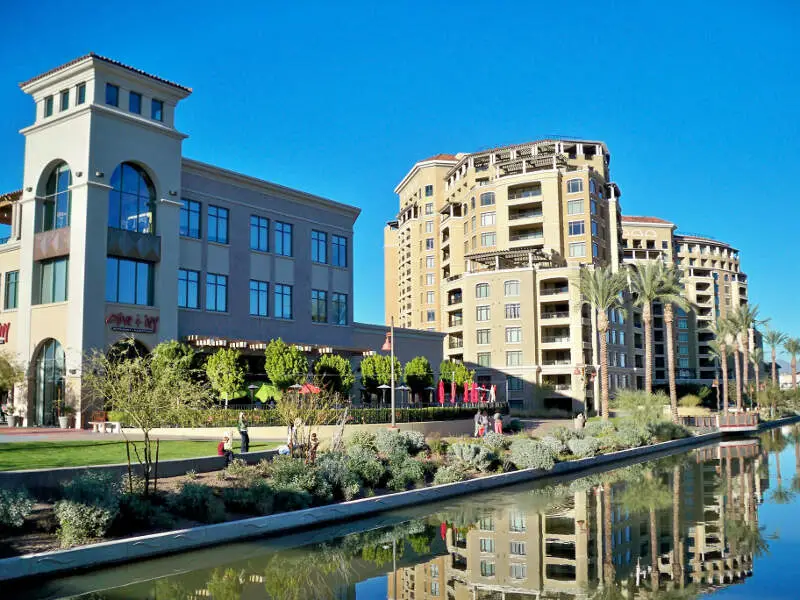
More on Scottsdale: Data | Crime | Cost Of Living | Movers

/10
Population: 6,916
% Asian: 4.87%
# Of Asian Residents: 337
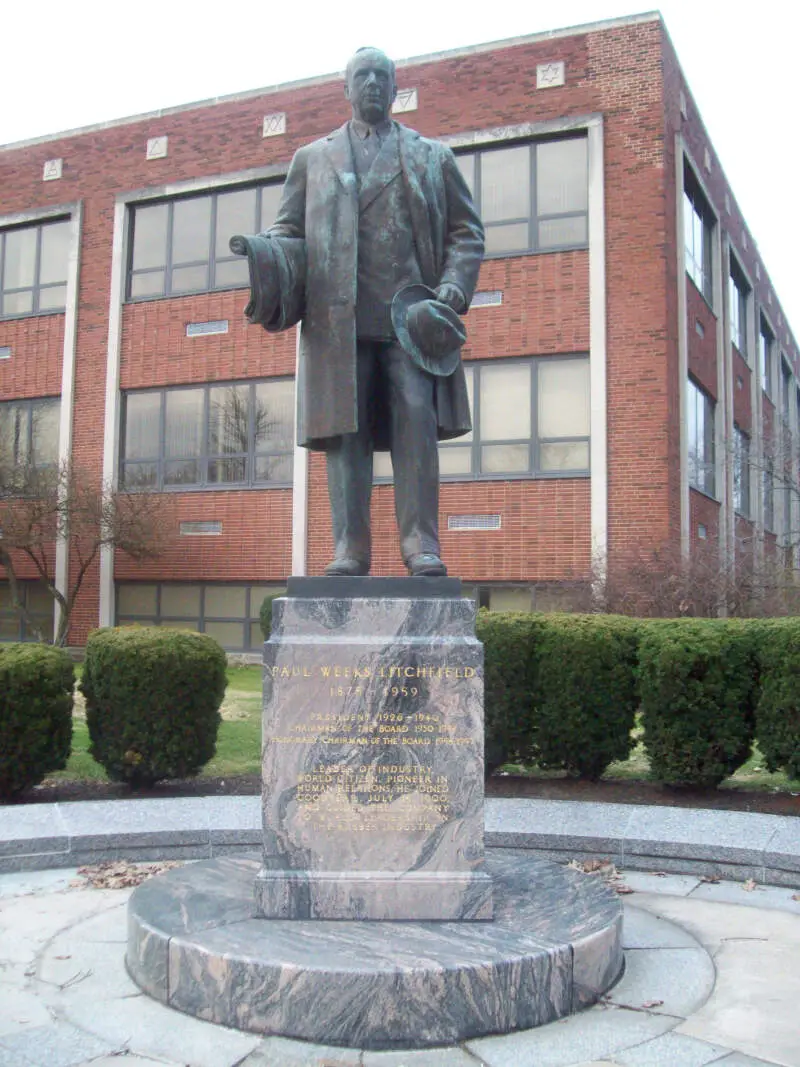
More on Litchfield Park: Data | Cost Of Living | Movers

/10
Population: 12,611
% Asian: 4.79%
# Of Asian Residents: 604
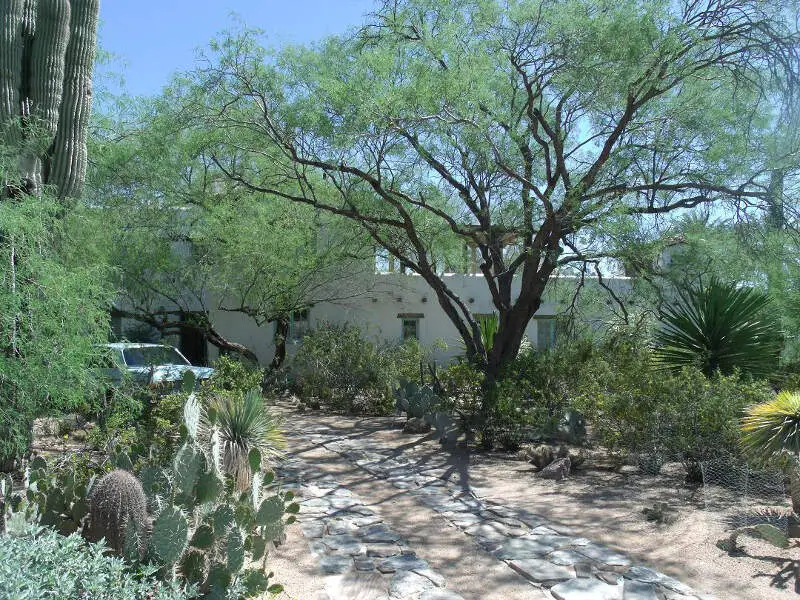
More on Paradise Valley: Data | Crime | Cost Of Living | Movers

/10
Population: 252,833
% Asian: 4.23%
# Of Asian Residents: 10,707
More on Glendale: Data | Crime | Cost Of Living | Movers

/10
Population: 92,477
% Asian: 4.1%
# Of Asian Residents: 3,795
More on Avondale: Data | Crime | Cost Of Living | Movers

/10
Population: 7,195
% Asian: 4.04%
# Of Asian Residents: 291
More on Globe: Data | Crime | Cost Of Living | Movers
Methodology: How We Determined The Cities In Arizona With The Largest Asian Population For 2026
We used Saturday Night Science to compare Census data on race across every place in Arizona.
The Census’s most recently available data comes from the 2020-2024 American Community Survey.
Specifically, we looked at table B03002: Hispanic OR LATINO ORIGIN BY RACE. Here are the category names as defined by the Census:
- Hispanic or Latino
- White alone*
- Black or African American alone*
- American Indian and Alaska Native alone*
- Asian alone*
- Native Hawaiian and Other Pacific Islander alone*
- Some other race alone*
- Two or more races*
Our particular column of interest here was the number of people who identified as Asian alone.
We limited our analysis to cities with a population greater than 5,000 people. That left us with 54 cities.
We then calculated the percentage of residents that are Asian. The percentages ranked from 11.7% to 0.0%.
Finally, we ranked each city based on the percentage of Asian population, with a higher score being more Asian than a lower score. Chandler took the distinction of being the most Asian, while Tolleson was the least Asian city.
We updated this article for 2026. This report reflects our eleventh time ranking the cities in Arizona with the largest Asian population.
Read on for more information on how the cities in Arizona ranked by population of Asian residents or, for a more general take on diversity in America, head over to our ranking of the most diverse cities in America.
Summary: Asian Populations Across Arizona
If you’re looking for a breakdown of Asian populations across Arizona according to the most recent data, this is an accurate list.
The most Asian cities in Arizona are Chandler, Tempe, Gilbert, Peoria, Scottsdale, Litchfield Park, Paradise Valley, Glendale, Avondale, and Globe.
If you’re curious enough, here are the least Asian places in Arizona:
- Tolleson
- Somerton
- Snowflake
For more Arizona reading, check out:
Table: Asian Population By City In Arizona
| Rank | City | Population | Asian Population | % Asian |
|---|---|---|---|---|
| 1 | Chandler | 280,136 | 32,774 | 11.7% |
| 2 | Tempe | 188,065 | 18,166 | 9.66% |
| 3 | Gilbert | 280,262 | 18,661 | 6.66% |
| 4 | Peoria | 196,906 | 10,401 | 5.28% |
| 5 | Scottsdale | 243,821 | 11,946 | 4.9% |
| 6 | Litchfield Park | 6,916 | 337 | 4.87% |
| 7 | Paradise Valley | 12,611 | 604 | 4.79% |
| 8 | Glendale | 252,833 | 10,707 | 4.23% |
| 9 | Avondale | 92,477 | 3,795 | 4.1% |
| 10 | Globe | 7,195 | 291 | 4.04% |
| 11 | Oro Valley | 48,162 | 1,938 | 4.02% |
| 12 | Phoenix | 1,642,323 | 65,942 | 4.02% |
| 13 | Marana | 56,938 | 2,107 | 3.7% |
| 14 | Sierra Vista | 45,155 | 1,591 | 3.52% |
| 15 | Goodyear | 107,645 | 3,519 | 3.27% |
| 16 | Tucson | 547,073 | 17,022 | 3.11% |
| 17 | Maricopa | 67,163 | 2,073 | 3.09% |
| 18 | Queen Creek | 71,867 | 1,984 | 2.76% |
| 19 | Youn | 7,015 | 192 | 2.74% |
| 20 | Page | 7,345 | 191 | 2.6% |
| 21 | Casa Grande | 60,905 | 1,521 | 2.5% |
| 22 | Mesa | 511,764 | 12,492 | 2.44% |
| 23 | Surprise | 154,948 | 3,780 | 2.44% |
| 24 | Flagstaff | 76,445 | 1,771 | 2.32% |
| 25 | Fountain Hills | 23,789 | 510 | 2.14% |
| 26 | Prescott | 47,400 | 991 | 2.09% |
| 27 | Sedona | 9,777 | 193 | 1.97% |
| 28 | Apache Junction | 41,058 | 709 | 1.73% |
| 29 | Yuma | 100,139 | 1,708 | 1.71% |
| 30 | Kingman | 34,375 | 569 | 1.66% |
| 31 | Bullhead City | 42,496 | 657 | 1.55% |
| 32 | Prescott Valley | 49,179 | 609 | 1.24% |
| 33 | Sahuarita | 35,862 | 414 | 1.15% |
| 34 | Show Low | 12,102 | 136 | 1.12% |
| 35 | Guadalupe | 5,272 | 58 | 1.1% |
| 36 | El Mirage | 36,088 | 342 | 0.95% |
| 37 | Eloy | 17,433 | 146 | 0.84% |
| 38 | Lake Havasu City | 58,359 | 382 | 0.65% |
| 39 | Payson | 16,622 | 93 | 0.56% |
| 40 | Winslow | 8,773 | 48 | 0.55% |
| 41 | Florence | 25,570 | 135 | 0.53% |
| 42 | Cottonwood | 12,580 | 66 | 0.52% |
| 43 | Safford | 10,239 | 53 | 0.52% |
| 44 | Douglas | 15,981 | 78 | 0.49% |
| 45 | Wickenburg | 8,059 | 36 | 0.45% |
| 46 | Coolidge | 16,636 | 73 | 0.44% |
| 47 | Benson | 5,417 | 19 | 0.35% |
| 48 | Chino Valley | 13,602 | 46 | 0.34% |
| 49 | Nogales | 19,841 | 66 | 0.33% |
| 50 | Camp Verde | 12,521 | 9 | 0.07% |
| 51 | San Luis | 37,337 | 23 | 0.06% |
| 52 | Snowflake | 6,444 | 0 | 0.0% |
| 53 | Somerton | 14,574 | 0 | 0.0% |
| 54 | Tolleson | 7,668 | 0 | 0.0% |