Most Asian cities in Washington research summary. We analyzed Washington’s most recent Census data to determine the most Asian cities in Washington based on the percentage of Asian residents.
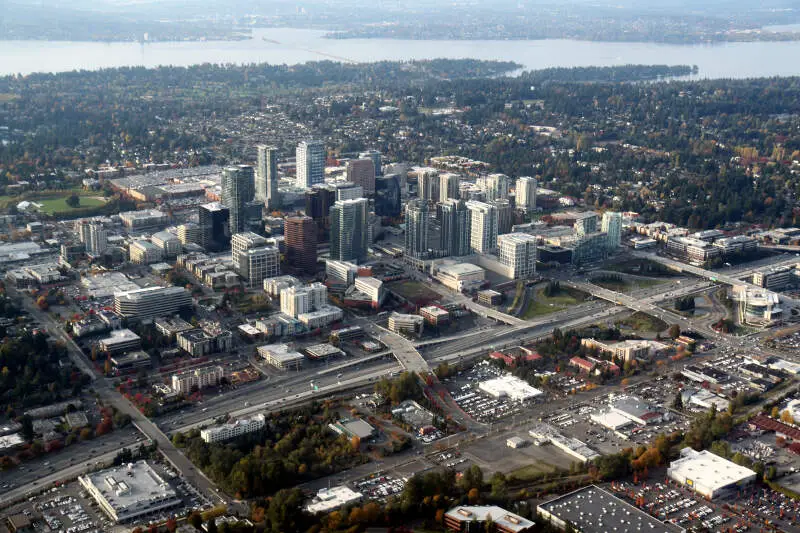
42.7% Asian · #1 most Asian in Washington
Data | Crime | Cost of living | Movers
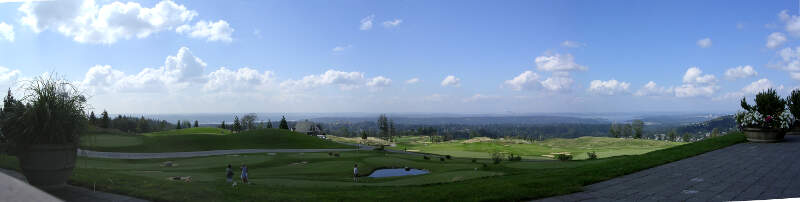
42.1% Asian · #2 most Asian in Washington
Newcastle is an Eastside city in King County, Washington, United States. Its population was 10,380 at the 2010 census.
Data | Crime | Cost of living | Movers
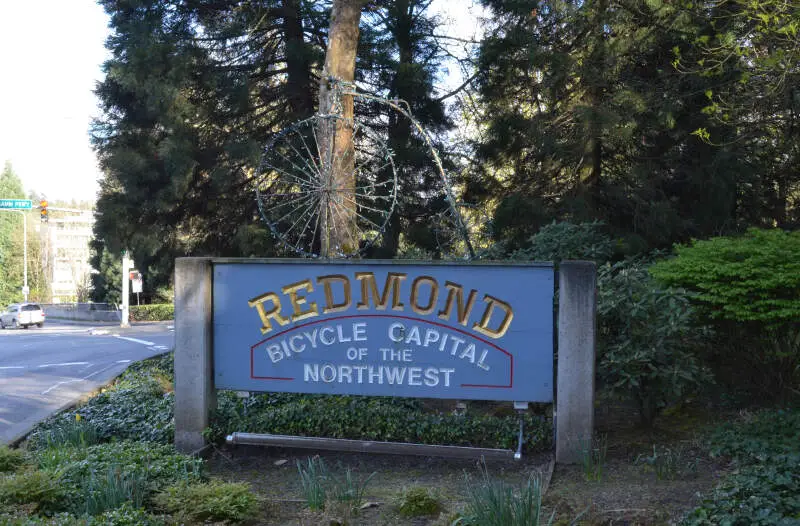
40.2% Asian · #3 most Asian in Washington
Redmond is a city in King County, Washington, United States, located 16 miles east of Seattle, within the high-tech enclave of Seattle metropolitan area. The population is 62,458 in 2016, an increase from the 2010 census, up from 45,256 in the 2000 census. Redmond is commonly recognized as the home of Microsoft and Nintendo of America. With an annual bike race on city streets and the state’s only velodrome, Redmond is also known as the “Bicycle Capital of the Northwest”.
Data | Crime | Cost of living | Movers
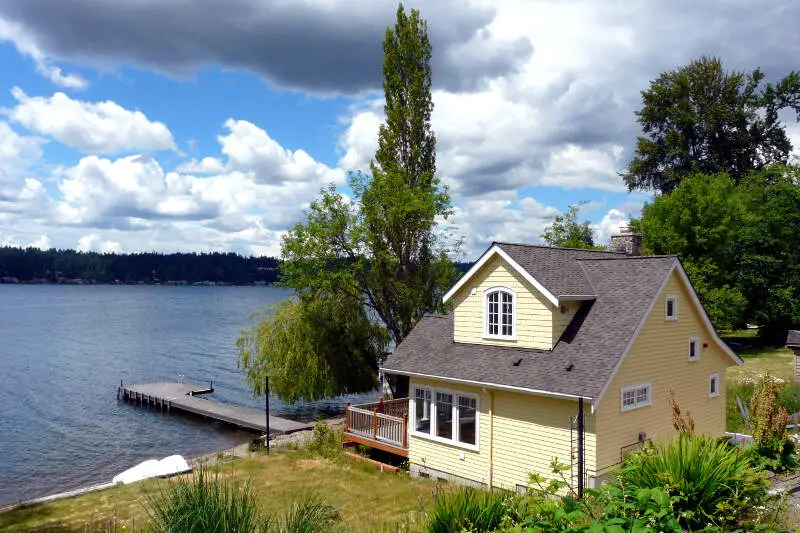
37.1% Asian · #4 most Asian in Washington
Sammamish is a city in King County, Washington, United States. The population was 63,773 in a 2016 census estimate. Located on a plateau, the city is bordered by Lake Sammamish to the west and the Snoqualmie Valley to the east.
Data | Crime | Cost of living | Movers
26.6% Asian · #5 most Asian in Washington
Issaquah is a city in King County, Washington, United States. The population was 37,322 in a 2016 census estimate. Located in a valley and bisected by Interstate 90, the city is bordered by the Sammamish Plateau to the north and the Issaquah Alps to the south.
Data | Crime | Cost of living | Movers
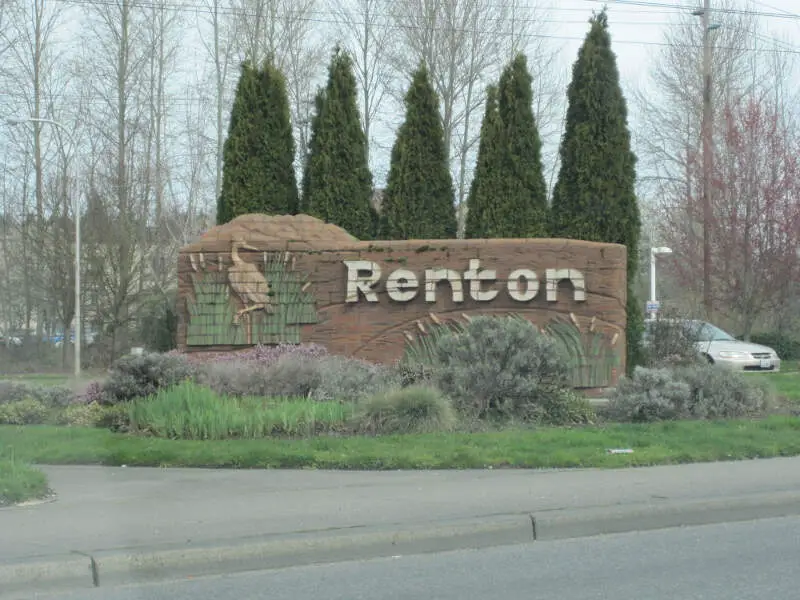
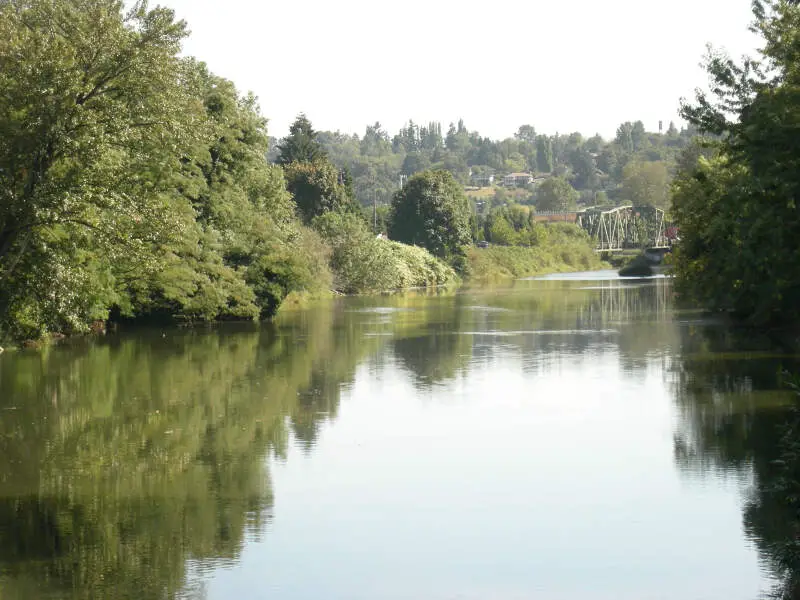
26.4% Asian · #6 most Asian in Washington
Renton is a city in King County, Washington, United States. Situated 11 miles southeast of downtown Seattle, Washington, Renton straddles the southeast shore of Lake Washington, at the mouth of the Cedar River. While long an important salmon fishing area for Native Americans, Renton was first settled by people of European descent in the 1860s, and its early economy was based on coal mining, clay production, and timber export. Today, Renton is best known as the final assembly point for the Boeing 737 family of commercial airplanes, but it is also home to a growing number of well known manufacturing, technology, and healthcare organizations, including Boeing Commercial Airplanes Division, Paccar, Kaiser Permanente, IKEA, Providence Health & Services, and Wizards of the Coast. As of 2016, the population in Renton is 101,300, up from 90,927 at the 2010 census. Renton currently is the 8th largest city in Washington State, and is the 4th largest in King County. The National Football League’s Seattle Seahawks have a training facility in Renton. It is the second-largest facility in the NFL at 200,000 square feet.
Data | Crime | Cost of living | Movers
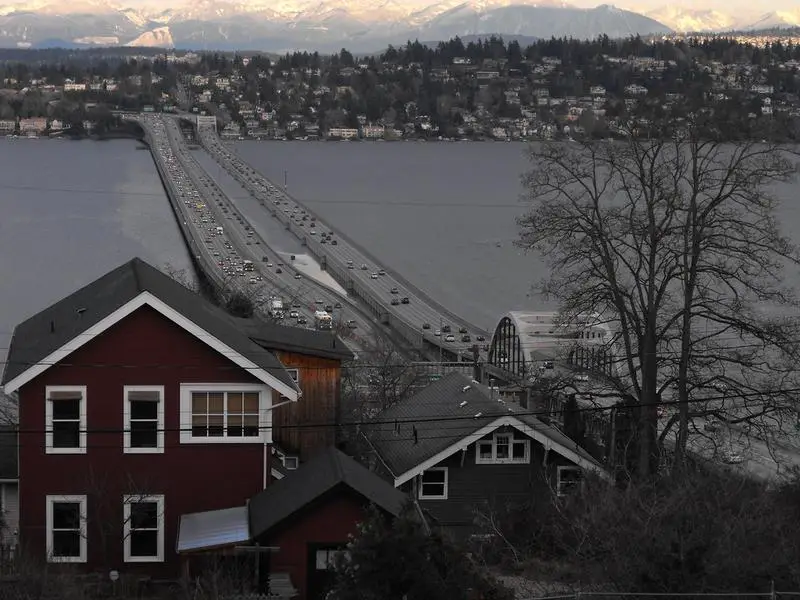
24.4% Asian · #7 most Asian in Washington
Mercer Island is a city in King County, Washington, United States located on an island of the same name in the southern portion of Lake Washington. Mercer Island is in the Seattle Metropolitan Area, with Seattle located to its west and Bellevue located to its east.
Data | Crime | Cost of living | Movers
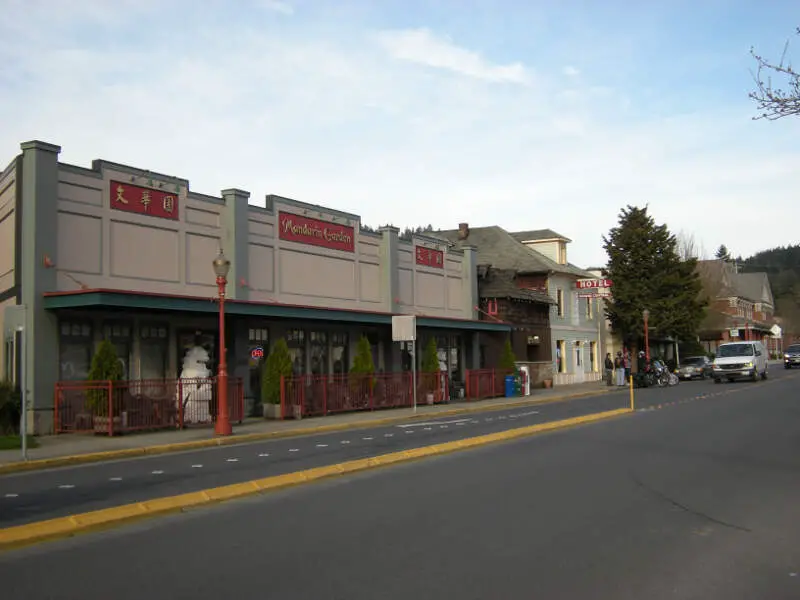
23.5% Asian · #8 most Asian in Washington
Tukwila is a suburban city in King County, Washington, United States. The northern edge of Tukwila borders the city of Seattle. The population was 19,107 at the 2010 census. The population was 20,018 at the 2015 Estimate from Office of Financial Management. The City of Tukwila is a community of communities: residents of many diverse origins make Tukwila their home, a large commercial center draws workers and consumers to the city daily, and industry thrives with the confluence of rivers, freeways, railroads, and Seattle-Tacoma International Airport.
Data | Crime | Cost of living | Movers
23.0% Asian · #9 most Asian in Washington
Kent is a city located in King County, Washington, United States. It is the sixth largest city in the state and third largest in the county. Kent is in the heart of the Seattle-Tacoma metropolitan area, located 19 miles south of Seattle and 19 miles northeast of Tacoma. Incorporated in 1890, it is the second oldest incorporated city in King County, after Seattle. Kent’s population as of April, 2010 was 92,411 according to the 2010 census. The total grew to an estimated 126,952 as of July 1, 2015, owing primarily to annexation.
Data | Crime | Cost of living | Movers
20.3% Asian · #10 most Asian in Washington
Mill Creek is a city in Snohomish County, Washington, United States. It is located approximately 20 miles north-northeast of downtown Seattle and is part of the Seattle metropolitan area. The 2010 census population was 18,244. Mill Creek was originally a planned community built around a golf course and country club as its centerpiece.
Data | Crime | Cost of living | Movers
The receipts
Compare the top ten
Pick a metric. The bars rescale. The red line is Washington’s statewide median.
On the map
Where Washington’s Asian communities live
Saturday Night Science
Methodology: How We Determined The Cities In Washington With The Largest Asian Population For 2026
We used Saturday Night Science to compare Census data on race across every place in Washington.
The Census’s most recently available data comes from the 2020-2024 American Community Survey.
Specifically, we looked at table B03002: Hispanic OR LATINO ORIGIN BY RACE. Here are the category names as defined by the Census:
- Hispanic or Latino
- White alone*
- Black or African American alone*
- American Indian and Alaska Native alone*
- Asian alone*
- Native Hawaiian and Other Pacific Islander alone*
- Some other race alone*
- Two or more races*
Our particular column of interest here was the number of people who identified as Asian alone.
We limited our analysis to cities with a population greater than 6,000 people. That left us with 115 cities.
We then calculated the percentage of residents that are Asian. The percentages ranked from 42.7% to 0.1%.
Finally, we ranked each city based on the percentage of Asian population, with a higher percentage being more Asian. Bellevue took the distinction of being the most Asian, while Ephrata was the least Asian city.
We updated this article for 2026. This report reflects our eleventh time ranking the cities in Washington with the largest Asian population.
The full plate
Cities In Washington By Asian Population
Click any column to sort. Search by city name.
| Rank | City | Population | Asian Population | % Asian |
|---|---|---|---|---|
| 1 | Bellevue | 151,847 | 64,808 | 42.7% |
| 2 | Newcastle | 12,989 | 5,462 | 42.1% |
| 3 | Redmond | 77,353 | 31,124 | 40.2% |
| 4 | Sammamish | 66,463 | 24,688 | 37.1% |
| 5 | Issaquah | 39,591 | 10,538 | 26.6% |
| 6 | Renton | 105,317 | 27,852 | 26.4% |
| 7 | Mercer Island | 25,307 | 6,175 | 24.4% |
| 8 | Tukwila | 21,451 | 5,040 | 23.5% |
| 9 | Kent | 135,603 | 31,144 | 23.0% |
| 10 | Mill Creek | 20,956 | 4,260 | 20.3% |
| 11 | Kirkland | 92,621 | 17,873 | 19.3% |
| 12 | Lynnwood | 40,110 | 7,709 | 19.2% |
| 13 | Woodinville | 13,438 | 2,574 | 19.2% |
| 14 | Bothell | 49,610 | 9,463 | 19.1% |
| 15 | Mukilteo | 21,323 | 3,957 | 18.6% |
| 16 | Seattle | 754,195 | 131,815 | 17.5% |
| 17 | SeaTac | 32,414 | 5,638 | 17.4% |
| 18 | Kenmore | 23,741 | 3,856 | 16.2% |
| 19 | Fife | 10,949 | 1,714 | 15.7% |
| 20 | Maple Valley | 28,287 | 4,370 | 15.4% |
| 21 | Federal Way | 99,493 | 15,260 | 15.3% |
| 22 | Burien | 51,513 | 7,894 | 15.3% |
| 23 | DuPont | 9,931 | 1,433 | 14.4% |
| 24 | Shoreline | 61,431 | 8,840 | 14.4% |
| 25 | Snoqualmie | 13,798 | 1,936 | 14.0% |
| 26 | Camas | 27,007 | 3,413 | 12.6% |
| 27 | Auburn | 85,676 | 10,334 | 12.1% |
| 28 | Des Moines | 32,823 | 3,934 | 12.0% |
| 29 | Mountlake Terrace | 23,104 | 2,667 | 11.5% |
| 30 | Duvall | 8,526 | 977 | 11.5% |
| 31 | Lake Forest Park | 13,335 | 1,496 | 11.2% |
| 32 | Covington | 21,233 | 2,316 | 10.9% |
| 33 | University Place | 34,911 | 3,747 | 10.7% |
| 34 | Pacific | 7,066 | 756 | 10.7% |
| 35 | Brier | 6,545 | 697 | 10.6% |
| 36 | Lake Stevens | 40,253 | 4,079 | 10.1% |
| 37 | Everett | 111,845 | 11,232 | 10.0% |
| 38 | Edmonds | 42,735 | 4,276 | 10.0% |
| 39 | Monroe | 19,755 | 1,878 | 9.5% |
| 40 | Oak Harbor | 24,362 | 2,309 | 9.5% |
| 41 | Pullman | 32,229 | 3,032 | 9.4% |
| 42 | Tacoma | 222,758 | 20,938 | 9.4% |
| 43 | Lacey | 57,737 | 5,328 | 9.2% |
| 44 | Marysville | 73,002 | 6,255 | 8.6% |
| 45 | Ferndale | 15,999 | 1,338 | 8.4% |
| 46 | Edgewood | 13,032 | 1,033 | 7.9% |
| 47 | Fircrest | 7,069 | 528 | 7.5% |
| 48 | Tumwater | 26,956 | 1,965 | 7.3% |
| 49 | Lakewood | 62,937 | 4,366 | 6.9% |
| 50 | Olympia | 55,951 | 3,748 | 6.7% |
| 51 | Richland | 62,753 | 3,995 | 6.4% |
| 52 | Bremerton | 44,830 | 2,841 | 6.3% |
| 53 | North Bend | 7,953 | 500 | 6.3% |
| 54 | Puyallup | 42,746 | 2,406 | 5.6% |
| 55 | Milton | 8,894 | 484 | 5.4% |
| 56 | Arlington | 21,095 | 1,135 | 5.4% |
| 57 | Vancouver | 195,300 | 10,336 | 5.3% |
| 58 | Bellingham | 93,438 | 4,888 | 5.2% |
| 59 | Normandy Park | 6,659 | 335 | 5.0% |
| 60 | Steilacoom | 6,686 | 334 | 5.0% |
| 61 | Port Orchard | 17,149 | 841 | 4.9% |
| 62 | Airway Heights | 11,245 | 478 | 4.3% |
| 63 | Bainbridge Island | 24,631 | 943 | 3.8% |
| 64 | Cheney | 12,804 | 447 | 3.5% |
| 65 | Clarkston | 7,191 | 243 | 3.4% |
| 66 | Mount Vernon | 35,377 | 1,158 | 3.3% |
| 67 | Bonney Lake | 22,090 | 721 | 3.3% |
| 68 | Orting | 8,978 | 288 | 3.2% |
| 69 | Snohomish | 10,239 | 313 | 3.1% |
| 70 | College Place | 9,854 | 297 | 3.0% |
| 71 | Sequim | 8,161 | 236 | 2.9% |
| 72 | Washougal | 17,490 | 497 | 2.8% |
| 73 | Union Gap | 6,584 | 179 | 2.7% |
| 74 | Ocean Shores | 7,302 | 197 | 2.7% |
| 75 | Ellensburg | 20,874 | 550 | 2.6% |
| 76 | Spokane | 230,293 | 5,839 | 2.5% |
| 77 | Gig Harbor | 12,424 | 312 | 2.5% |
| 78 | Sedro-Woolley | 12,831 | 321 | 2.5% |
| 79 | Burlington | 10,003 | 248 | 2.5% |
| 80 | Selah | 8,437 | 204 | 2.4% |
| 81 | Poulsbo | 12,165 | 289 | 2.4% |
| 82 | Lynden | 16,234 | 381 | 2.3% |
| 83 | Battle Ground | 21,886 | 475 | 2.2% |
| 84 | West Richland | 17,586 | 370 | 2.1% |
| 85 | Kennewick | 85,295 | 1,684 | 2.0% |
| 86 | Walla Walla | 33,925 | 663 | 2.0% |
| 87 | Liberty Lake | 12,737 | 246 | 1.9% |
| 88 | Enumclaw | 12,798 | 245 | 1.9% |
| 89 | Pasco | 79,575 | 1,436 | 1.8% |
| 90 | Spokane Valley | 106,365 | 1,834 | 1.7% |
| 91 | Longview | 38,069 | 652 | 1.7% |
| 92 | Centralia | 18,830 | 298 | 1.6% |
| 93 | Anacortes | 17,966 | 282 | 1.6% |
| 94 | Aberdeen | 17,088 | 253 | 1.5% |
| 95 | Yelm | 11,102 | 145 | 1.3% |
| 96 | Yakima | 96,961 | 1,227 | 1.3% |
| 97 | Hoquiam | 8,800 | 106 | 1.2% |
| 98 | East Wenatchee | 14,199 | 166 | 1.2% |
| 99 | Quincy | 7,998 | 93 | 1.2% |
| 100 | Toppenish | 8,723 | 93 | 1.1% |
Source: U.S. Census ACS 2020-2024. 115 cities with more than 6,000 residents.
Summary
Summary: Asian Populations Across Washington
If you’re looking for a breakdown of Asian populations across Washington according to the most recent data, this is an accurate list.
The most Asian cities in Washington are Bellevue, Newcastle, Redmond, Sammamish, Issaquah, Renton, Mercer Island, Tukwila, Kent, and Mill Creek.


