Most Hispanic/Latino cities in New York research summary. We used Saturday Night Science to analyze New York’s most recent Census data to determine the most Hispanic/Latino cities based on the percentage of Hispanic/Latino residents.
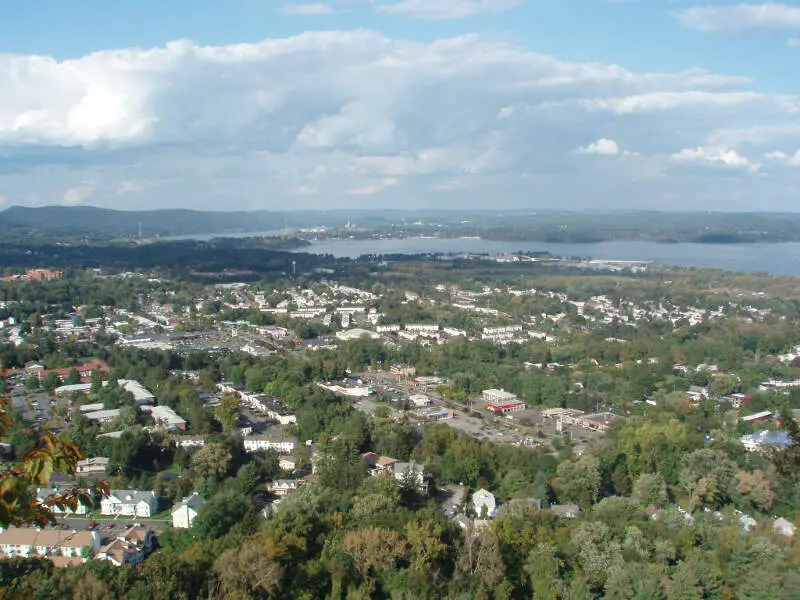
63.2% Hispanic · #1 most Hispanic in New York
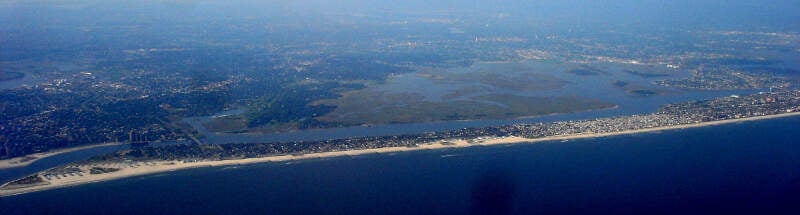
Haverstraw is a town in Rockland County, New York, United States, located north of the Town of Clarkstown and the Town of Ramapo; east of Orange County, New York; south of the Town of Stony Point; and west of the Hudson River. The town runs from the west to the east border of the county in its northern part. The population was 36,634 at the 2010 census. The name comes from the Dutch word Haverstroo meaning “oats straw”, referring to the grasslands along the river. The town contains three villages, one of which is also known as Haverstraw. Haverstraw village is the original seat of government for the town, hosting the area’s historic central downtown business district and the densest population in northern Rockland County.
Data | Crime | Cost of living | Movers
60.5% Hispanic · #2 most Hispanic in New York
Data | Crime | Cost of living | Movers
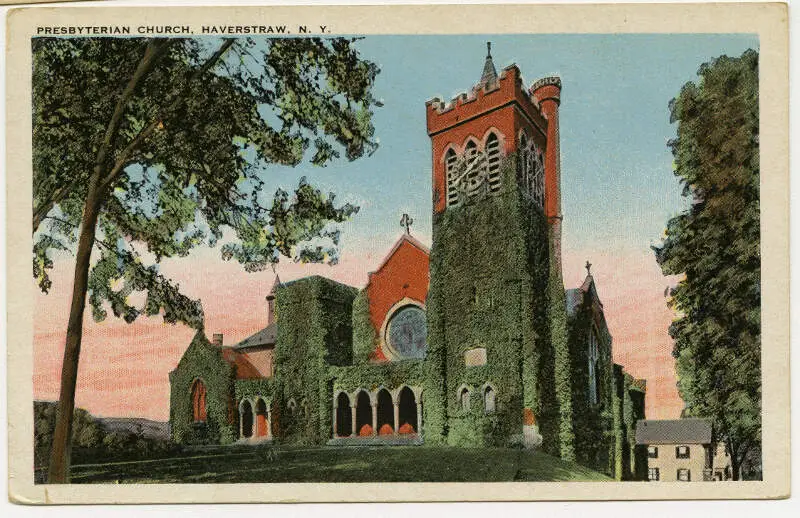
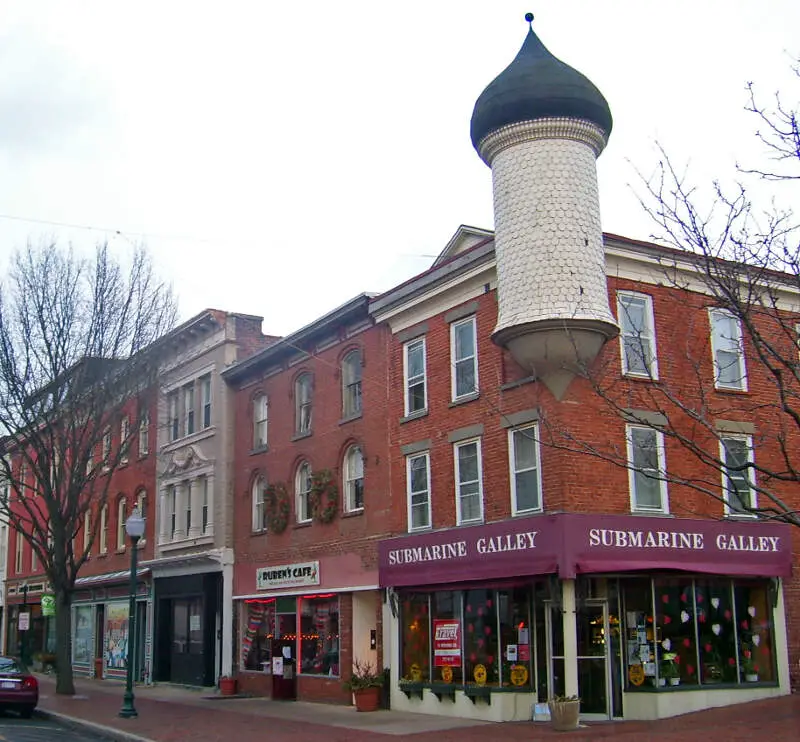
57.6% Hispanic · #3 most Hispanic in New York
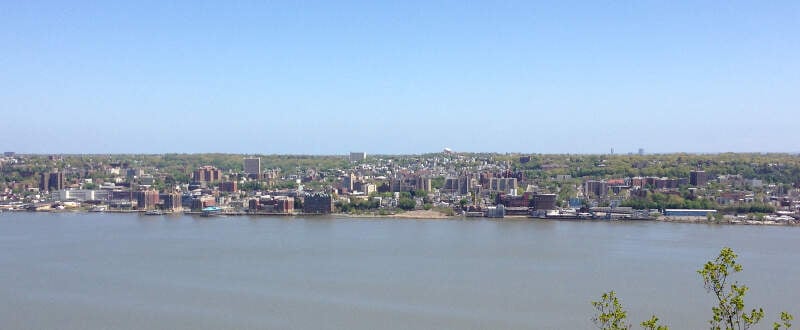
Port Chester is a village in Westchester County, New York, United States. The village is part of the town of Rye. As of the 2010 census, Port Chester had a population of 28,967. Port Chester borders on the State of Connecticut to the east. The village name is pronounced with the same syllable stress pattern as that of the county which contains it, i.e., “PORT ches-ter”, not “Port CHES-ter”.
Data | Crime | Cost of living | Movers
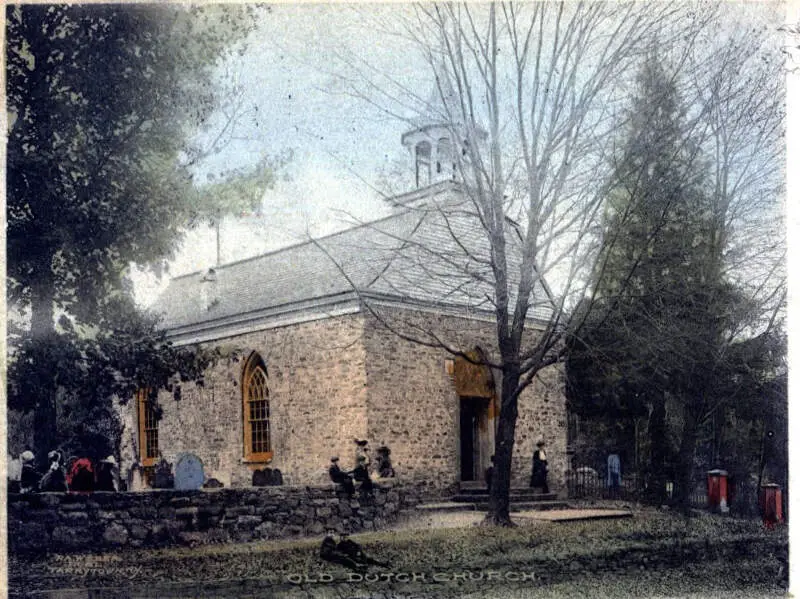
50.4% Hispanic · #4 most Hispanic in New York
Sleepy Hollow is a village in the town of Mount Pleasant, in Westchester County, New York. The village is located on the east bank of the Hudson River, about 30 miles north of New York City, and is served by the Philipse Manor stop on the Metro-North Hudson Line. To the south of Sleepy Hollow is the village of Tarrytown, and to the north and east are unincorporated parts of Mount Pleasant. The population of the village at the 2010 census was 9,870.
Data | Crime | Cost of living | Movers
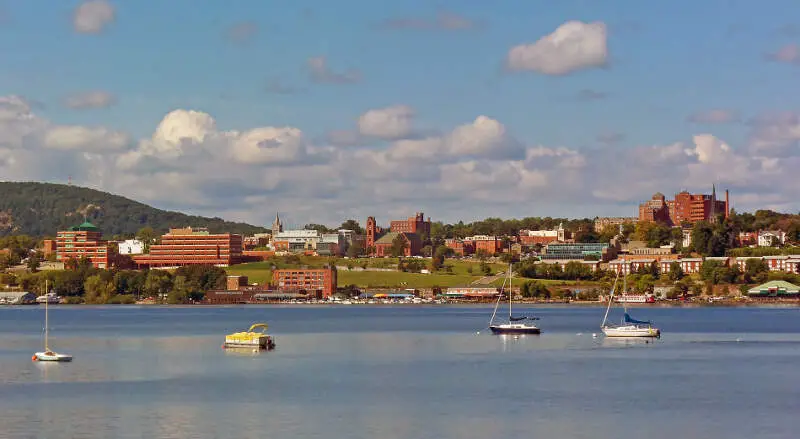
49.1% Hispanic · #5 most Hispanic in New York
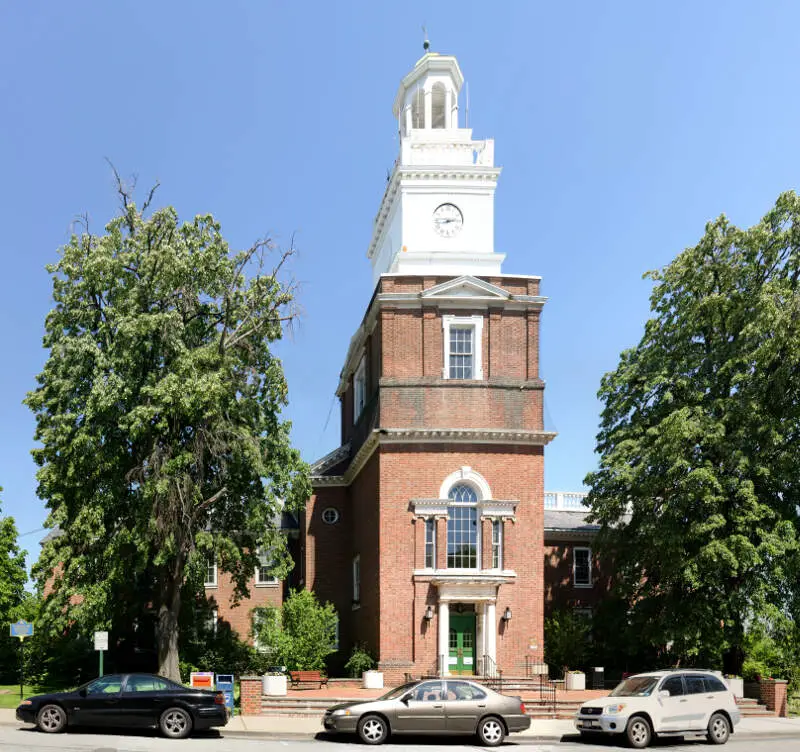
Newburgh is a city located in Orange County, New York, United States, 60 miles north of New York City, and 90 miles south of Albany, on the Hudson River. Newburgh is a part of the New York CSA. The Newburgh area was first settled in the early 18th century by the Germans and British. During the American Revolution, Newburgh served as the headquarters of the Continental Army. Prior to its chartering in 1865, the city of Newburgh was part of the town of Newburgh; the town now borders the city to the north and west. East of the city is the Hudson River; the city of Beacon, New York is across the river; and it is connected to Newburgh via the Newburgh-Beacon Bridge. The entire southern boundary of the city is with the town of New Windsor. Most of this boundary is formed by Quassaick Creek. In May 2016, the city requested help for its PFOS contaminated water supply under Superfund.
Data | Crime | Cost of living | Movers
48.2% Hispanic · #6 most Hispanic in New York
Data | Crime | Cost of living | Movers
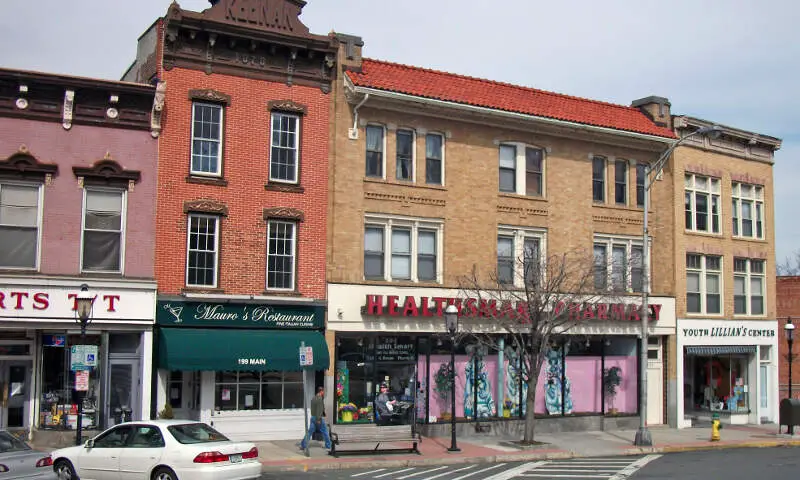
45.7% Hispanic · #7 most Hispanic in New York
Peekskill, officially the City of Peekskill, is a city in Westchester County, New York, United States, in the New York City metropolitan area. Peekskill is situated on a bay along the east side of the Hudson River, across from Jones Point. The population was 23,583 during the 2010 census.
Data | Crime | Cost of living | Movers
45.3% Hispanic · #8 most Hispanic in New York
Hempstead is one of the three towns in Nassau County, New York, United States, occupying the southwestern part of the county, in the western half of Long Island. Twenty-two incorporated villages are completely or partially within the town. Hempstead’s combined population was 759,757 at the 2010 Census, the majority of the population of the county and by far the most of any town in New York. Also, a village named Hempstead is within the Town.
Data | Crime | Cost of living | Movers
45.2% Hispanic · #9 most Hispanic in New York
Coordinates: 405629N 735152W 40.94139; -73.86444
Data | Crime | Cost of living | Movers
45.2% Hispanic · #10 most Hispanic in New York
Freeport is a village in the town of Hempstead, Nassau County, New York, USA, on the South Shore of Long Island. The population was 43,713 at the 2010 census. A settlement since the 1640s, it was once an oystering community and later a resort popular with the New York City theater community. It is now primarily a bedroom suburb but retains a modest commercial waterfront and some light industry.
Data | Crime | Cost of living | Movers
The receipts
Compare the top ten
Pick a metric. The bars rescale. The red line is New York’s statewide median.
On the map
Where New York’s Hispanic and Latino communities live
Saturday Night Science
Methodology: How We Determined The Cities In New York With The Largest Hispanic Population For 2026
We used Saturday Night Science to compare data on race from the US Census for every city in New York.
New York’s most recently available data comes from the 2020-2024 American Community Survey.
Specifically, we looked at table B03002: Hispanic OR LATINO ORIGIN BY RACE. Here are the category names as defined by the Census:
- Hispanic or Latino
- White alone*
- Black or African American alone*
- American Indian and Alaska Native alone*
- Asian alone*
- Native Hawaiian and Other Pacific Islander alone*
- Some other race alone*
- Two or more races*
Our particular column of interest here was the number of people who identified as Hispanic or Latino.
We limited our analysis to places in New York with a population greater than 5,000 people. That left us with 162 cities.
We then calculated the percentage of Hispanic or Latino residents in each New York city. The percentages ranked from 63.2% to 0.3%.
Finally, we ranked each city based on the percentage of the Hispanic or Latino population, with a higher percentage being more Hispanic or Latino. Haverstraw was the most Hispanic or Latino, while Hudson Falls was the least Hispanic or Latino city.
We updated this article for 2026. This article represents our eleventh time ranking the cities in New York with the largest Hispanic/Latino population.
The full plate
Cities In New York By Hispanic Population
Click any column to sort. Search by city name.
| Rank | City | Population | Hispanic Population | % Hispanic |
|---|---|---|---|---|
| 1 | Haverstraw | 12,325 | 7,792 | 63.2% |
| 2 | West Haverstraw | 10,711 | 6,480 | 60.5% |
| 3 | Port Chester | 31,102 | 17,929 | 57.6% |
| 4 | Sleepy Hollow | 10,887 | 5,490 | 50.4% |
| 5 | Newburgh | 28,519 | 13,998 | 49.1% |
| 6 | Ossining | 26,950 | 13,002 | 48.2% |
| 7 | Peekskill | 25,625 | 11,708 | 45.7% |
| 8 | Hempstead | 58,801 | 26,658 | 45.3% |
| 9 | Yonkers | 209,978 | 94,902 | 45.2% |
| 10 | Freeport | 44,088 | 19,913 | 45.2% |
| 11 | Middletown | 30,289 | 13,210 | 43.6% |
| 12 | Monticello | 7,279 | 2,697 | 37.1% |
| 13 | Dunkirk | 12,549 | 4,580 | 36.5% |
| 14 | Westbury | 15,808 | 5,443 | 34.4% |
| 15 | Amsterdam | 18,166 | 6,220 | 34.2% |
| 16 | Glen Cove | 28,112 | 9,290 | 33.0% |
| 17 | White Plains | 60,666 | 19,444 | 32.1% |
| 18 | Washingtonville | 5,707 | 1,825 | 32.0% |
| 19 | Wappingers Falls | 5,761 | 1,799 | 31.2% |
| 20 | Manorhaven | 6,958 | 2,092 | 30.1% |
| 21 | New Rochelle | 82,769 | 24,756 | 29.9% |
| 22 | Spring Valley | 33,192 | 9,521 | 28.7% |
| 23 | New York | 8,483,844 | 2,420,122 | 28.5% |
| 24 | Monroe | 9,515 | 2,676 | 28.1% |
| 25 | Poughkeepsie | 31,958 | 8,776 | 27.5% |
| 26 | Mamaroneck | 19,826 | 5,404 | 27.3% |
| 27 | Mount Kisco | 10,737 | 2,919 | 27.2% |
| 28 | Walden | 6,868 | 1,812 | 26.4% |
| 29 | Valley Stream | 40,315 | 9,504 | 23.6% |
| 30 | Patchogue | 12,396 | 2,764 | 22.3% |
| 31 | Port Jervis | 8,652 | 1,927 | 22.3% |
| 32 | Woodbury | 11,334 | 2,430 | 21.4% |
| 33 | Mount Vernon | 72,427 | 15,402 | 21.3% |
| 34 | Lynbrook | 20,325 | 4,277 | 21.0% |
| 35 | Pelham | 7,305 | 1,519 | 20.8% |
| 36 | Nyack | 7,393 | 1,522 | 20.6% |
| 37 | Tarr | 11,784 | 2,425 | 20.6% |
| 38 | Malverne | 8,477 | 1,740 | 20.5% |
| 39 | Beacon | 14,834 | 3,003 | 20.2% |
| 40 | Lindenhurst | 27,142 | 5,438 | 20.0% |
| 41 | Suffern | 11,441 | 2,260 | 19.8% |
| 42 | Rochester | 208,772 | 40,997 | 19.6% |
| 43 | Goshen | 5,773 | 1,080 | 18.7% |
| 44 | Amityville | 9,588 | 1,732 | 18.1% |
| 45 | Farmingdale | 8,474 | 1,423 | 16.8% |
| 46 | Harrison | 29,961 | 4,994 | 16.7% |
| 47 | Kingston | 23,911 | 3,801 | 15.9% |
| 48 | Pleasantville | 7,371 | 1,171 | 15.9% |
| 49 | Great Neck Plaza | 7,593 | 1,202 | 15.8% |
| 50 | Geneva | 12,512 | 1,932 | 15.4% |
| 51 | Cedarhurst | 7,320 | 1,127 | 15.4% |
| 52 | Tuckahoe | 6,973 | 1,054 | 15.1% |
| 53 | New Paltz | 8,314 | 1,249 | 15.0% |
| 54 | Mineola | 21,211 | 3,082 | 14.5% |
| 55 | Floral Park | 16,169 | 2,342 | 14.5% |
| 56 | Utica | 64,217 | 9,280 | 14.5% |
| 57 | Long Beach | 34,756 | 4,907 | 14.1% |
| 58 | Williston Park | 7,542 | 1,049 | 13.9% |
| 59 | East Rockaway | 10,077 | 1,321 | 13.1% |
| 60 | Irvington | 6,531 | 854 | 13.1% |
| 61 | Schenectady | 68,847 | 8,743 | 12.7% |
| 62 | Dobbs Ferry | 11,443 | 1,430 | 12.5% |
| 63 | Croton-on-Hudson | 8,202 | 1,010 | 12.3% |
| 64 | Buffalo | 276,854 | 33,987 | 12.3% |
| 65 | Fredonia | 9,467 | 1,161 | 12.3% |
| 66 | Lake Grove | 11,061 | 1,297 | 11.7% |
| 67 | Endicott | 13,387 | 1,567 | 11.7% |
| 68 | Lackawanna | 19,753 | 2,305 | 11.7% |
| 69 | Solvay | 6,544 | 745 | 11.4% |
| 70 | Airmont | 10,205 | 1,149 | 11.3% |
| 71 | Newark | 8,991 | 1,000 | 11.1% |
| 72 | Albany | 100,492 | 11,047 | 11.0% |
| 73 | Warwick | 6,585 | 722 | 11.0% |
| 74 | Albion | 5,506 | 586 | 10.6% |
| 75 | Jamestown | 28,188 | 2,975 | 10.6% |
| 76 | Babylon | 12,185 | 1,285 | 10.5% |
| 77 | Port Jefferson | 8,091 | 851 | 10.5% |
| 78 | Chestnut Ridge | 10,557 | 1,092 | 10.3% |
| 79 | Troy | 51,033 | 5,276 | 10.3% |
| 80 | Hudson | 5,865 | 604 | 10.3% |
| 81 | Great Neck | 11,087 | 1,136 | 10.2% |
| 82 | Syracuse | 146,384 | 14,984 | 10.2% |
| 83 | Bronxville | 6,510 | 659 | 10.1% |
| 84 | Briarcliff Manor | 7,519 | 754 | 10.0% |
| 85 | Rockville Centre | 25,765 | 2,482 | 9.6% |
| 86 | Binghamton | 47,151 | 4,478 | 9.5% |
| 87 | New Hyde Park | 10,220 | 965 | 9.4% |
| 88 | Watervliet | 10,287 | 959 | 9.3% |
| 89 | Rye Brook | 9,900 | 883 | 8.9% |
| 90 | Canandaigua | 10,514 | 928 | 8.8% |
| 91 | Ithaca | 32,814 | 2,888 | 8.8% |
| 92 | Pelham Manor | 5,644 | 486 | 8.6% |
| 93 | Cohoes | 18,159 | 1,518 | 8.4% |
| 94 | East Hills | 7,257 | 598 | 8.2% |
| 95 | Norwich | 6,782 | 555 | 8.2% |
| 96 | Rensselaer | 9,287 | 739 | 8.0% |
| 97 | Hastings-on-Hudson | 8,434 | 660 | 7.8% |
| 98 | Oneonta | 15,045 | 1,174 | 7.8% |
| 99 | Niagara Falls | 47,987 | 3,637 | 7.6% |
| 100 | Rome | 31,795 | 2,405 | 7.6% |
Source: U.S. Census ACS 2020-2024. 162 cities with more than 5,000 residents.
Summary
Summary: Hispanic or Latino Populations Across New York
According to the most recent data, this is an accurate list if you’re looking for a breakdown of Latino populations for each place across New York.
The most Hispanic/Latino cities in New York are Haverstraw, West Haverstraw, Port Chester, Sleepy Hollow, Newburgh, Ossining, Peekskill, Hempstead, Yonkers, and Freeport. Not sold on New York? Take the two-minute Find Your Place quiz and see which state actually fits you.
Questions and answers
Most Hispanic Cities In New York FAQs
What is the most Hispanic city in New York?
Haverstraw is the most Hispanic or Latino city in New York for 2026, at 63.2% of residents. West Haverstraw and Port Chester are next.
What cities in New York have the highest Hispanic population?
The New York cities with the highest Hispanic and Latino population shares are Haverstraw, West Haverstraw, Port Chester, Sleepy Hollow, Newburgh, Ossining, Peekskill, Hempstead, Yonkers, and Freeport. We ranked all 162 places with more than 5,000 residents.
What percent of Haverstraw is Hispanic?
Hispanic and Latino residents make up 63.2% of Haverstraw, the highest share of the 162 New York places we measured. The numbers come from the Census Bureau’s American Community Survey.
What is the least Hispanic city in New York?
Hudson Falls is the least Hispanic or Latino city in New York, at 0.3%. It sits at the opposite end of the same ranking.
Where does this data come from?
Every share is calculated from the Census Bureau’s American Community Survey (2020-2024), based on residents identifying as Hispanic or Latino of any race. We rank each New York place with more than 5,000 residents.