The unfortunate fact of the matter is that some places in the Keystone State have a larger percent of their population that never graduated from high school.
While the emphasis on going to college might be overblown, the fact is that not graduating from high school puts you at a significant disadvantage on average. Educational attainment might not be the best way to measure one person’s intelligence, but it does shine a light on the state.
We will use Saturday Night Science to determine what places in Pennsylvania have the highest percentage of adults without a high school degree.
A recent study we published found that Pennsylvania is the 21st smartest state in the United States, with an average IQ of 101.
But that doesn’t mean that a few cities in Pennsylvania are a bit slower than others due to a lack of basic education.
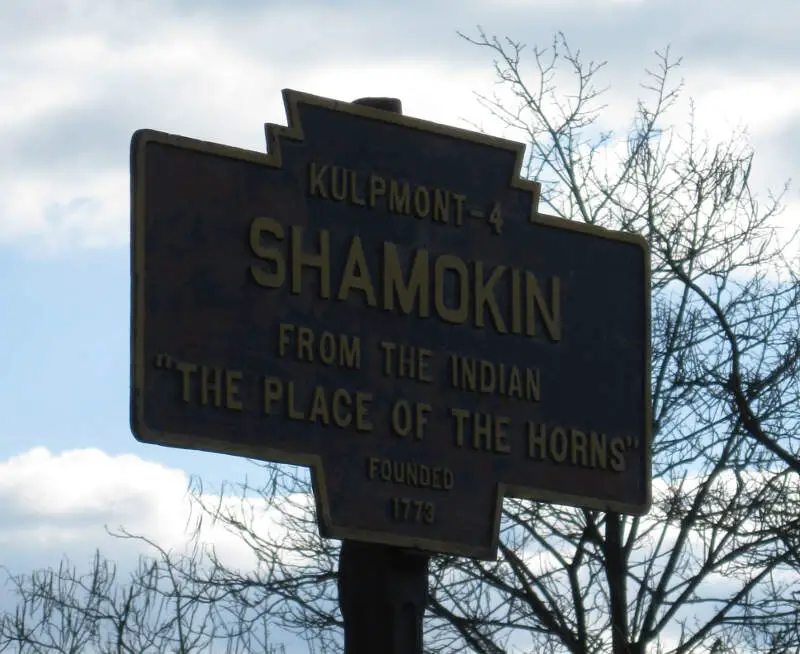
#1 dumbest in Pennsylvania
Shamokin is a city in Northumberland County, Pennsylvania, surrounded by Coal Township at the western edge of the Anthracite Coal Region. It was named after a Saponi village, Schahamokink. At the 2010 census the population was 7,374 residents. The city of Shamokin is bordered by Coal Township, Pennsylvania.
Data | Crime | Cost of living | Movers

#2 dumbest in Pennsylvania
Hazleton is a city in Luzerne County, Pennsylvania, United States. The population was 25,340 at the 2010 census. The population of Greater Hazleton was 77,187. Hazleton is the second largest city in Luzerne County and the seventeenth largest city in Pennsylvania. It was incorporated as a borough on January 5, 1857, and as a city on December 4, 1891.
Data | Crime | Cost of living | Movers
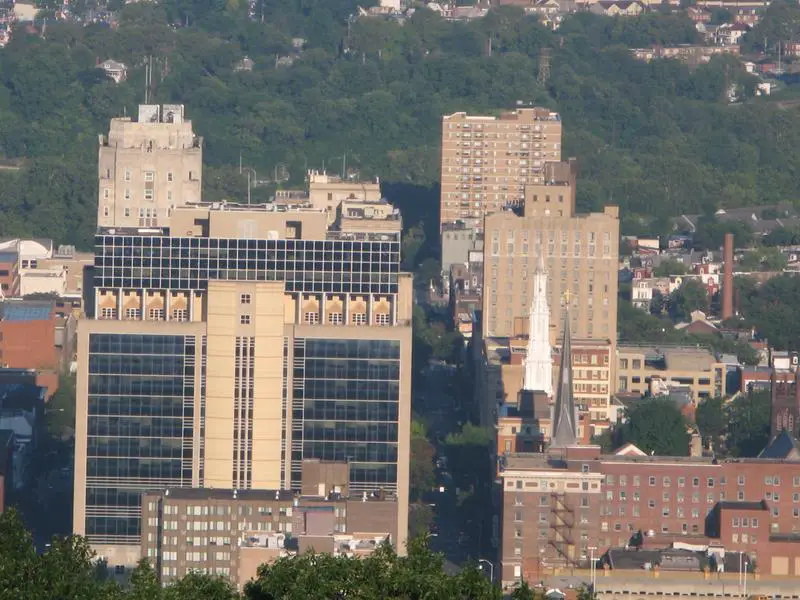
#3 dumbest in Pennsylvania
Reading is a city in and the county seat of Berks County, Pennsylvania, United States. With a population of 87,575, it is the fifth-largest city in Pennsylvania. Located in the southeastern part of the state, it is the principal city of the Greater Reading Area.
Data | Crime | Cost of living | Movers
#4 dumbest in Pennsylvania
Plymouth is a borough in Luzerne County, Pennsylvania, 4 miles west of Wilkes-Barre. The population was 5,951 as of the 2010 census.
Data | Crime | Cost of living | Movers
#5 dumbest in Pennsylvania
Chester is a city in Delaware County, Pennsylvania, United States, with a population of 33,972 at the 2010 census. Incorporated in 1682, Chester sits on the western bank of the Delaware River between the cities of Philadelphia and Wilmington, Delaware.
Data | Crime | Cost of living | Movers
#6 dumbest in Pennsylvania
Data | Crime | Cost of living | Movers
#7 dumbest in Pennsylvania
Data | Crime | Cost of living | Movers
#8 dumbest in Pennsylvania
Data | Crime | Cost of living | Movers
#9 dumbest in Pennsylvania
Data | Crime | Cost of living | Movers
#10 dumbest in Pennsylvania
Sunbury is a city in Northumberland County, Pennsylvania, United States. It is on the east bank of the Susquehanna River, just downstream of the confluence of its main and west branches. It dates to the early 18th century and is the county seat of Northumberland County.
Data | Crime | Cost of living | Movers
The receipts
Compare the top ten
Pick a metric. The bars rescale. The red line is Pennsylvania’s statewide median.
On the map
Where Pennsylvania’s dumbest cities are
Saturday Night Science
Methodology: How we determined the dumbest cities in the Keystone State
We realize that formal education is only part of it when it comes to being intelligent, but on the other hand, knowing the difference between they’re, their, and there is always going to make you look pretty stupid.
So, we used Saturday Night Science to narrow down our criteria to focus on a city’s educational opportunities and what percentage of the population takes advantage of those opportunities.
In short, we came up with these criteria to determine the dumbest cities in Pennsylvania:
- % of the city’s population with less than a high school education (Age 25+)
- % of city’s population with a college degree (Age 25+)
We got the data from the U.S. Census 2020-2024 American Community Survey.
Then, our algorithm generates a rank for each place in these categories. After crunching all the numbers, a ranking of the cities in Pennsylvania from dumbest to brightest.
For this ranking, we used every Pennsylvania city with at least 5,000 residents. We updated this article for 2026, and it’s our eleventh time ranking the dumbest cities in Pennsylvania.
The full plate
Dumbest Cities In Pennsylvania For 2026
Click any column to sort. Search by city name.
| Rank | City | Population | % Adult High School Dropout | % Highly Educated |
|---|---|---|---|---|
| 1 | Shamokin | 6,853 | 21.0% | 11.0% |
| 2 | Hazleton | 30,111 | 25.0% | 11.0% |
| 3 | Reading | 95,242 | 28.0% | 12.0% |
| 4 | Plymouth | 5,770 | 16.0% | 9.0% |
| 5 | Chester | 33,619 | 16.0% | 14.0% |
| 6 | West Hazleton | 5,178 | 29.0% | 17.0% |
| 7 | McKeesport | 17,380 | 14.0% | 11.0% |
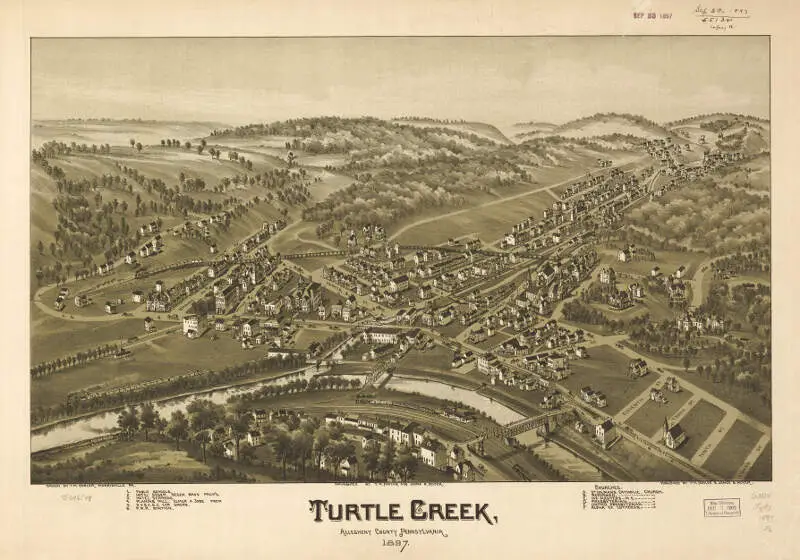
| 8 | Turtle Creek | 5,007 | 14.0% | 11.0% |
| 9 | West York | 5,092 | 21.0% | 17.0% |
| 10 | Sunbury | 9,617 | 12.0% | 11.0% |
| 11 | Lebanon | 26,536 | 17.0% | 16.0% |
| 12 | Red Lion | 6,516 | 16.0% | 16.0% |
| 13 | Collingdale | 8,897 | 15.0% | 16.0% |
| 14 | York | 44,938 | 17.0% | 18.0% |
| 15 | Columbia | 10,278 | 17.0% | 18.0% |
| 16 | Allentown | 125,976 | 19.0% | 19.0% |
| 17 | New Castle | 21,579 | 12.0% | 15.0% |
| 18 | Hanover | 16,584 | 12.0% | 15.0% |
| 19 | Johnstown | 18,087 | 12.0% | 16.0% |
| 20 | Connellsville | 6,849 | 11.0% | 14.0% |
| 21 | Coatesville | 13,353 | 18.0% | 20.0% |
| 22 | Nanticoke | 10,653 | 14.0% | 19.0% |
| 23 | Wilkes-Barre | 44,423 | 15.0% | 20.0% |
| 24 | Lehighton | 5,268 | 10.0% | 14.0% |
| 25 | Uniontown | 9,742 | 15.0% | 21.0% |
| 26 | Steelton | 6,296 | 12.0% | 19.0% |
| 27 | Bradford | 7,683 | 12.0% | 19.0% |
| 28 | Carbondale | 8,789 | 11.0% | 18.0% |
| 29 | Darby | 10,687 | 10.0% | 16.0% |
| 30 | Tamaqua | 6,924 | 10.0% | 15.0% |
| 31 | Mount Carmel | 5,677 | 10.0% | 18.0% |
| 32 | Wilson | 8,183 | 13.0% | 23.0% |
| 33 | Scranton | 76,033 | 13.0% | 23.0% |
| 34 | Aliquippa | 9,079 | 11.0% | 22.0% |
| 35 | Folcroft | 6,772 | 11.0% | 21.0% |
| 36 | Bristol | 9,902 | 11.0% | 21.0% |
| 37 | Palmerton | 5,622 | 9.0% | 18.0% |
| 38 | Harrisburg | 50,287 | 15.0% | 26.0% |
| 39 | Sharon | 12,936 | 9.0% | 19.0% |
| 40 | Ephrata | 13,772 | 11.0% | 23.0% |
| 41 | Clifton Heights | 6,832 | 7.0% | 17.0% |
| 42 | Erie | 93,850 | 11.0% | 23.0% |
| 43 | Berwick | 10,317 | 10.0% | 22.0% |
| 44 | Beaver Falls | 8,850 | 10.0% | 22.0% |
| 45 | Pottsville | 13,364 | 10.0% | 22.0% |
| 46 | Lancaster | 57,719 | 16.0% | 29.0% |
| 47 | Titusville | 5,189 | 8.0% | 19.0% |
| 48 | Milton | 6,534 | 8.0% | 19.0% |
| 49 | Butler | 13,212 | 9.0% | 22.0% |
| 50 | Meadville | 12,577 | 10.0% | 23.0% |
| 51 | Ambridge | 6,890 | 8.0% | 20.0% |
| 52 | Lock Haven | 8,447 | 11.0% | 24.0% |
| 53 | Oxford | 5,825 | 18.0% | 33.0% |
| 54 | Stroudsburg | 5,894 | 14.0% | 29.0% |
| 55 | Duquesne | 5,149 | 6.0% | 12.0% |
| 56 | Taylor | 6,265 | 9.0% | 22.0% |
| 57 | Washington | 13,368 | 8.0% | 20.0% |
| 58 | Vandergrift | 5,011 | 6.0% | 14.0% |
| 59 | Clairton | 6,044 | 8.0% | 21.0% |
| 60 | Somerset | 5,944 | 10.0% | 25.0% |
| 61 | Kennett Square | 6,243 | 21.0% | 36.0% |
| 62 | McKees Rocks | 5,786 | 5.0% | 9.0% |
| 63 | Bangor | 5,163 | 9.0% | 24.0% |
| 64 | Easton | 29,739 | 12.0% | 28.0% |
| 65 | Tyrone | 5,377 | 6.0% | 15.0% |
| 66 | Duryea | 5,084 | 9.0% | 23.0% |
| 67 | Waynesboro | 11,047 | 7.0% | 19.0% |
| 68 | East Stroudsburg | 9,319 | 13.0% | 32.0% |
| 69 | Altoona | 43,196 | 7.0% | 21.0% |
| 70 | New Brighton | 5,567 | 6.0% | 16.0% |
| 71 | Pittston | 7,626 | 9.0% | 23.0% |
| 72 | New Holland | 5,780 | 9.0% | 26.0% |
| 73 | Kingston | 13,397 | 11.0% | 31.0% |
| 74 | Exeter | 5,541 | 9.0% | 26.0% |
| 75 | Selinsgrove | 5,593 | 12.0% | 33.0% |
| 76 | Millersville | 8,982 | 12.0% | 33.0% |
| 77 | Corry | 6,116 | 7.0% | 23.0% |
| 78 | Swoyersville | 5,048 | 8.0% | 25.0% |
| 79 | Punxsutawney | 5,665 | 5.0% | 18.0% |
| 80 | Williamsport | 27,612 | 9.0% | 28.0% |
| 81 | Jeannette | 8,657 | 6.0% | 20.0% |
| 82 | Souderton | 7,181 | 10.0% | 32.0% |
| 83 | Chambersburg | 22,319 | 9.0% | 27.0% |
| 84 | Blakely | 6,662 | 8.0% | 27.0% |
| 85 | Clearfield | 5,873 | 6.0% | 23.0% |
| 86 | Philadelphia | 1,579,706 | 11.0% | 36.0% |
| 87 | Yeadon | 12,181 | 6.0% | 24.0% |
| 88 | Lewisburg | 5,257 | 12.0% | 42.0% |
| 89 | Monessen | 6,780 | 7.0% | 26.0% |
| 90 | Lansdale | 19,011 | 12.0% | 40.0% |
| 91 | Schuylkill Haven | 5,253 | 4.0% | 19.0% |
| 92 | Warren | 9,240 | 6.0% | 25.0% |
| 93 | Manheim | 5,027 | 7.0% | 28.0% |
| 94 | Glenolden | 7,220 | 6.0% | 26.0% |
| 95 | Shippensburg | 5,620 | 9.0% | 35.0% |
| 96 | Old Forge | 8,573 | 7.0% | 30.0% |
| 97 | New Kensington | 12,011 | 5.0% | 22.0% |
| 98 | West Mifflin | 19,190 | 6.0% | 25.0% |
| 99 | Bethlehem | 77,956 | 9.0% | 36.0% |
| 100 | Greenville | 5,523 | 6.0% | 29.0% |
Source: U.S. Census ACS 2020-2024. 175 cities with more than 5,000 residents.
Summary
There You Have It – Now That You’re Asleep
If you’re measuring the locations in Pennsylvania where there are a high number of dropouts and adults who never received a formal education, this is an accurate ranking.
The dumbest cities in Pennsylvania are Shamokin, Hazleton, Reading, Plymouth, Chester, West Hazleton, McKeesport, Turtle Creek, West York, and Sunbury. Not sold on Pennsylvania? Take the two-minute Find Your Place quiz and see which state actually fits you.


