We all love the biggest cities that the Mount Rushmore State has to offer. You know the places like Sioux Falls and Rapid City which make all the headlines.
But there are a bunch of other great large cities in South Dakota that don't get as much love.
We're going to change that right now.
Using the most recent Census data, we can tell you about all the places in South Dakota with a focus on the biggest. We update the data each year and this is our fourth time doing this.
The Largest Cities In South Dakota For 2026:
You can click here to see a full table of the 100 biggest cities in South Dakota, along with every other place over 1,000 people big. It is sortable by clicking on the headers.
Read on below to see more on the biggest cities. Or for more reading on places to live in South Dakota, check out:
- Best Places To Live In South Dakota
- Cheapest Places To Live In South Dakota
- Most Dangerous Cities In South Dakota
The 10 Biggest Cities In South Dakota

/10
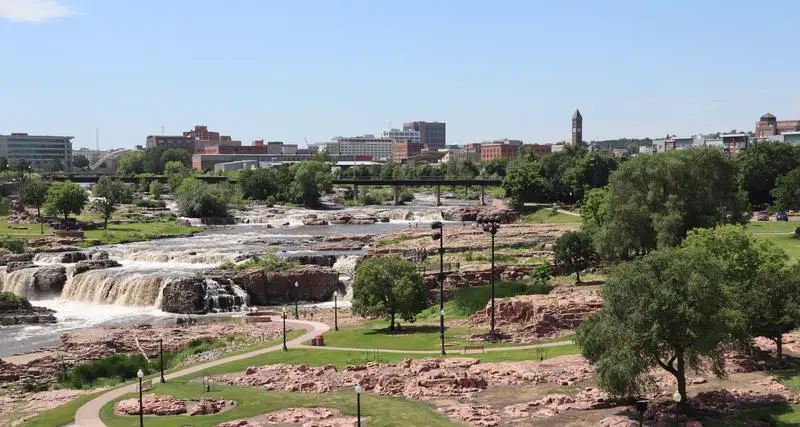
Rank Last Year: 1 (No Change)
Population: 201,469.0
Population 2010: 148,848
Growth: 35.4%
More on Sioux Falls: Data | Crime | Cost Of Living | Real Estate

/10
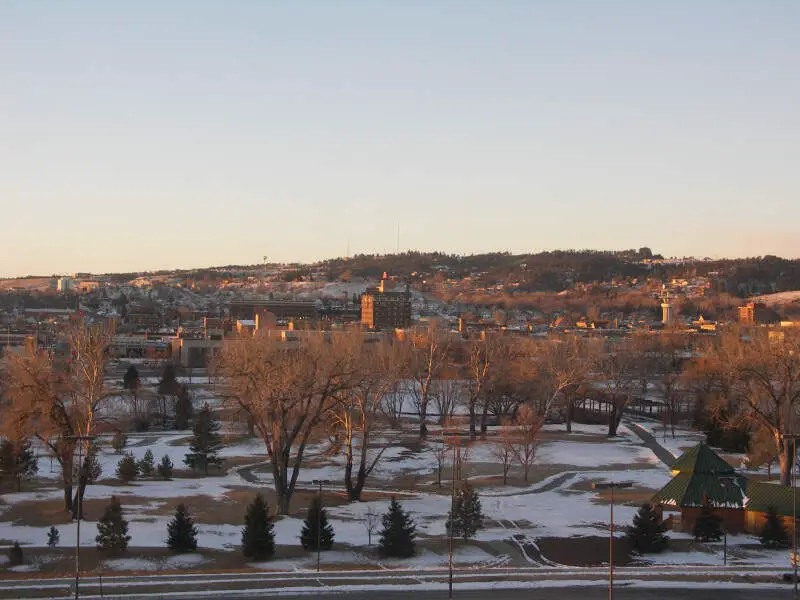
Rank Last Year: 2 (No Change)
Population: 77,946.0
Population 2010: 66,144
Growth: 17.8%
More on Rapid City: Data | Crime | Cost Of Living | Real Estate

/10
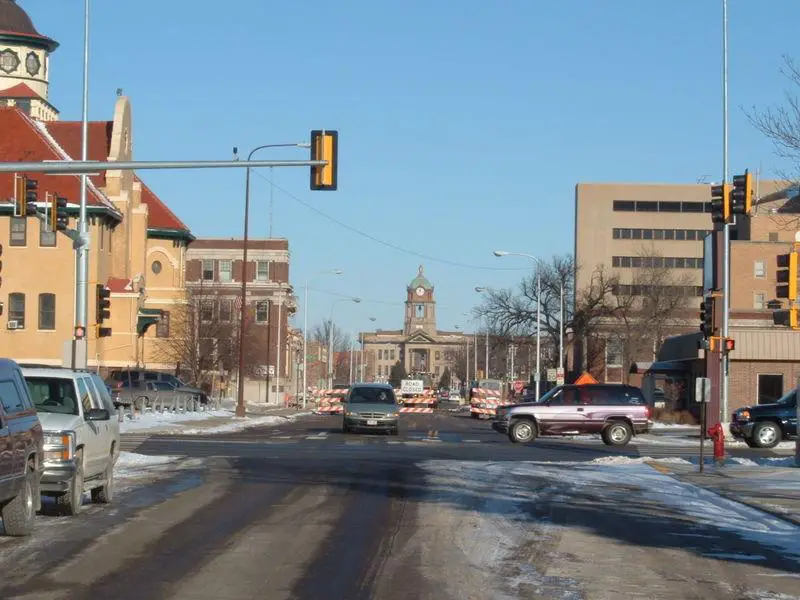
Rank Last Year: 3 (No Change)
Population: 28,189.0
Population 2010: 25,713
Growth: 9.6%
More on Aberdeen: Data | Crime | Cost Of Living | Real Estate

/10
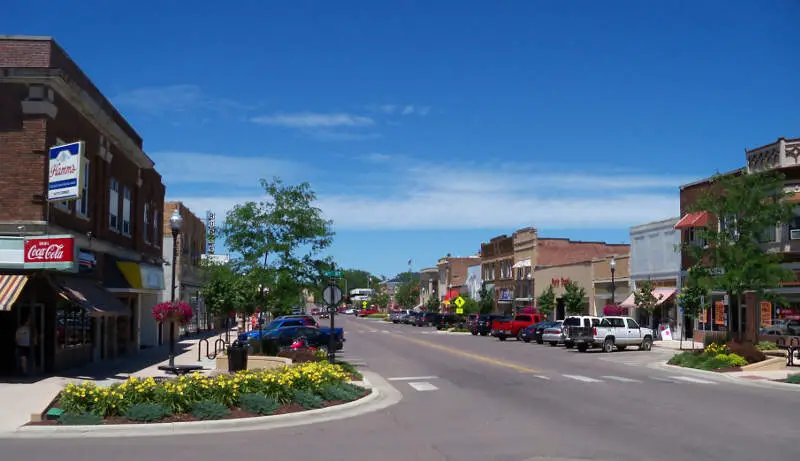
Rank Last Year: 4 (No Change)
Population: 23,948.0
Population 2010: 21,466
Growth: 11.6%
More on Brookings: Data | Crime | Cost Of Living | Real Estate

/10
Rank Last Year: 5 (No Change)
Population: 23,044.0
Population 2010: 21,318
Growth: 8.1%
More on Watertown: Data | Crime | Cost Of Living | Real Estate

/10
Rank Last Year: 6 (No Change)
Population: 15,649.0
Population 2010: 15,166
Growth: 3.2%
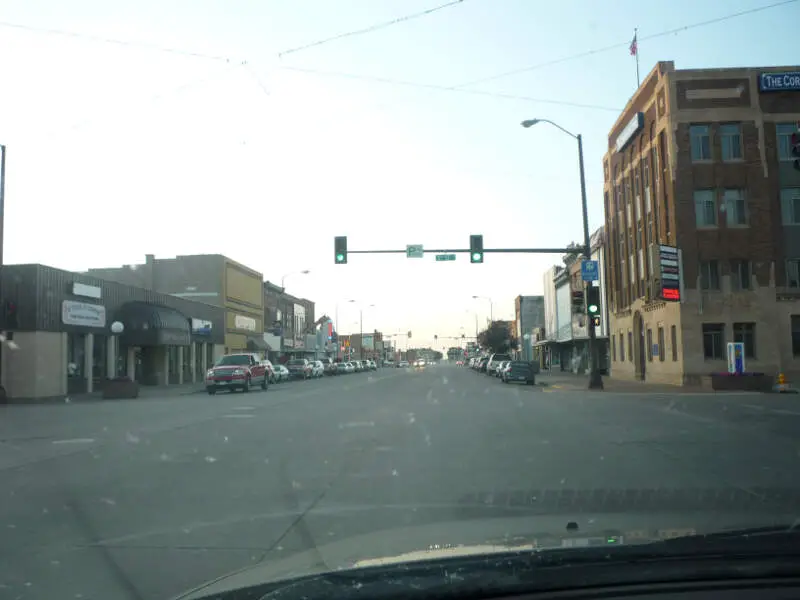
More on Mitchell: Data | Crime | Cost Of Living | Real Estate

/10
Rank Last Year: 7 (No Change)
Population: 15,540.0
Population 2010: 14,243
Growth: 9.1%
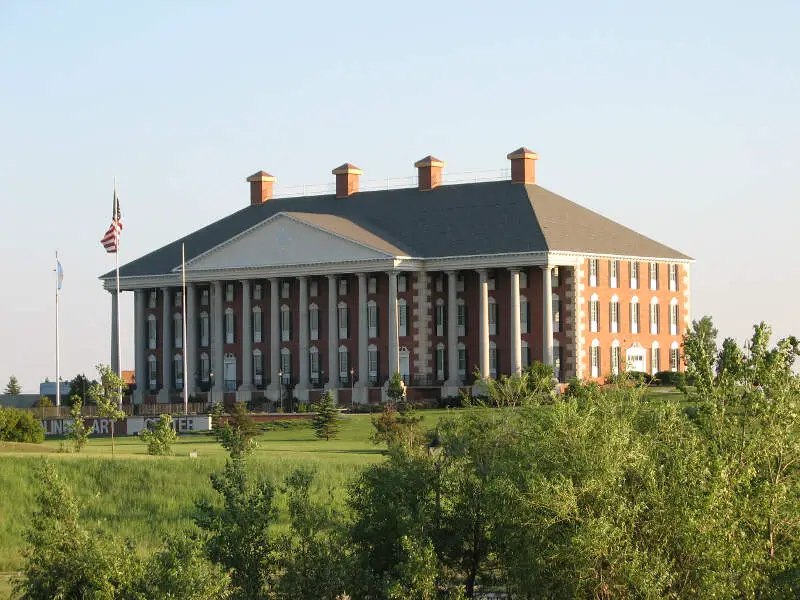
More on Yankton: Data | Crime | Cost Of Living | Real Estate

/10
Rank Last Year: 8 (No Change)
Population: 14,385.0
Population 2010: 12,114
Growth: 18.7%
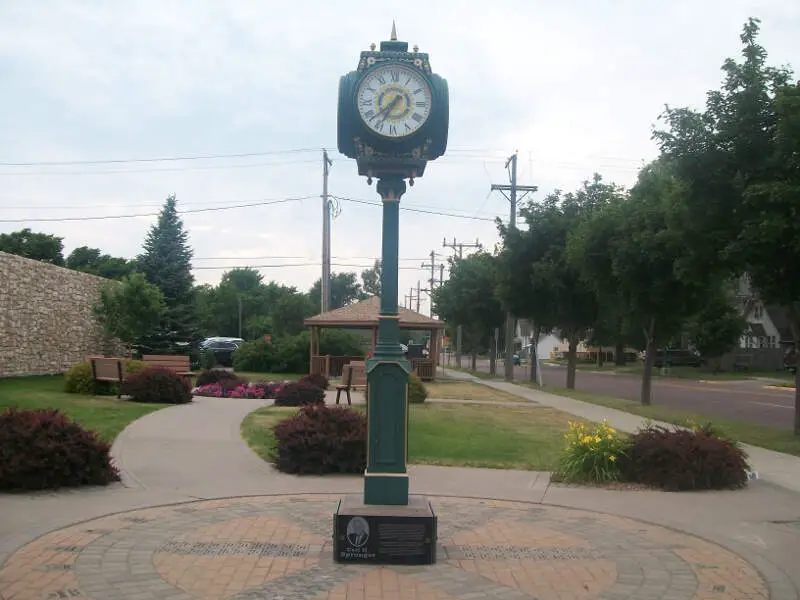
More on Huron: Data | Crime | Cost Of Living | Real Estate

/10
Rank Last Year: 9 (No Change)
Population: 13,948.0
Population 2010: 13,604
Growth: 2.5%
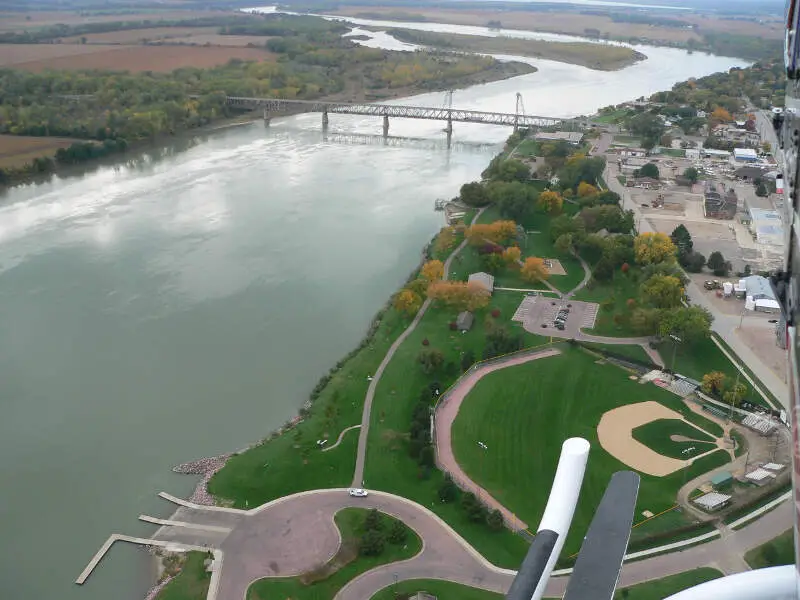
More on Pierre: Data | Crime | Cost Of Living | Real Estate

/10
Rank Last Year: 10 (No Change)
Population: 12,930.0
Population 2010: 10,195
Growth: 26.8%
More on Spearfish: Data | Crime | Cost Of Living | Real Estate
How We Determined The Largest Cities In South Dakota
We've been ranking and dissecting cities in the Mount Rushmore State for over 4 years now -- making this actually the fourth time we've run the numbers. We always use the best data, the US Census. In this case, that means we are using the American Community Survey.
It what is probably the most simple analysis we run each year, we ranked every place in South Dakota from biggest to smallest. The biggest city this year? That would be Sioux Falls.
The smallest? Worthing, although there are places smaller than 1,000 people not listed here, so keep that in mind as we take a look at the top ten.
Now on to numbers 11-100 Biggest in South Dakota
We hope that you find the big city, or really any city, that's right for you. Below is a list of the rest of the biggest cities along with every other place in South Dakota.
Have fun snacking around in the Mount Rushmore State!
For more reading on South Dakota, check out:
- Best Places To Raise A Family In South Dakota
- Best Places To Retire In South Dakota
- Richest Cities In South Dakota
- Safest Places In South Dakota
- Worst Places To Live In South Dakota
- Most Expensive Places To Live In South Dakota
Detailed List Of The Biggest Cities In South Dakota
| Rank | City | Current Population | 2010 | Growth |
|---|---|---|---|---|
| 1 | Sioux Falls | 201,469.0 | 148,848 | 35.4% |
| 2 | Rapid City | 77,946.0 | 66,144 | 17.8% |
| 3 | Aberdeen | 28,189.0 | 25,713 | 9.6% |
| 4 | Brookings | 23,948.0 | 21,466 | 11.6% |
| 5 | Watertown | 23,044.0 | 21,318 | 8.1% |
| 6 | Mitchell | 15,649.0 | 15,166 | 3.2% |
| 7 | Yankton | 15,540.0 | 14,243 | 9.1% |
| 8 | Huron | 14,385.0 | 12,114 | 18.7% |
| 9 | Pierre | 13,948.0 | 13,604 | 2.5% |
| 10 | Spearfish | 12,930.0 | 10,195 | 26.8% |
| 11 | Box Elder | 12,902.0 | 7,686 | 67.9% |
| 12 | Vermillion | 11,878.0 | 10,517 | 12.9% |
| 13 | Brandon | 10,996.0 | 8,233 | 33.6% |
| 14 | Harrisburg | 8,519.0 | 3,559 | 139.4% |
| 15 | Sturgis | 7,086.0 | 6,617 | 7.1% |
| 16 | Rapid Valley | 6,975.0 | 8,130 | -14.2% |
| 17 | Tea | 6,786.0 | 3,453 | 96.5% |
| 18 | Madison | 6,094.0 | 6,381 | -4.5% |
| 19 | Belle Fourche | 5,804.0 | 5,565 | 4.3% |
| 20 | Dakota Dunes | 3,936.0 | 2,611 | 50.7% |
| 21 | Dell Rapids | 3,905.0 | 3,516 | 11.1% |
| 22 | Hot Springs | 3,548.0 | 3,797 | -6.6% |
| 23 | Milbank | 3,525.0 | 3,371 | 4.6% |
| 24 | Hartford | 3,478.0 | 2,406 | 44.6% |
| 25 | North Sioux City | 3,045.0 | 2,451 | 24.2% |
| 26 | Canton | 3,033.0 | 3,086 | -1.7% |
| 27 | Summerset | 3,022.0 | 1,717 | 76.0% |
| 28 | Lead | 3,006.0 | 3,107 | -3.3% |
| 29 | Blackhawk | 2,934.0 | 2,628 | 11.6% |
| 30 | Mobridge | 2,932.0 | 3,217 | -8.9% |
| 31 | Winner | 2,905.0 | 2,930 | -0.9% |
| 32 | Sisseton | 2,670.0 | 2,485 | 7.4% |
| 33 | Colonial Pine Hills | 2,609.0 | 2,656 | -1.8% |
| 34 | Chamberlain | 2,588.0 | 2,342 | 10.5% |
| 35 | Elk Point | 2,537.0 | 1,945 | 30.4% |
| 36 | Lennox | 2,468.0 | 2,389 | 3.3% |
| 37 | Fort Pierre | 2,410.0 | 2,140 | 12.6% |
| 38 | Volga | 2,408.0 | 1,749 | 37.7% |
| 39 | Flandreau | 2,392.0 | 2,435 | -1.8% |
| 40 | Beresford | 2,360.0 | 2,000 | 18.0% |
| 41 | Custer | 2,341.0 | 2,594 | -9.8% |
| 42 | Pine Ridge | 2,246.0 | 4,035 | -44.3% |
| 43 | Springfield | 2,038.0 | 1,729 | 17.9% |
| 44 | Redfield | 1,989.0 | 2,264 | -12.1% |
| 45 | Webster | 1,896.0 | 1,745 | 8.7% |
| 46 | Parkston | 1,874.0 | 1,305 | 43.6% |
| 47 | North Spearfish | 1,858.0 | 1,980 | -6.2% |
| 48 | Groton | 1,691.0 | 1,555 | 8.7% |
| 49 | Rosebud | 1,659.0 | 1,843 | -10.0% |
| 50 | Green Valley | 1,642.0 | 677 | 142.5% |
| 51 | Freeman | 1,565.0 | 1,323 | 18.3% |
| 52 | Mission | 1,539.0 | 599 | 156.9% |
| 53 | Wagner | 1,529.0 | 1,705 | -10.3% |
| 54 | Baltic | 1,502.0 | 999 | 50.4% |
| 55 | North Eagle Butte | 1,481.0 | 1,902 | -22.1% |
| 56 | Eagle Butte | 1,458.0 | 1,035 | 40.9% |
| 57 | Aurora | 1,444.0 | 625 | 131.0% |
| 58 | Gregory | 1,379.0 | 1,376 | 0.2% |
| 59 | Miller | 1,363.0 | 1,596 | -14.6% |
| 60 | Clark | 1,359.0 | 1,331 | 2.1% |
| 61 | Clear Lake | 1,327.0 | 1,385 | -4.2% |
| 62 | Parker | 1,280.0 | 1,119 | 14.4% |
| 63 | Crooks | 1,268.0 | 1,292 | -1.9% |
| 64 | Gettysburg | 1,260.0 | 1,218 | 3.4% |
| 65 | Salem | 1,216.0 | 1,404 | -13.4% |
| 66 | Deadwood | 1,209.0 | 949 | 27.4% |
| 67 | Lemmon | 1,208.0 | 1,221 | -1.1% |
| 68 | Tyndall | 1,183.0 | 1,225 | -3.4% |
| 69 | Garretson | 1,176.0 | 1,264 | -7.0% |
| 70 | Platte | 1,161.0 | 1,292 | -10.1% |
| 71 | Fort Thompson | 1,147.0 | 1,428 | -19.7% |
| 72 | Ashland Heights | 1,105.0 | 1,046 | 5.6% |
| 73 | Oglala | 1,071.0 | 1,732 | -38.2% |
| 74 | Ipswich | 1,048.0 | 774 | 35.4% |
| 75 | Worthing | 1,036.0 | 781 | 32.7% |