Most Asian cities in Michigan research summary. We analyzed Michigan’s most recent Census data to determine the most Asian cities in Michigan based on the percentage of Asian residents.
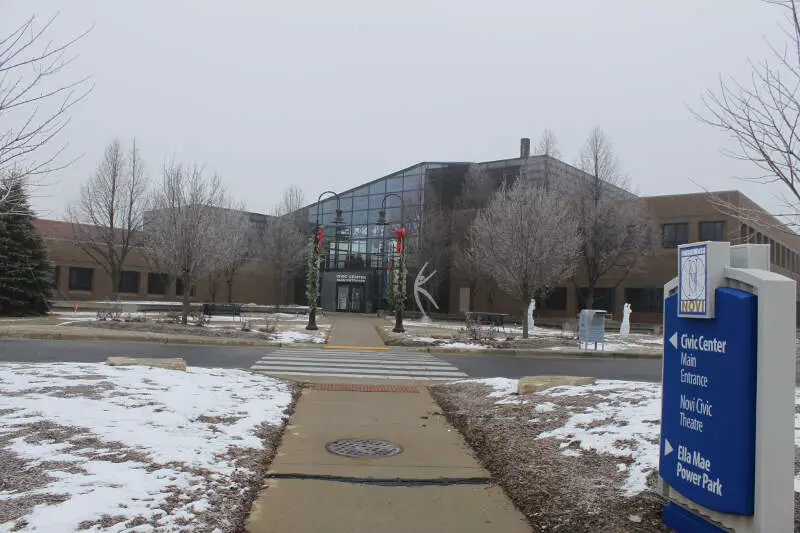
28.1% Asian · #1 most Asian in Michigan
Novi is a city in Oakland County in the U.S. state of Michigan. As of the 2010 census, the population was 55,224, an increase over the 2000 census count of 47,386. The city is located approximately 25 miles northwest of the center of Detroit, and about 8 miles west of the western border of Detroit. It is about 25 miles northeast of the center of Ann Arbor. The city is located within the boundaries of the survey township of Novi Township. The remaining unincorporated township is only a tiny fraction surrounded by the city.
Data | Crime | Cost of living | Movers
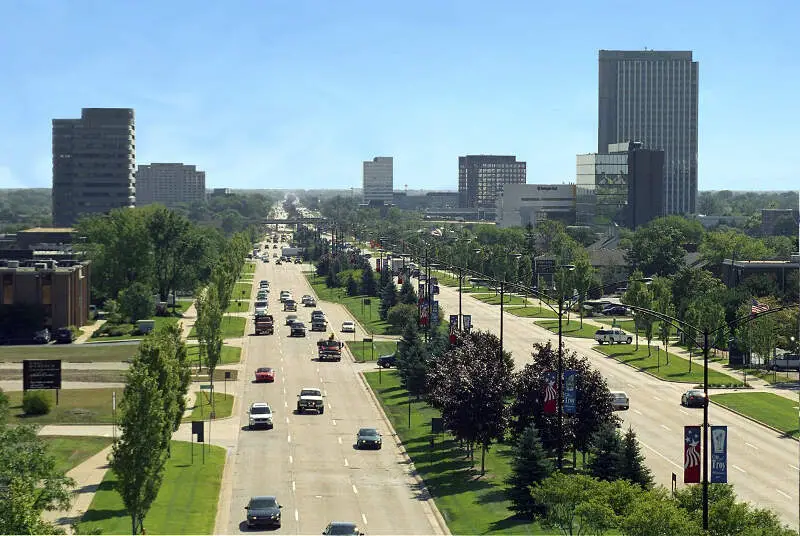
27.8% Asian · #2 most Asian in Michigan
Troy is a city located in Metropolitan Detroit’s northern suburbs in Oakland County in the U.S. state of Michigan. The population was 80,980 at the 2010 census, making it the 11th-largest city in Michigan by population, and the largest city in Oakland County. Troy has become a business and shopping destination in the Metro Detroit area, with numerous office centers and the upscale Somerset Collection mall.
Data | Crime | Cost of living | Movers
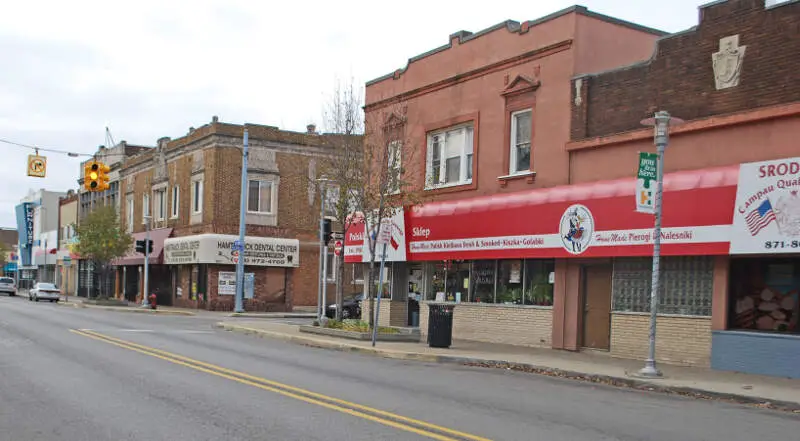
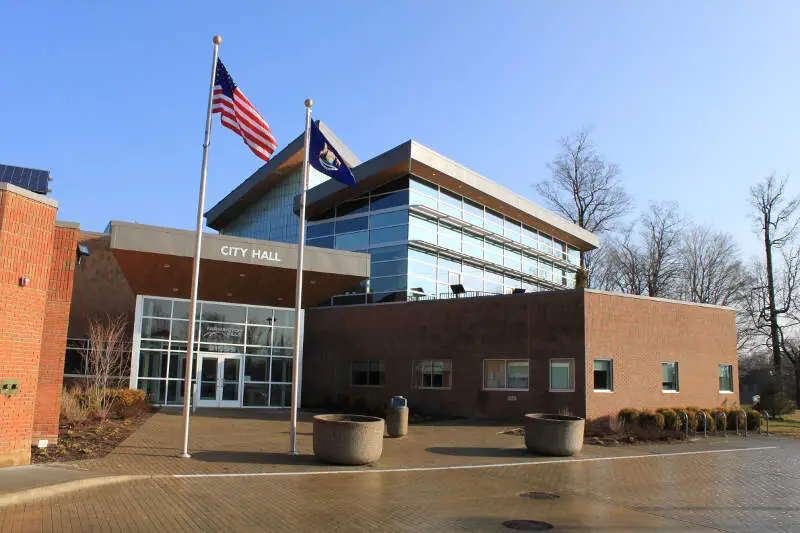
25.3% Asian · #3 most Asian in Michigan
Hamtramck is a city in Wayne County of the U.S. state of Michigan. As of the 2010 census, the city population was 22,423. Hamtramck is surrounded by the city of Detroit except for a small portion of the western border that touches the similarly surrounded city of Highland Park.
Data | Crime | Cost of living | Movers
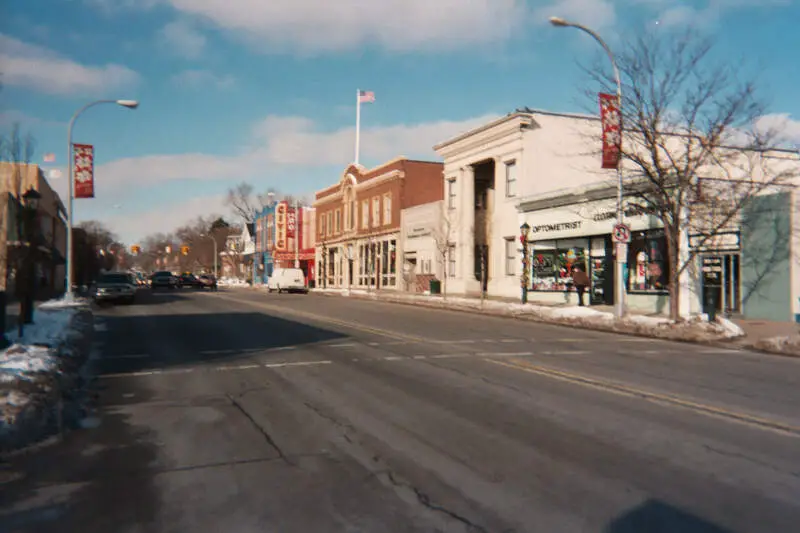
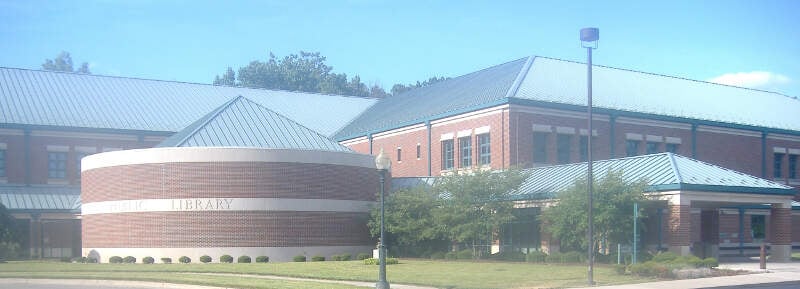
23.9% Asian · #4 most Asian in Michigan
Farmington is a city in Oakland County of the U.S. state of Michigan. It is one of the northern suburbs of Detroit. As of the 2010 census, the city population was 10,372. It is surrounded by Farmington Hills, except for a small portion bordered by Livonia to the south. Since 2009, the city’s downtown has been the center of an extensive renovation and remodeling featuring a refacing or rebuilding of many buildings on Grand River Avenue, as well as brick paver sidewalks, the Farmington Pavilion, new lighting, and landscaping. The area is known for its historic downtown, elegant Victorian-style homes, and one of Michigan’s top rated public school systems, Farmington Public Schools. In 2007 CNNMoney.com listed Farmington as number 55 in its Best Places to Live survey. Farmington was also ranked 27th on the list for Best to Live in 2013, citing nearly US$3 million in additional city renovations and development, bumping its rank up.
Data | Crime | Cost of living | Movers
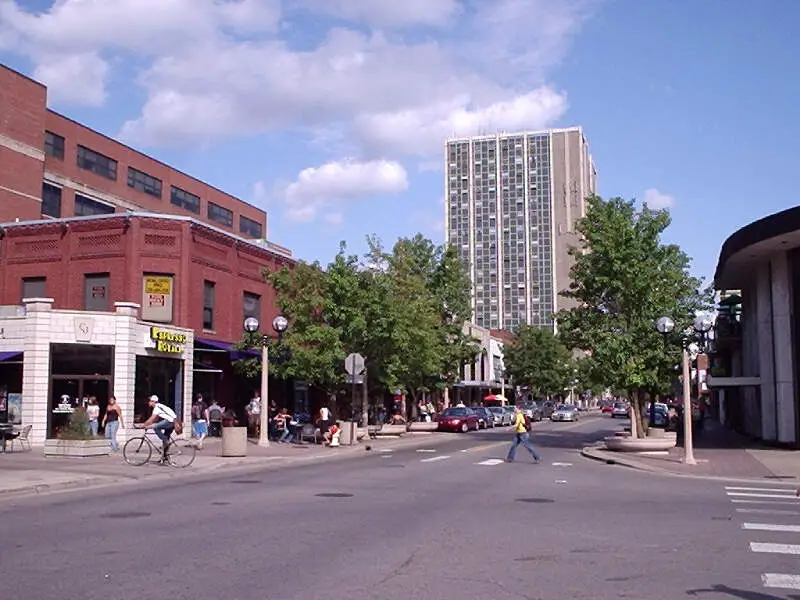
15.6% Asian · #5 most Asian in Michigan
Ann Arbor is a city in the U.S. state of Michigan and the county seat of Washtenaw County. The 2010 census recorded its population to be 113,934, making it the sixth largest city in Michigan.
Data | Crime | Cost of living | Movers
14.5% Asian · #6 most Asian in Michigan
Rochester Hills is a city in northeast Oakland County of the U.S. state of Michigan, in the northern outskirts of Metropolitan Detroit area. As of the 2010 census, the city had a total population of 70,995.
Data | Crime | Cost of living | Movers
13.7% Asian · #7 most Asian in Michigan
Farmington Hills is the second largest city in Oakland County in the U.S. state of Michigan. Its population was 79,740 at the 2010 census. It is part of the upscale northwestern suburbs of Metropolitan Detroit and is also around 20 miles northeast of downtown Ann Arbor.
Data | Crime | Cost of living | Movers
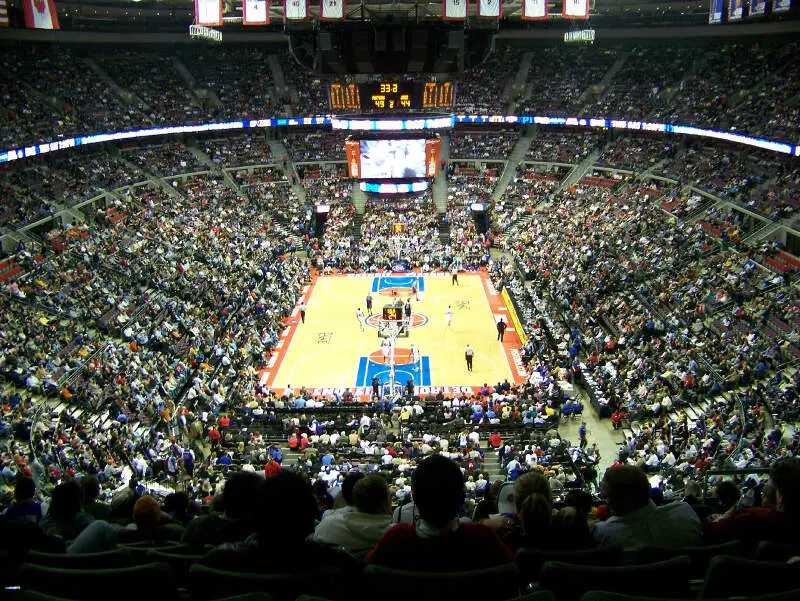
13.5% Asian · #8 most Asian in Michigan
Auburn Hills is a city in Oakland County, in the U.S. state of Michigan. The population was 21,412 at the 2010 census. It is home to the world headquarters of Chrysler, The Palace of Auburn Hills, and Oakland University.
Data | Crime | Cost of living | Movers
12.7% Asian · #9 most Asian in Michigan
Warren is a city in Macomb County in the U.S. state of Michigan. The 2010 census places the city’s population at 134,056, making Warren the largest city in Macomb County, the third largest city in Michigan, and Metro Detroit’s largest suburb. The city is home to a wide variety of businesses, including General Motors Technical Center, the United States Army Detroit Arsenal, home of the United States Army TACOM Life Cycle Management Command and the Tank Automotive Research, Development and Engineering Center, the headquarters of Big Boy Restaurants International, and Asset Acceptance. The current mayor is James R. Fouts, who was elected to his first mayoral term in November 2007.
Data | Crime | Cost of living | Movers
12.1% Asian · #10 most Asian in Michigan
Center Line is a city in Macomb County in the U.S. state of Michigan, surrounded entirely by the city of Warren. The population was 8,257 at the 2010 census.
Data | Crime | Cost of living | Movers
The receipts
Compare the top ten
Pick a metric. The bars rescale. The red line is Michigan’s statewide median.
On the map
Where Michigan’s Asian communities live
Saturday Night Science
Methodology: How We Determined The Cities In Michigan With The Largest Asian Population For 2026
We used Saturday Night Science to compare Census data on race across every place in Michigan.
The Census’s most recently available data comes from the 2020-2024 American Community Survey.
Specifically, we looked at table B03002: Hispanic OR LATINO ORIGIN BY RACE. Here are the category names as defined by the Census:
- Hispanic or Latino
- White alone*
- Black or African American alone*
- American Indian and Alaska Native alone*
- Asian alone*
- Native Hawaiian and Other Pacific Islander alone*
- Some other race alone*
- Two or more races*
Our particular column of interest here was the number of people who identified as Asian alone.
We limited our analysis to cities with a population greater than 5,000 people. That left us with 147 cities.
We then calculated the percentage of residents that are Asian. The percentages ranked from 28.1% to 0.0%.
Finally, we ranked each city based on the percentage of Asian population, with a higher percentage being more Asian. Novi took the distinction of being the most Asian, while Benton Harbor was the least Asian city.
We updated this article for 2026. This report reflects our eleventh time ranking the cities in Michigan with the largest Asian population.
The full plate
Cities In Michigan By Asian Population
Click any column to sort. Search by city name.
| Rank | City | Population | Asian Population | % Asian |
|---|---|---|---|---|
| 1 | Novi | 66,717 | 18,764 | 28.1% |
| 2 | Troy | 87,898 | 24,424 | 27.8% |
| 3 | Hamtramck | 27,743 | 7,025 | 25.3% |
| 4 | Farmington | 11,504 | 2,754 | 23.9% |
| 5 | Ann Arbor | 122,036 | 18,992 | 15.6% |
| 6 | Rochester Hills | 77,089 | 11,162 | 14.5% |
| 7 | Farmington Hills | 83,515 | 11,447 | 13.7% |
| 8 | Auburn Hills | 25,105 | 3,399 | 13.5% |
| 9 | Warren | 137,928 | 17,521 | 12.7% |
| 10 | Center Line | 8,463 | 1,022 | 12.1% |
| 11 | Kentwood | 54,296 | 5,396 | 9.9% |
| 12 | Sterling Heights | 133,573 | 12,337 | 9.2% |
| 13 | Wixom | 17,295 | 1,581 | 9.1% |
| 14 | Houghton | 8,474 | 771 | 9.1% |
| 15 | Walled Lake | 7,299 | 655 | 9.0% |
| 16 | East Lansing | 45,758 | 4,089 | 8.9% |
| 17 | Rochester | 12,934 | 1,031 | 8.0% |
| 18 | Springfield | 5,269 | 395 | 7.5% |
| 19 | Madison Heights | 28,419 | 1,836 | 6.5% |
| 20 | Lansing | 113,023 | 6,042 | 5.3% |
| 21 | Ypsilanti | 19,857 | 1,009 | 5.1% |
| 22 | Battle Creek | 52,374 | 2,554 | 4.9% |
| 23 | Birmingham | 21,763 | 1,060 | 4.9% |
| 24 | Pontiac | 62,104 | 2,630 | 4.2% |
| 25 | Livonia | 93,851 | 3,748 | 4.0% |
| 26 | Walker | 25,386 | 1,013 | 4.0% |
| 27 | Grosse Pointe Park | 11,319 | 440 | 3.9% |
| 28 | Westland | 83,633 | 3,220 | 3.9% |
| 29 | Mount Pleasant | 21,236 | 759 | 3.6% |
| 30 | Royal Oak | 57,950 | 2,008 | 3.5% |
| 31 | Holland | 34,423 | 1,185 | 3.4% |
| 32 | Portage | 49,259 | 1,694 | 3.4% |
| 33 | Fenton | 11,906 | 401 | 3.4% |
| 34 | Beverly Hills | 10,524 | 353 | 3.4% |
| 35 | Midland | 42,724 | 1,414 | 3.3% |
| 36 | Ferndale | 19,190 | 583 | 3.0% |
| 37 | Kalamazoo | 73,076 | 2,185 | 3.0% |
| 38 | Northville | 6,069 | 173 | 2.9% |
| 39 | Grand Rapids | 198,535 | 5,547 | 2.8% |
| 40 | Oak Park | 29,318 | 803 | 2.7% |
| 41 | Clawson | 11,374 | 292 | 2.6% |
| 42 | South Lyon | 11,950 | 285 | 2.4% |
| 43 | Southgate | 29,366 | 693 | 2.4% |
| 44 | Huntington Woods | 6,328 | 147 | 2.3% |
| 45 | East Grand Rapids | 11,445 | 261 | 2.3% |
| 46 | Taylor | 62,081 | 1,335 | 2.2% |
| 47 | Grand Blanc | 7,987 | 171 | 2.1% |
| 48 | Grand Haven | 10,996 | 235 | 2.1% |
| 49 | Grosse Pointe Farms | 9,904 | 204 | 2.1% |
| 50 | Southfield | 76,236 | 1,541 | 2.0% |
| 51 | Wyoming | 77,353 | 1,420 | 1.8% |
| 52 | Dearborn | 107,423 | 1,949 | 1.8% |
| 53 | Plymouth | 9,214 | 167 | 1.8% |
| 54 | Woodhaven | 12,690 | 223 | 1.8% |
| 55 | Detroit | 638,530 | 11,074 | 1.7% |
| 56 | St. Joseph | 7,986 | 137 | 1.7% |
| 57 | Fraser | 14,583 | 243 | 1.7% |
| 58 | Alma | 9,396 | 151 | 1.6% |
| 59 | Sturgis | 11,054 | 174 | 1.6% |
| 60 | Roseville | 47,123 | 736 | 1.6% |
| 61 | Petoskey | 5,856 | 89 | 1.5% |
| 62 | Grandville | 16,356 | 244 | 1.5% |
| 63 | Inkster | 25,428 | 360 | 1.4% |
| 64 | Wayne | 17,310 | 228 | 1.3% |
| 65 | St. Clair Shores | 58,140 | 761 | 1.3% |
| 66 | Garden City | 26,739 | 349 | 1.3% |
| 67 | Riverview | 12,186 | 158 | 1.3% |
| 68 | Hudsonville | 7,769 | 100 | 1.3% |
| 69 | Allen Park | 27,925 | 359 | 1.3% |
| 70 | Marshall | 6,804 | 83 | 1.2% |
| 71 | Sault Ste. Marie | 13,335 | 160 | 1.2% |
| 72 | Marysville | 9,925 | 118 | 1.2% |
| 73 | Milford | 6,487 | 76 | 1.2% |
| 74 | Big Rapids | 8,477 | 98 | 1.2% |
| 75 | Ludington | 7,676 | 88 | 1.1% |
| 76 | Flushing | 8,284 | 92 | 1.1% |
| 77 | Hazel Park | 14,963 | 164 | 1.1% |
| 78 | Ishpeming | 6,181 | 66 | 1.1% |
| 79 | Traverse City | 15,593 | 165 | 1.1% |
| 80 | Dearborn Heights | 61,771 | 648 | 1.0% |
| 81 | Escanaba | 12,354 | 129 | 1.0% |
| 82 | Albion | 7,560 | 78 | 1.0% |
| 83 | Grosse Pointe | 5,541 | 54 | 1.0% |
| 84 | Berkley | 15,149 | 144 | 1.0% |
| 85 | Grosse Pointe Woods | 16,094 | 148 | 0.9% |
| 86 | Port Huron | 28,620 | 253 | 0.9% |
| 87 | Cadillac | 10,445 | 91 | 0.9% |
| 88 | Norton Shores | 25,041 | 216 | 0.9% |
| 89 | Bay City | 32,320 | 273 | 0.8% |
| 90 | Saline | 9,006 | 74 | 0.8% |
| 91 | Brighton | 7,688 | 63 | 0.8% |
| 92 | Tecumseh | 8,646 | 68 | 0.8% |
| 93 | Howell | 10,021 | 77 | 0.8% |
| 94 | St. Johns | 7,715 | 56 | 0.7% |
| 95 | Kingsford | 5,124 | 37 | 0.7% |
| 96 | Wyandotte | 24,489 | 173 | 0.7% |
| 97 | Lapeer | 9,082 | 63 | 0.7% |
| 98 | Flint | 80,175 | 546 | 0.7% |
| 99 | Eastpointe | 33,982 | 228 | 0.7% |
| 100 | Muskegon | 37,226 | 237 | 0.6% |
Source: U.S. Census ACS 2020-2024. 147 cities with more than 5,000 residents.
Summary
Summary: Asian Populations Across Michigan
If you’re looking for a breakdown of Asian populations across Michigan according to the most recent data, this is an accurate list.
The most Asian cities in Michigan are Novi, Troy, Hamtramck, Farmington, Ann Arbor, Rochester Hills, Farmington Hills, Auburn Hills, Warren, and Center Line.


