
Racial diversity in Indiana is a mixed bag.
There are parts of Indiana where there’s a high level of diversity. But where will you find the most diverse places in Indiana?
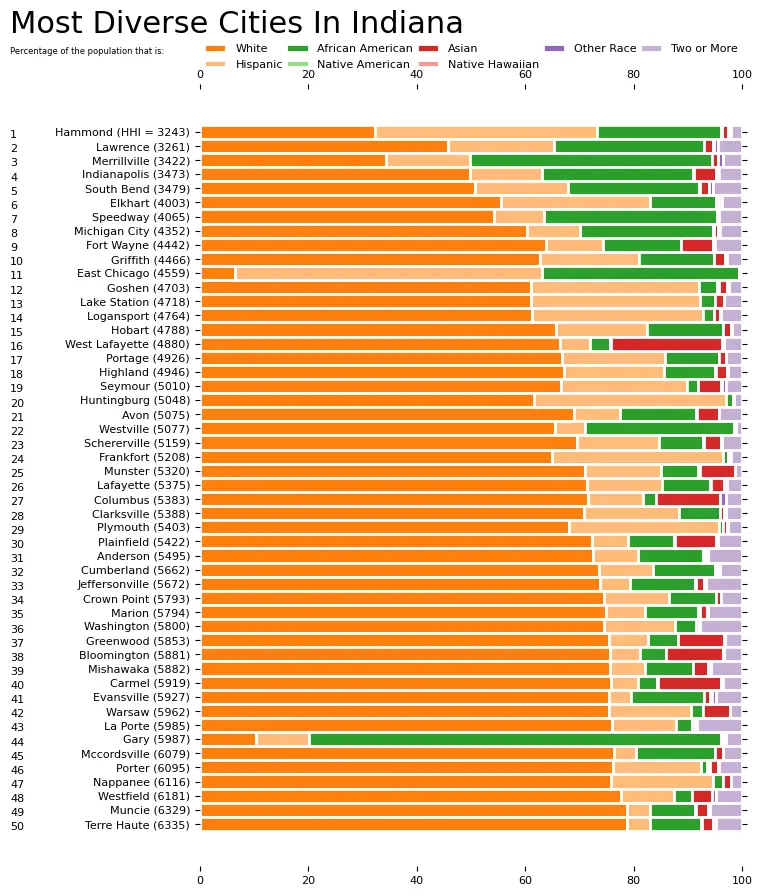
To answer that question, we went to the US Census data. Using Saturday Night Science, we measured the Gini coefficient for all 125 cities in Indiana to rank them from most to least diverse.
Table Of Contents: Top Ten | Methodology | Summary | Table
Here are the 10 most diverse places in Indiana for 2026:
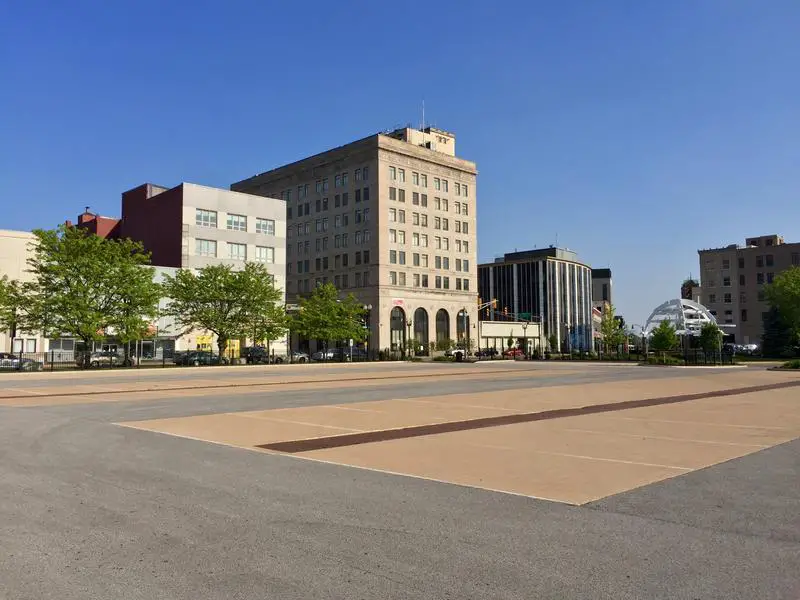
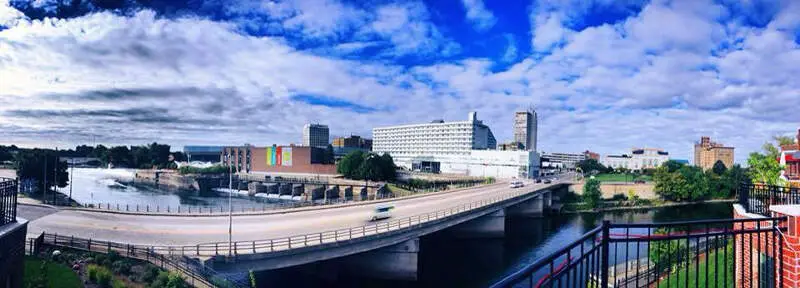
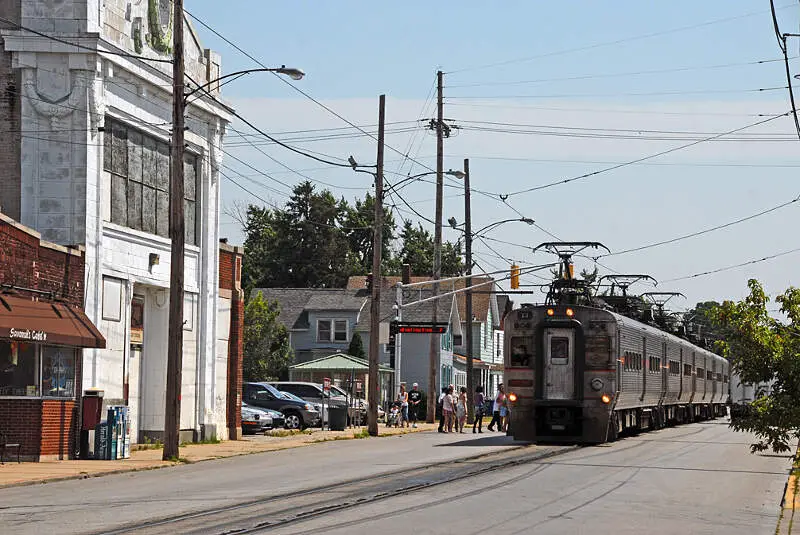
So what city is the most diverse in Indiana? According to the most Census data, Hammond took the number one over all spot for diversity in Indiana.
Read on below to see how we crunched the numbers and how your town ranked. To see where Indiana ranked as a state, we have a ranking of the most diverse states in Ameria.
For more Indiana reading:
The 10 Most Diverse Places In Indiana For 2026

/10
Population: 76,768
HHI: 3,193
% White: 32.5%
% African American: 22.5%
% Hispanic: 40.2%
% Asian: 1.5%
More on Hammond: Data | Crime | Cost Of Living | Movers

/10
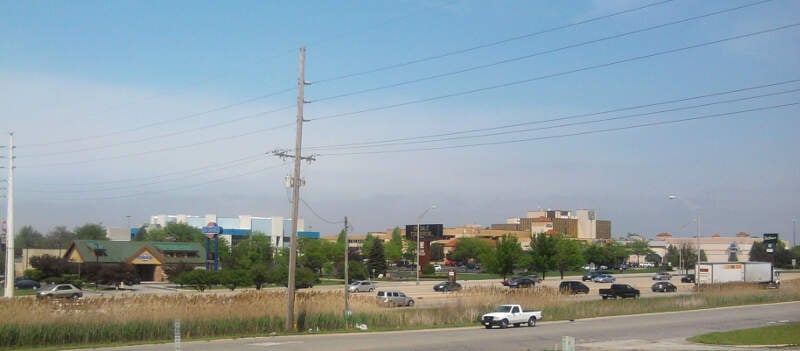
Population: 49,517
HHI: 3,285
% White: 46.1%
% African American: 28.4%
% Hispanic: 18.0%
% Asian: 2.0%
More on Lawrence: Data | Crime | Cost Of Living | Movers

/10
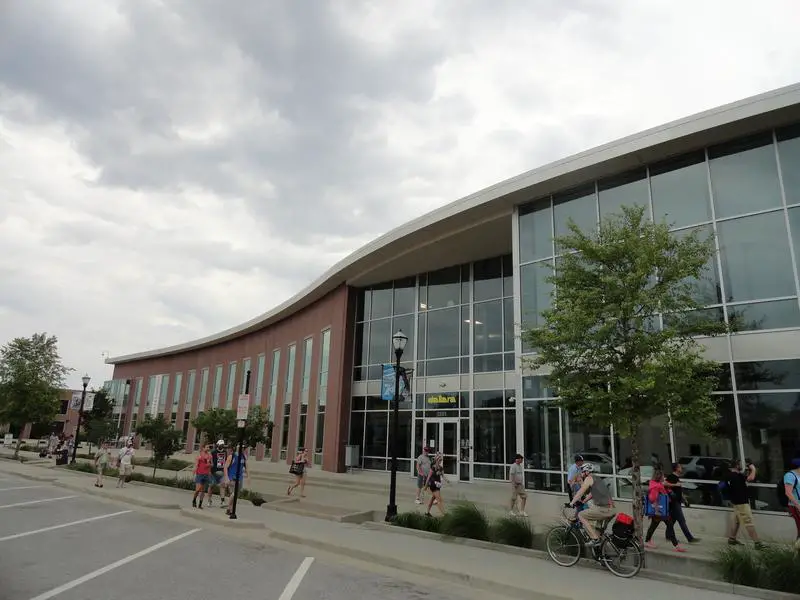
Population: 885,860
HHI: 3,382
% White: 48.9%
% African American: 27.6%
% Hispanic: 13.8%
% Asian: 4.2%
More on Indianapolis: Data | Crime | Cost Of Living | Movers

/10
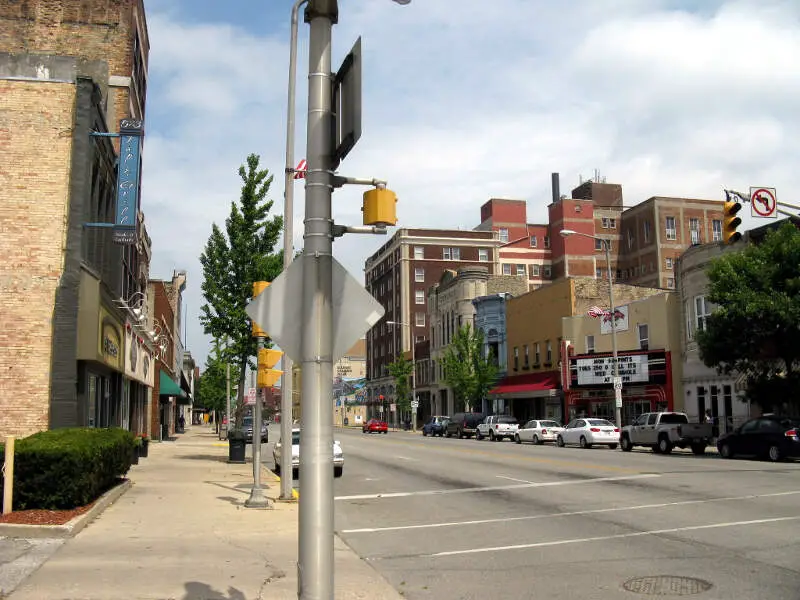
Population: 103,085
HHI: 3,455
% White: 50.9%
% African American: 22.4%
% Hispanic: 17.9%
% Asian: 2.3%
More on South Bend: Data | Crime | Cost Of Living | Movers

/10
Population: 36,476
HHI: 3,494
% White: 33.4%
% African American: 46.1%
% Hispanic: 15.6%
% Asian: 1.0%
More on Merrillville: Data | Crime | Cost Of Living | Movers

/10
Population: 13,968
HHI: 3,836
% White: 51.7%
% African American: 32.5%
% Hispanic: 8.8%
% Asian: 2.8%
More on Speedway: Data | Crime | Cost Of Living | Movers

/10
Population: 53,733
HHI: 3,920
% White: 54.9%
% African American: 12.4%
% Hispanic: 27.0%
% Asian: 0.5%
More on Elkhart: Data | Crime | Cost Of Living | Movers

/10
Population: 16,273
HHI: 4,052
% White: 58.7%
% African American: 14.5%
% Hispanic: 19.1%
% Asian: 2.0%
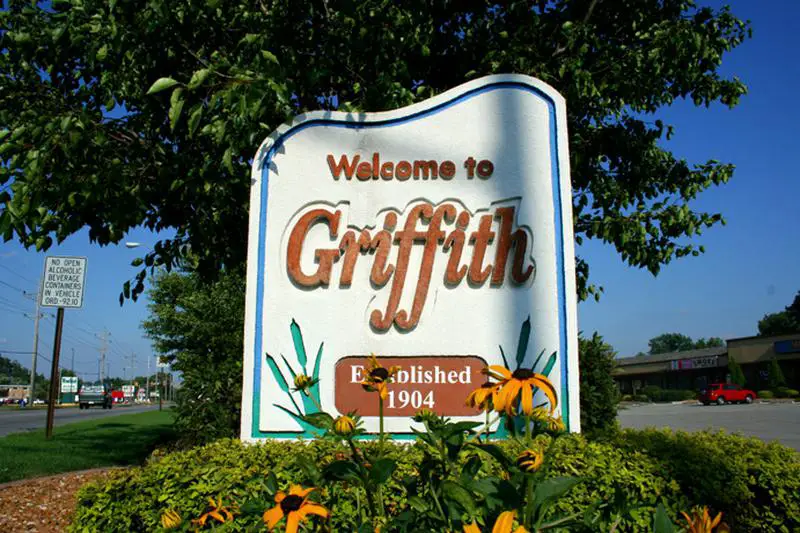
More on Griffith: Data | Crime | Cost Of Living | Movers

/10
Population: 268,589
HHI: 4,374
% White: 63.2%
% African American: 14.0%
% Hispanic: 10.6%
% Asian: 6.1%
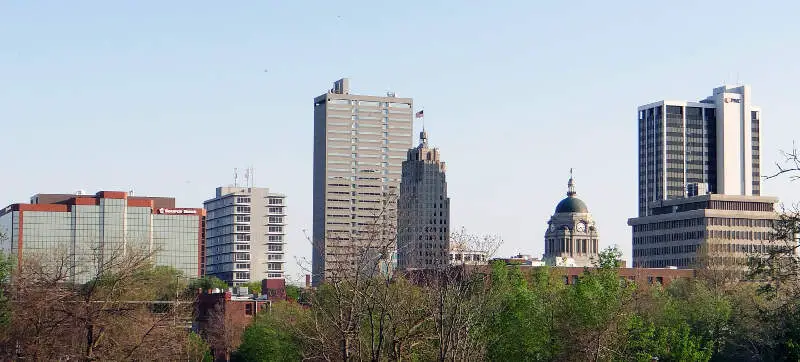
More on Fort Wayne: Data | Crime | Cost Of Living | Movers
/10
Population: 31,814
HHI: 4,393
% White: 61.0%
% African American: 23.8%
% Hispanic: 8.9%
% Asian: 0.7%
More on Michigan City: Data | Crime | Cost Of Living | Movers
Methodology: How we determined the most diverse cities in Indiana for 2026
We still believe in the accuracy of data — especially from the Census — and Saturday Night Science. So that’s where we went to get the race breakdown across Indiana.
That leads us to the Census’s most recently available data, the 2020-2024 American Community Survey data from the US Census.
Specifically, we looked at table B03002: HISPANIC OR LATINO ORIGIN BY RACE. Here are the category names as defined by the Census:
- White alone*
- Black or African American alone*
- American Indian and Alaska Native alone*
- Asian alone*
- Native Hawaiian and Other Pacific Islander alone*
- Some other race alone*
- Two or more races*
- Hispanic or Latino
We limited our analysis to non-CDPs with a population greater than 5,000 people. That left us with 125 cities.
We then calculated the HHI for each city by finding the racial breakdown of a city in percent terms, squaring them, and then adding the squares together. This left us with scores ranging from 3,193 (Hammond) to 9,173 (Boonville).
Finally, we ranked each city based on the HHI, with a lower score being more diverse than a high score. Hammond took the distinction of being the most diverse, while Boonville was the least diverse city.
We updated this article for 2026. This report is our eleventh time ranking the most diverse places in Indiana.
Summary: Diversity Across Indiana
If you’re looking for a scientific breakdown of diversity across Indiana, this is an accurate list.
The most diverse cities in Indiana are Hammond, Lawrence, Indianapolis, South Bend, Merrillville, Speedway, Elkhart, Griffith, Fort Wayne, and Michigan City.
If you’re curious enough, here are the least diverse places in Indiana:
- Boonville
- Cicero
- Linton
For more Indiana reading, check out:
- Best Places To Live In Indiana
- Cheapest Places To Live In Indiana
- Most Dangerous Cities In Indiana
- Best Places To Raise A Family In Indiana
- Safest Places In Indiana
- Worst Places To Live In Indiana
Race By City In Indiana For 2026
| Rank | City | Population | HHI | % White | % Black | % Hispanic | % Asian |
|---|---|---|---|---|---|---|---|
| 1 | Hammond, IN | 76,768 | 3,193 | 32.5% | 22.5% | 40.2% | 1.5% |
| 2 | Lawrence, IN | 49,517 | 3,285 | 46.1% | 28.4% | 18.0% | 2.0% |
| 3 | Indianapolis, IN | 885,860 | 3,382 | 48.9% | 27.6% | 13.8% | 4.2% |
| 4 | South Bend, IN | 103,085 | 3,455 | 50.9% | 22.4% | 17.9% | 2.3% |
| 5 | Merrillville, IN | 36,476 | 3,494 | 33.4% | 46.1% | 15.6% | 1.0% |
| 6 | Speedway, IN | 13,968 | 3,836 | 51.7% | 32.5% | 8.8% | 2.8% |
| 7 | Elkhart, IN | 53,733 | 3,920 | 54.9% | 12.4% | 27.0% | 0.5% |
| 8 | Griffith, IN | 16,273 | 4,052 | 58.7% | 14.5% | 19.1% | 2.0% |
| 9 | Fort Wayne, IN | 268,589 | 4,374 | 63.2% | 14.0% | 10.6% | 6.1% |
| 10 | Michigan City, IN | 31,814 | 4,393 | 61.0% | 23.8% | 8.9% | 0.7% |
| 11 | Logansport, IN | 17,790 | 4,558 | 58.3% | 1.9% | 33.7% | 1.2% |
| 12 | Lake Station, IN | 13,185 | 4,589 | 59.1% | 2.5% | 32.8% | 1.4% |
| 13 | Goshen, IN | 34,420 | 4,606 | 58.7% | 2.3% | 33.8% | 1.1% |
| 14 | East Chicago, IN | 26,022 | 4,611 | 6.1% | 36.1% | 57.2% | 0.0% |
| 15 | Portage, IN | 38,082 | 4,755 | 64.8% | 9.3% | 21.3% | 1.2% |
| 16 | Hobart, IN | 29,558 | 4,755 | 65.3% | 14.3% | 16.7% | 1.1% |
| 17 | West Lafayette, IN | 45,159 | 4,794 | 65.3% | 3.5% | 5.5% | 21.9% |
| 18 | Highland, IN | 23,680 | 4,815 | 65.7% | 8.7% | 20.3% | 1.8% |
| 19 | Seymour, IN | 22,371 | 4,894 | 65.4% | 1.1% | 24.0% | 4.1% |
| 20 | Avon, IN | 23,437 | 4,964 | 68.4% | 13.8% | 7.0% | 4.6% |
| 21 | Frankfort, IN | 15,917 | 5,035 | 62.0% | 0.8% | 34.4% | 0.4% |
| 22 | Huntingburg, IN | 6,396 | 5,037 | 63.0% | 0.5% | 32.6% | 1.5% |
| 23 | Lafayette, IN | 71,159 | 5,053 | 68.7% | 10.3% | 14.4% | 2.5% |
| 24 | Westville, IN | 5,279 | 5,067 | 66.2% | 25.3% | 6.5% | 0.2% |
| 25 | Plainfield, IN | 36,369 | 5,150 | 70.0% | 11.7% | 6.6% | 6.6% |
| 26 | Munster, IN | 23,733 | 5,155 | 69.6% | 7.4% | 14.5% | 6.3% |
| 27 | Schererville, IN | 29,701 | 5,245 | 70.0% | 7.7% | 16.2% | 2.1% |
| 28 | Clarksville, IN | 22,016 | 5,263 | 70.1% | 8.7% | 15.7% | 0.8% |
| 29 | Cumberland, IN | 6,267 | 5,364 | 71.5% | 10.5% | 9.4% | 0.4% |
| 30 | Columbus, IN | 51,824 | 5,428 | 71.9% | 2.5% | 10.7% | 11.5% |
| 31 | Winfield, IN | 7,816 | 5,470 | 72.4% | 5.1% | 12.4% | 5.6% |
| 32 | Anderson, IN | 55,367 | 5,497 | 72.5% | 11.6% | 8.1% | 0.6% |
| 33 | Marion, IN | 27,531 | 5,598 | 73.4% | 9.8% | 8.3% | 1.1% |
| 34 | Jeffersonville, IN | 51,043 | 5,599 | 73.3% | 12.0% | 5.8% | 1.9% |
| 35 | Mishawaka, IN | 51,021 | 5,630 | 73.7% | 10.7% | 6.4% | 2.4% |
| 36 | Greenwood, IN | 66,029 | 5,672 | 74.1% | 5.6% | 7.6% | 9.0% |
| 37 | Bloomington, IN | 80,049 | 5,709 | 74.3% | 4.9% | 5.5% | 10.7% |
| 38 | Plymouth, IN | 10,664 | 5,779 | 71.8% | 0.7% | 24.9% | 0.7% |
| 39 | Carmel, IN | 101,651 | 5,868 | 75.4% | 3.0% | 5.5% | 11.6% |
| 40 | Evansville, IN | 116,116 | 5,910 | 75.6% | 11.7% | 4.0% | 1.0% |
| 41 | La Porte, IN | 22,449 | 5,922 | 75.4% | 4.0% | 13.5% | 0.7% |
| 42 | Gary, IN | 68,113 | 5,943 | 9.4% | 75.7% | 10.4% | 0.4% |
| 43 | Charlestown, IN | 8,294 | 5,944 | 75.7% | 3.3% | 12.3% | 0.7% |
| 44 | Westfield, IN | 54,677 | 5,950 | 76.2% | 6.1% | 8.4% | 3.7% |
| 45 | Crown Point, IN | 34,393 | 5,958 | 75.9% | 7.9% | 10.6% | 2.2% |
| 46 | Washington, IN | 12,367 | 5,981 | 76.0% | 3.6% | 11.6% | 0.5% |
| 47 | Warsaw, IN | 16,768 | 6,005 | 75.8% | 1.7% | 15.4% | 4.1% |
| 48 | White, IN | 12,466 | 6,048 | 76.8% | 4.6% | 4.2% | 9.9% |
| 49 | Rensselaer, IN | 5,573 | 6,126 | 76.5% | 2.3% | 15.4% | 0.5% |
| 50 | Brownsburg, IN | 31,215 | 6,184 | 77.4% | 12.4% | 5.4% | 1.1% |
| 51 | Porter, IN | 5,217 | 6,274 | 78.2% | 3.2% | 11.0% | 2.2% |
| 52 | Muncie, IN | 64,751 | 6,281 | 78.4% | 8.1% | 4.4% | 2.1% |
| 53 | Terre Haute, IN | 58,427 | 6,329 | 78.7% | 8.7% | 4.4% | 2.1% |
| 54 | Richmond, IN | 35,581 | 6,331 | 78.8% | 6.2% | 5.4% | 1.5% |
| 55 | Nappanee, IN | 6,815 | 6,341 | 78.1% | 2.5% | 15.2% | 1.8% |
| 56 | Kokomo, IN | 59,122 | 6,348 | 78.8% | 9.9% | 4.3% | 2.0% |
| 57 | Dyer, IN | 16,400 | 6,369 | 78.6% | 2.4% | 12.7% | 3.1% |
| 58 | St. John, IN | 22,567 | 6,398 | 78.7% | 2.3% | 13.6% | 2.0% |
| 59 | New Albany, IN | 37,581 | 6,446 | 79.5% | 7.7% | 5.5% | 1.3% |
| 60 | Mccordsville, IN | 10,329 | 6,489 | 79.7% | 10.2% | 3.8% | 2.1% |
| 61 | Valparaiso, IN | 34,733 | 6,540 | 80.1% | 3.3% | 9.9% | 2.4% |
| 62 | Princeton, IN | 8,372 | 6,549 | 80.2% | 4.9% | 7.1% | 0.9% |
| 63 | Hunte, IN | 11,379 | 6,687 | 81.3% | 4.2% | 5.8% | 5.0% |
| 64 | Rochester, IN | 6,215 | 6,730 | 81.4% | 1.1% | 8.6% | 0.1% |
| 65 | Noblesville, IN | 73,362 | 6,837 | 82.2% | 5.0% | 5.7% | 3.5% |
| 66 | Winona Lake, IN | 5,080 | 6,843 | 81.8% | 1.0% | 11.4% | 0.5% |
| 67 | Beech Grove, IN | 14,913 | 6,858 | 82.2% | 7.3% | 4.4% | 1.3% |
| 68 | Shelbyville, IN | 20,296 | 7,067 | 83.4% | 2.5% | 10.0% | 1.8% |
| 69 | New Haven, IN | 15,698 | 7,067 | 83.6% | 4.2% | 5.6% | 1.9% |
| 70 | Greencastle, IN | 9,864 | 7,097 | 83.9% | 5.1% | 3.5% | 2.6% |
| 71 | Crawfordsville, IN | 16,491 | 7,130 | 83.8% | 1.8% | 9.8% | 0.6% |
| 72 | Vincennes, IN | 16,586 | 7,290 | 85.0% | 3.5% | 5.1% | 0.9% |
| 73 | Zionsville, IN | 32,095 | 7,309 | 85.2% | 4.7% | 3.4% | 4.3% |
| 74 | Jasper, IN | 15,991 | 7,328 | 84.9% | 1.0% | 10.6% | 0.7% |
| 75 | New Whiteland, IN | 5,704 | 7,374 | 85.0% | 0.0% | 3.3% | 0.0% |
| 76 | Cedar Lake, IN | 15,295 | 7,427 | 85.6% | 0.2% | 8.5% | 1.0% |
| 77 | Kendallville, IN | 10,556 | 7,482 | 86.0% | 0.2% | 9.0% | 1.7% |
| 78 | Chesterton, IN | 14,446 | 7,485 | 86.2% | 1.7% | 6.2% | 1.9% |
| 79 | Portland, IN | 6,416 | 7,507 | 85.9% | 0.6% | 11.1% | 0.0% |
| 80 | Peru, IN | 10,901 | 7,555 | 86.6% | 2.9% | 4.7% | 0.1% |
| 81 | Lowell, IN | 11,073 | 7,567 | 86.4% | 0.3% | 9.8% | 0.0% |
| 82 | Whiteland, IN | 5,173 | 7,651 | 87.1% | 6.9% | 1.1% | 1.7% |
| 83 | Bargersville, IN | 10,752 | 7,663 | 87.3% | 3.2% | 0.9% | 5.1% |
| 84 | Scottsburg, IN | 7,362 | 7,673 | 87.3% | 0.9% | 3.7% | 0.0% |
| 85 | Decatur, IN | 9,811 | 7,711 | 87.2% | 0.7% | 9.7% | 0.0% |
| 86 | Pendleton, IN | 5,321 | 7,752 | 87.5% | 0.3% | 9.8% | 0.3% |
| 87 | Angola, IN | 9,408 | 7,768 | 87.8% | 1.8% | 6.8% | 0.9% |
| 88 | Lebanon, IN | 17,812 | 7,813 | 88.0% | 0.6% | 7.8% | 0.2% |
| 89 | Columbia City, IN | 9,897 | 7,846 | 88.2% | 0.3% | 6.7% | 0.2% |
| 90 | North Vernon, IN | 7,078 | 7,870 | 88.3% | 0.9% | 7.8% | 1.3% |
| 91 | Gas City, IN | 6,076 | 7,953 | 88.9% | 0.8% | 4.7% | 0.3% |
| 92 | Bluffton, IN | 10,529 | 7,960 | 89.0% | 1.8% | 5.8% | 0.2% |
| 93 | New Castle, IN | 17,367 | 7,996 | 89.2% | 3.5% | 2.2% | 0.7% |
| 94 | Greenfield, IN | 24,940 | 8,054 | 89.6% | 2.1% | 3.2% | 1.7% |
| 95 | Madison, IN | 12,223 | 8,056 | 89.6% | 2.2% | 2.0% | 1.3% |
| 96 | Yor, IN | 11,699 | 8,063 | 89.6% | 1.2% | 1.4% | 3.1% |
| 97 | Tipton, IN | 5,280 | 8,114 | 89.9% | 2.5% | 4.2% | 0.0% |
| 98 | Greensburg, IN | 12,229 | 8,116 | 89.9% | 0.5% | 4.9% | 0.0% |
| 99 | Franklin, IN | 26,168 | 8,126 | 90.0% | 2.7% | 2.7% | 1.5% |
| 100 | Rushville, IN | 6,036 | 8,154 | 90.1% | 1.8% | 3.8% | 0.0% |