Racial diversity in Pennsylvania is a mixed bag.
There are parts of Pennsylvania where there’s a high level of diversity. But where will you find the most diverse places in Pennsylvania?
To answer that question, we went to the US Census data. Using Saturday Night Science, we measured the Gini coefficient for all 191 cities in Pennsylvania to rank them from most to least diverse.
#1 most diverse in Pennsylvania
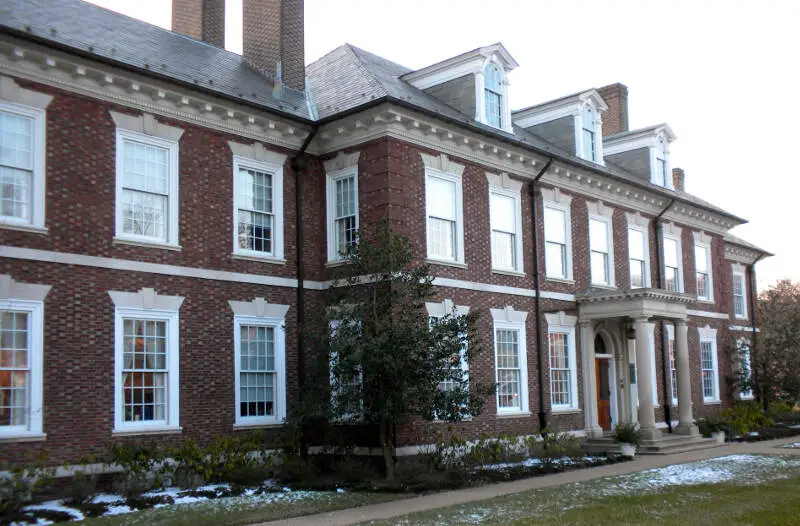
Coatesville is a city in Chester County, Pennsylvania, United States. The population was 13,100 at the 2010 census. Coatesville is approximately 39 miles west of Philadelphia. It developed along Lancaster Turnpike, beginning in the late 18th century. It spans Rt. 30, the “Main Line” highway that runs west of Philadelphia.
Data | Crime | Cost of living | Movers
#2 most diverse in Pennsylvania
Data | Crime | Cost of living | Movers
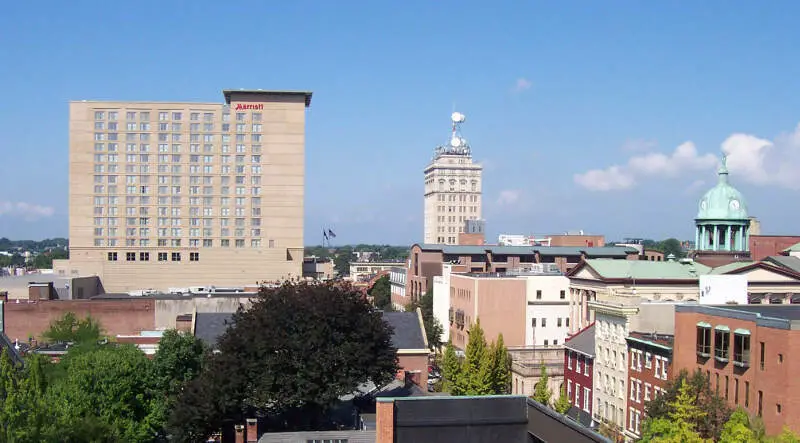
#3 most diverse in Pennsylvania
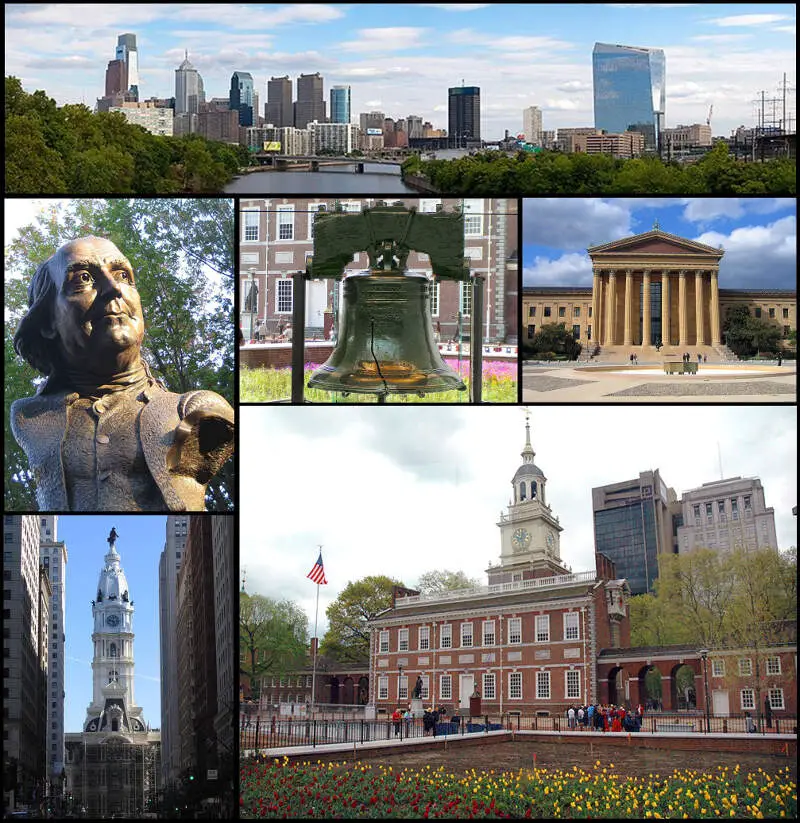
Philadelphia is the largest city in the Commonwealth of Pennsylvania and the sixth-most populous city in the United States, with an estimated population of 1,567,872 and more than 6million in the seventh-largest metropolitan statistical area, as of 2016. Philadelphia is the economic and cultural anchor of the Delaware Valley region, located along the lower Delaware and Schuylkill Rivers. The region’s population of 7.2million ranks it as the eighth-largest combined statistical area in the United States.
Data | Crime | Cost of living | Movers

#4 most diverse in Pennsylvania
Harrisburg is the capital city of the Commonwealth of Pennsylvania in the United States, and the county seat of Dauphin County. With a population of 48,904, it is the ninth-largest city in the Commonwealth. It lies on the east bank of the Susquehanna River, 107 miles west of Philadelphia.
Data | Crime | Cost of living | Movers
#5 most diverse in Pennsylvania
York, known as the White Rose City, is the county seat of York County, Pennsylvania, United States, located in the south-central region of the state. The population within York’s city limits was 43,718 at the 2010 census, a 7.0% increase from the 2000 count of 40,862. When combined with the adjacent boroughs of West York and North York and surrounding Spring Garden, West Manchester, and Springettsbury townships, the population of Greater York was 108,386. York is the 11th largest city in Pennsylvania.
Data | Crime | Cost of living | Movers
#6 most diverse in Pennsylvania
Steelton is a borough in Dauphin County, Pennsylvania, United States, 4 miles southeast of Harrisburg. The population was 5,990 at the 2010 census. The borough is part of the Harrisburg-Carlisle Metropolitan Statistical Area.
Data | Crime | Cost of living | Movers
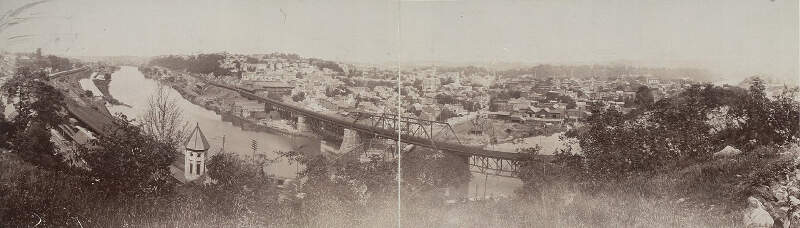
#7 most diverse in Pennsylvania
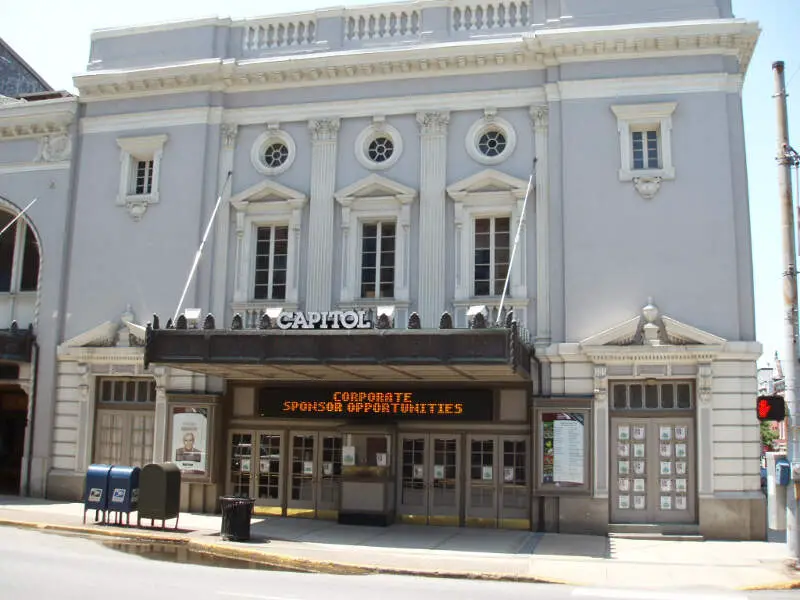
Lancaster is a city located in South Central Pennsylvania which serves as the seat of Pennsylvania’s Lancaster County and one of the oldest inland towns in the United States. With a population of 59,322, it ranks eighth in population among Pennsylvania’s cities. The Lancaster metropolitan area population is 507,766, making it the 101st largest metropolitan area in the U.S. and second largest in the South Central Pennsylvania area.
Data | Crime | Cost of living | Movers
#8 most diverse in Pennsylvania
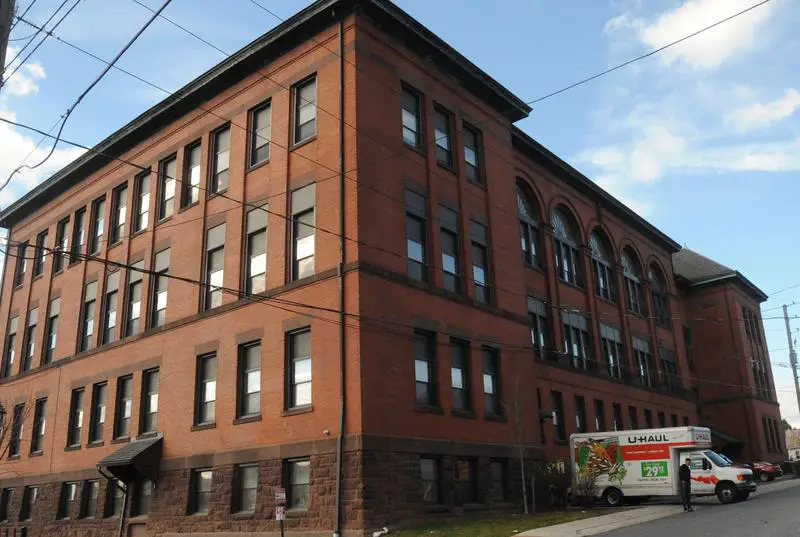
Easton is a city in and the seat of Northampton County, Pennsylvania, United States. The city’s population was 26,800 as of the 2010 census. Easton is located at the confluence of the Delaware River and the Lehigh River, roughly 55 miles north of Philadelphia and 70 miles west of New York City.
Data | Crime | Cost of living | Movers
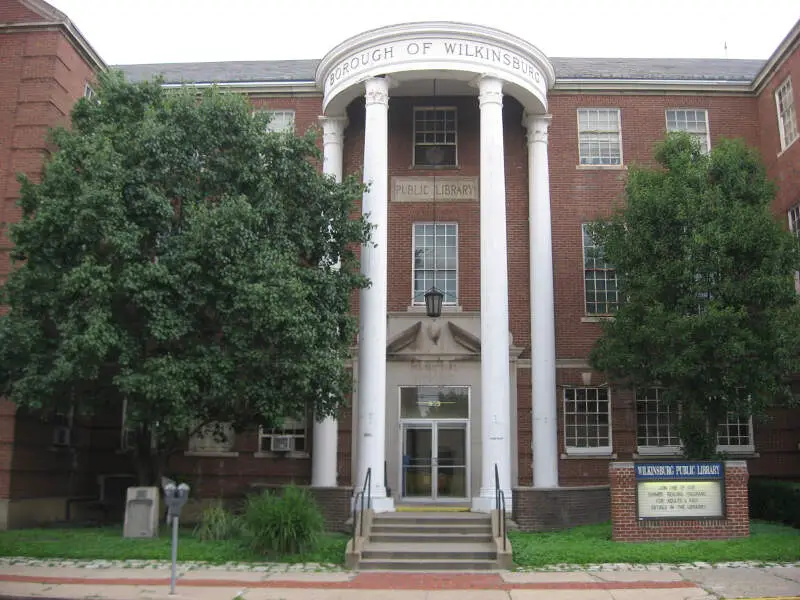
#9 most diverse in Pennsylvania
Wilkinsburg is a borough in Allegheny County, Pennsylvania, United States adjacent to the city of Pittsburgh. The population was 15,930 at the 2010 census, having lost more than 13,000 in the 70 years since 1940, when 29,853 people were enumerated. The borough was named for John Wilkins, Jr., a United States Army officer who served as Quartermaster General of the United States Army from 1796 to 1802.
Data | Crime | Cost of living | Movers
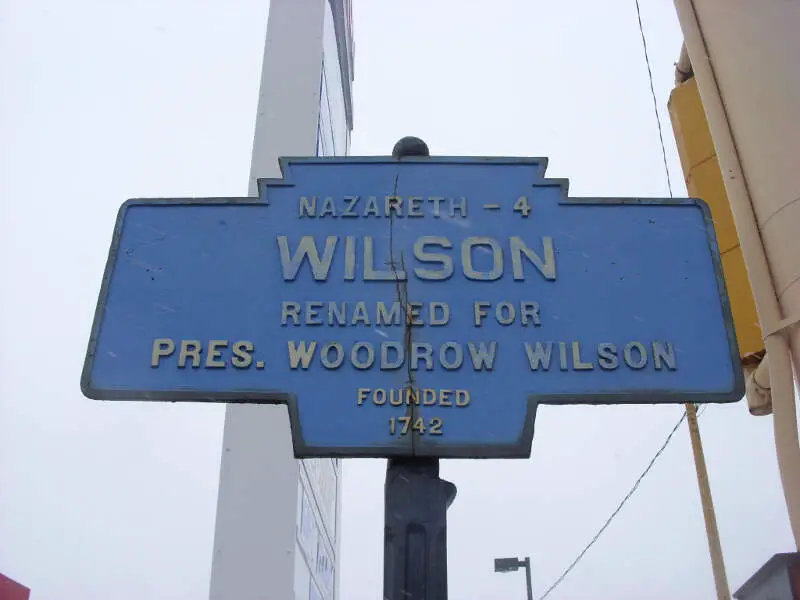
#10 most diverse in Pennsylvania
Wilson is a borough in Northampton County, Pennsylvania, United States. It is part of Pennsylvania’s Lehigh Valley region, and is adjacent to the city of Easton.
Data | Crime | Cost of living | Movers
The receipts
Compare the top ten
Pick a metric. The bars rescale. The red line is Pennsylvania’s statewide median.
On the map
Where diversity lives in Pennsylvania
Saturday Night Science
Methodology: How we determined the most diverse cities in Pennsylvania for 2026
We still believe in the accuracy of data — especially from the Census — and Saturday Night Science. So that’s where we went to get the race breakdown across Pennsylvania.
That leads us to the Census’s most recently available data, the 2020-2024 American Community Survey data from the US Census.
Specifically, we looked at table B03002: HISPANIC OR LATINO ORIGIN BY RACE. Here are the category names as defined by the Census:
- White alone*
- Black or African American alone*
- American Indian and Alaska Native alone*
- Asian alone*
- Native Hawaiian and Other Pacific Islander alone*
- Some other race alone*
- Two or more races*
- Hispanic or Latino
We limited our analysis to non-CDPs with a population greater than 5,000 people. That left us with 191 cities.
We then calculated the HHI for each city by finding the racial breakdown of a city in percent terms, squaring them, and then adding the squares together. This left us with scores ranging from 2,856 (Coatesville) to 9,467 (Archbald).
Finally, we ranked each city based on the HHI, with a lower score being more diverse than a high score. Coatesville took the distinction of being the most diverse, while Archbald was the least diverse city.
We updated this article for 2026. This report is our eleventh time ranking the most diverse places in Pennsylvania.
The full plate
Race By City In Pennsylvania For 2026
Click any column to sort. Search by city name.
| Rank | City | Population | HHI | % White | % Black | % Hispanic | % Asian |
|---|---|---|---|---|---|---|---|
| 1 | Coatesville | 13,353 | 2,856 | 28.9% | 32.4% | 30.2% | 0.6% |
| 2 | Norri | 35,893 | 2,886 | 26.1% | 31.0% | 34.8% | 2.1% |
| 3 | Philadelphia | 1,579,706 | 2,893 | 33.2% | 38.3% | 15.6% | 7.9% |
| 4 | Harrisburg | 50,287 | 3,034 | 25.2% | 40.9% | 26.4% | 2.2% |
| 5 | York | 44,938 | 3,069 | 33.6% | 24.1% | 36.6% | 1.0% |
| 6 | Steelton | 6,296 | 3,168 | 32.0% | 41.2% | 20.2% | 0.6% |
| 7 | Lancaster | 57,719 | 3,388 | 39.7% | 12.0% | 40.6% | 2.9% |
| 8 | Easton | 29,739 | 3,540 | 51.3% | 16.3% | 24.9% | 1.6% |
| 9 | Wilkinsburg | 14,027 | 3,575 | 36.6% | 46.2% | 5.3% | 2.3% |
| 10 | Wilson | 8,183 | 3,601 | 53.0% | 13.5% | 23.5% | 4.0% |
| 11 | McKees Rocks | 5,786 | 3,606 | 54.3% | 22.1% | 5.3% | 0.8% |
| 12 | Pott | 23,476 | 3,658 | 54.1% | 22.6% | 12.5% | 3.3% |
| 13 | Duquesne | 5,149 | 3,747 | 39.3% | 45.2% | 3.0% | 0.0% |
| 14 | Folcroft | 6,772 | 3,770 | 38.0% | 47.4% | 7.2% | 1.7% |
| 15 | McKeesport | 17,380 | 3,804 | 49.3% | 35.7% | 4.5% | 0.7% |
| 16 | Wilkes-Barre | 44,423 | 3,805 | 50.5% | 9.7% | 33.8% | 1.6% |
| 17 | Stroudsburg | 5,894 | 3,820 | 55.9% | 11.0% | 22.1% | 0.6% |
| 18 | Bridgeport | 5,174 | 3,877 | 58.7% | 2.4% | 13.0% | 7.0% |
| 19 | West York | 5,092 | 3,934 | 54.6% | 14.3% | 27.2% | 0.0% |
| 20 | East Stroudsburg | 9,319 | 3,938 | 56.6% | 19.2% | 18.8% | 2.6% |
| 21 | Clifton Heights | 6,832 | 4,015 | 49.4% | 38.8% | 2.0% | 2.3% |
| 22 | Clairton | 6,044 | 4,047 | 45.3% | 43.9% | 4.0% | 0.0% |
| 23 | Bethlehem | 77,956 | 4,065 | 56.1% | 8.2% | 28.7% | 2.8% |
| 24 | Swissvale | 8,418 | 4,098 | 56.6% | 28.7% | 4.7% | 3.4% |
| 25 | Allentown | 125,976 | 4,111 | 28.9% | 9.8% | 56.3% | 1.9% |
| 26 | Collingdale | 8,897 | 4,130 | 27.8% | 57.2% | 7.3% | 4.3% |
| 27 | Aliquippa | 9,079 | 4,133 | 53.6% | 34.7% | 5.1% | 0.6% |
| 28 | Lansdowne | 11,122 | 4,143 | 41.0% | 49.2% | 4.3% | 1.6% |
| 29 | Oxford | 5,825 | 4,160 | 56.1% | 6.8% | 30.8% | 2.7% |
| 30 | Downin | 8,255 | 4,198 | 61.1% | 13.0% | 6.7% | 15.3% |
| 31 | Lebanon | 26,536 | 4,314 | 47.3% | 2.6% | 45.4% | 1.2% |
| 32 | Kennett Square | 6,243 | 4,316 | 46.5% | 3.1% | 46.1% | 0.2% |
| 33 | Pittsburgh | 304,759 | 4,396 | 61.9% | 22.1% | 4.5% | 6.1% |
| 34 | Turtle Creek | 5,007 | 4,542 | 58.4% | 33.0% | 1.2% | 1.5% |
| 35 | Morrisville | 9,752 | 4,582 | 65.0% | 11.9% | 12.9% | 4.7% |
| 36 | Ambridge | 6,890 | 4,589 | 63.8% | 19.4% | 7.9% | 0.0% |
| 37 | Scranton | 76,033 | 4,624 | 64.9% | 6.6% | 17.9% | 5.3% |
| 38 | Erie | 93,850 | 4,704 | 65.7% | 16.3% | 8.6% | 2.8% |
| 39 | Lansdale | 19,011 | 4,751 | 66.3% | 5.8% | 8.3% | 15.3% |
| 40 | Chambersburg | 22,319 | 4,874 | 65.6% | 7.0% | 22.6% | 0.8% |
| 41 | Columbia | 10,278 | 4,954 | 66.1% | 7.7% | 22.9% | 0.0% |
| 42 | Beaver Falls | 8,850 | 4,973 | 66.0% | 24.0% | 2.8% | 1.3% |
| 43 | Johnstown | 18,087 | 5,003 | 68.4% | 13.2% | 6.2% | 1.0% |
| 44 | Hazleton | 30,111 | 5,096 | 32.6% | 1.7% | 63.4% | 0.3% |
| 45 | Swarthmore | 6,550 | 5,109 | 70.0% | 10.0% | 6.8% | 6.0% |
| 46 | Glenolden | 7,220 | 5,132 | 69.1% | 17.1% | 6.6% | 1.3% |
| 47 | Chester | 33,619 | 5,280 | 13.3% | 70.5% | 11.1% | 0.8% |
| 48 | Gettysburg | 8,254 | 5,326 | 70.6% | 4.2% | 16.5% | 6.8% |
| 49 | Bristol | 9,902 | 5,397 | 71.1% | 3.7% | 16.7% | 1.3% |
| 50 | Middl | 9,632 | 5,398 | 72.1% | 6.0% | 9.8% | 3.5% |
| 51 | Washington | 13,368 | 5,398 | 71.4% | 15.0% | 4.0% | 1.8% |
| 52 | Coraopolis | 5,417 | 5,408 | 71.2% | 16.2% | 5.2% | 0.5% |
| 53 | Reading | 95,242 | 5,415 | 18.5% | 7.7% | 70.8% | 0.5% |
| 54 | Sharon | 12,936 | 5,476 | 71.5% | 17.7% | 4.1% | 0.3% |
| 55 | West Chester | 20,666 | 5,557 | 72.7% | 13.5% | 8.3% | 2.1% |
| 56 | Monessen | 6,780 | 5,591 | 72.2% | 18.8% | 2.3% | 0.4% |
| 57 | West Hazleton | 5,178 | 5,651 | 20.3% | 2.0% | 72.2% | 0.0% |
| 58 | Taylor | 6,265 | 5,659 | 73.2% | 1.8% | 16.2% | 2.9% |
| 59 | New Holland | 5,780 | 5,685 | 74.2% | 5.0% | 10.9% | 4.5% |
| 60 | Williamsport | 27,612 | 5,732 | 74.2% | 12.0% | 4.5% | 1.4% |
| 61 | Prospect Park | 6,417 | 5,740 | 73.8% | 14.7% | 0.1% | 2.9% |
| 62 | Shillington | 5,492 | 5,744 | 72.6% | 1.7% | 21.2% | 0.3% |
| 63 | Ambler | 6,847 | 5,783 | 74.4% | 13.7% | 7.1% | 2.5% |
| 64 | Souderton | 7,181 | 5,791 | 74.1% | 1.6% | 16.3% | 4.6% |
| 65 | Plymouth | 5,770 | 5,844 | 75.0% | 7.1% | 11.9% | 0.0% |
| 66 | Millersville | 8,982 | 5,861 | 75.2% | 4.0% | 12.9% | 4.1% |
| 67 | Collegeville | 5,247 | 5,922 | 76.0% | 5.3% | 5.6% | 6.8% |
| 68 | Carlisle | 21,852 | 5,926 | 75.8% | 9.5% | 8.4% | 2.6% |
| 69 | State College | 41,050 | 5,940 | 76.0% | 3.7% | 6.1% | 9.4% |
| 70 | New Castle | 21,579 | 5,945 | 75.7% | 10.8% | 4.2% | 0.0% |
| 71 | Sharon Hill | 6,002 | 5,977 | 17.5% | 75.1% | 4.0% | 0.0% |
| 72 | Kingston | 13,397 | 6,019 | 76.3% | 11.3% | 7.9% | 1.6% |
| 73 | New Brighton | 5,567 | 6,035 | 76.1% | 13.5% | 4.2% | 0.1% |
| 74 | Quake | 9,319 | 6,063 | 76.4% | 3.4% | 13.7% | 4.5% |
| 75 | Phoenixville | 19,452 | 6,089 | 77.1% | 3.7% | 7.6% | 4.1% |
| 76 | Forest Hills | 6,286 | 6,117 | 76.9% | 12.4% | 4.8% | 0.7% |
| 77 | Catasauqua | 6,541 | 6,187 | 76.5% | 3.3% | 17.7% | 0.0% |
| 78 | Uniontown | 9,742 | 6,224 | 77.2% | 15.7% | 2.0% | 0.8% |
| 79 | Nanticoke | 10,653 | 6,234 | 77.6% | 9.0% | 10.9% | 0.0% |
| 80 | Whitehall | 14,811 | 6,267 | 77.7% | 4.3% | 1.8% | 14.4% |
| 81 | Hanover | 16,584 | 6,278 | 78.0% | 3.4% | 12.7% | 1.5% |
| 82 | New Cumberland | 7,580 | 6,285 | 78.4% | 3.8% | 8.8% | 2.9% |
| 83 | Crafton | 5,961 | 6,395 | 79.1% | 10.2% | 4.7% | 2.9% |
| 84 | Helle | 6,118 | 6,401 | 78.2% | 0.9% | 16.6% | 0.3% |
| 85 | Jeannette | 8,657 | 6,401 | 79.0% | 9.7% | 6.8% | 1.0% |
| 86 | Duryea | 5,084 | 6,410 | 77.5% | 0.1% | 19.9% | 1.4% |
| 87 | Brentwood | 9,866 | 6,412 | 78.8% | 11.9% | 0.1% | 2.1% |
| 88 | Moosic | 5,973 | 6,417 | 79.5% | 3.8% | 6.4% | 2.9% |
| 89 | Palmyra | 7,755 | 6,431 | 78.9% | 1.3% | 13.9% | 2.0% |
| 90 | Franklin Park | 15,235 | 6,451 | 79.0% | 1.6% | 2.7% | 13.6% |
| 91 | Carnegie | 7,978 | 6,489 | 79.7% | 10.2% | 2.2% | 2.7% |
| 92 | Pittston | 7,626 | 6,495 | 79.4% | 3.7% | 12.9% | 1.3% |
| 93 | Connellsville | 6,849 | 6,573 | 79.9% | 5.4% | 0.3% | 1.2% |
| 94 | Baldwin | 21,057 | 6,580 | 80.5% | 3.4% | 2.3% | 8.4% |
| 95 | Carbondale | 8,789 | 6,603 | 80.2% | 2.2% | 10.9% | 0.0% |
| 96 | Hatboro | 8,283 | 6,660 | 81.0% | 6.3% | 5.4% | 4.8% |
| 97 | Media | 5,870 | 6,736 | 81.6% | 3.7% | 5.0% | 4.9% |
| 98 | Milton | 6,534 | 6,763 | 81.3% | 0.5% | 11.6% | 2.9% |
| 99 | Sunbury | 9,617 | 6,842 | 81.8% | 3.3% | 11.0% | 0.0% |
| 100 | Northampton | 10,400 | 6,847 | 81.7% | 2.1% | 12.7% | 0.9% |
Source: U.S. Census ACS 2020-2024. 191 cities with more than 5,000 residents.
Summary
Summary: Diversity Across Pennsylvania
If you’re looking for a scientific breakdown of diversity across Pennsylvania, this is an accurate list.
The most diverse cities in Pennsylvania are Coatesville, Norri, Philadelphia, Harrisburg, York, Steelton, Lancaster, Easton, Wilkinsburg, and Wilson.


