Most Native American places in Washington research summary. We used Saturday Night Science to research the Washington cities with the highest percentage of Native American residents for 2026. The data comes from the American Community Survey 2020-2024 vintage, which breaks down race by origin.
-
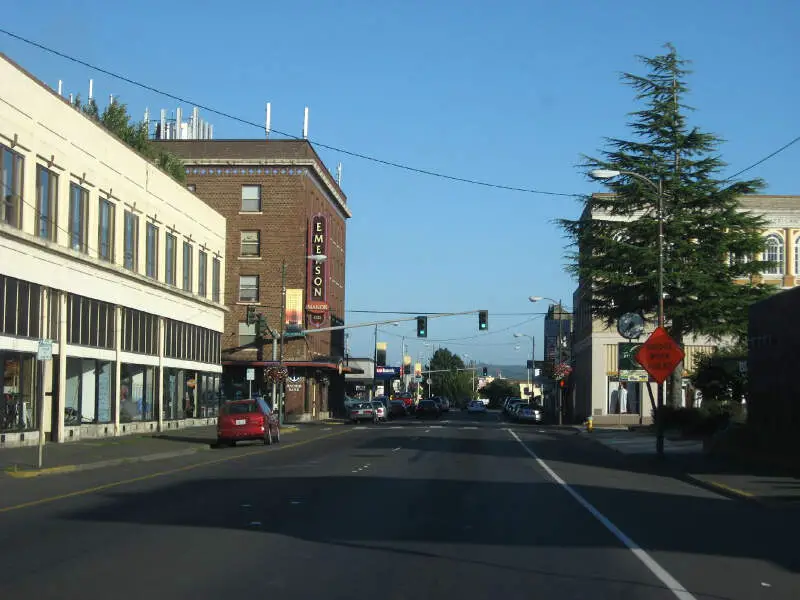
The city with the highest percentage of Native Americans is Hoquiam. 4.12% of people in Hoquiam are Native Americans.
-
The city with the lowest percentage of Native Americans is Othello. 0.00% of people in Othello are Native American.
-
The city with the most Native Americans is Seattle. 2,385 people in Seattle are Native American.
-
The city with the fewest Native Americans is Othello. 0 people in Othello are Native American.
-
The United States has 1,698,432 Native Americans and is 0.51% Native American.
Table Of Contents: Top Ten | Methodology | Summary | Table
The 10 Cities In Washington With The Largest Native American Population For 2026
Which city in Washington had the largest Native American population? The place with the largest Native American population in Washington for 2026 is Hoquiam. 4.12 of Hoquiam identify as Native American.
To see where Washington ranked as a state on diversity, we have a ranking of the most diverse states in America.
And if you already knew these places were Native American, check out the best places to live in Washington or the most diverse places in Washington.
Read below to see how we crunched the numbers and how your town ranked.
Cities In Washington With The Largest Native American Population For 2026

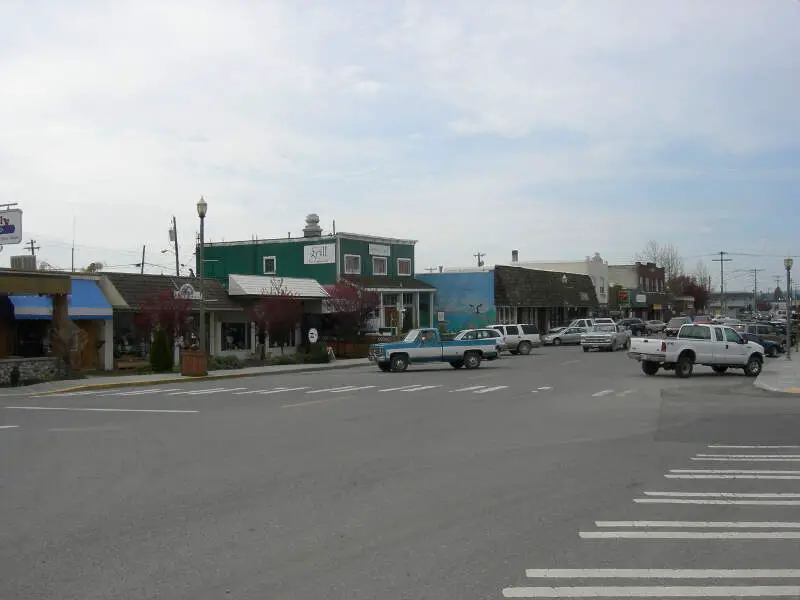
/10
Population: 8,800
# Of Native American Residents: 363
% Native American: 4.12%
More on Hoquiam: Data | Crime | Cost Of Living | Movers

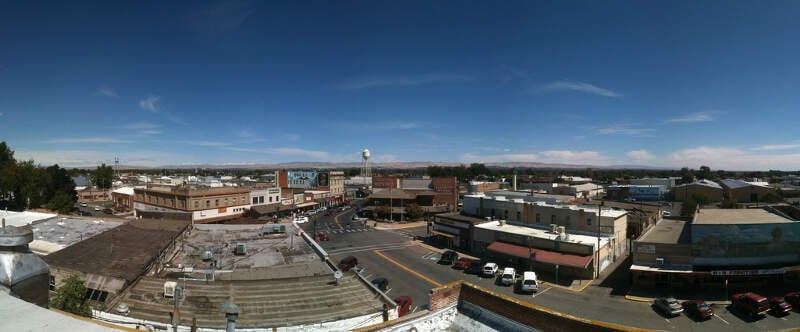
/10
Population: 11,245
# Of Native American Residents: 370
% Native American: 3.29%
More on Airway Heights: Data | Crime | Cost Of Living | Movers

/10
Population: 7,302
# Of Native American Residents: 209
% Native American: 2.86%
More on Ocean Shores: Data | Crime | Cost Of Living | Movers

/10
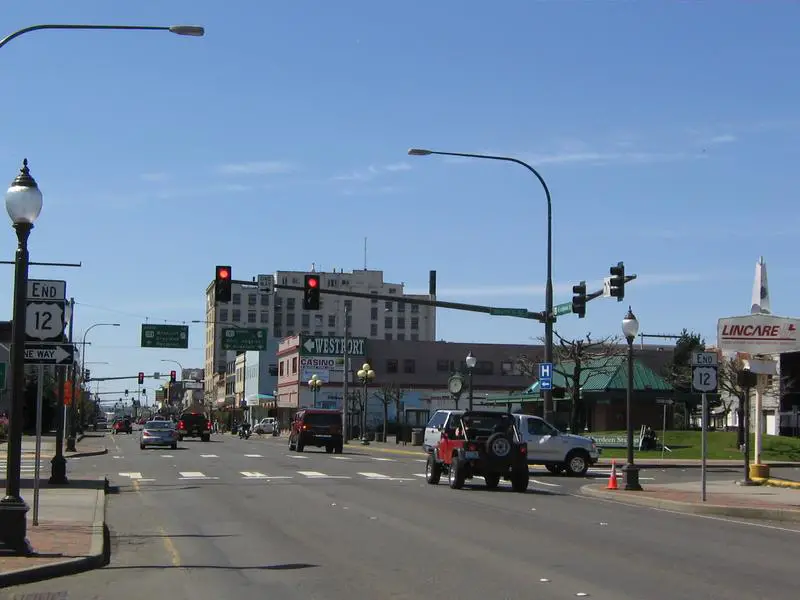
Population: 17,088
# Of Native American Residents: 489
% Native American: 2.86%
More on Aberdeen: Data | Crime | Cost Of Living | Movers

/10
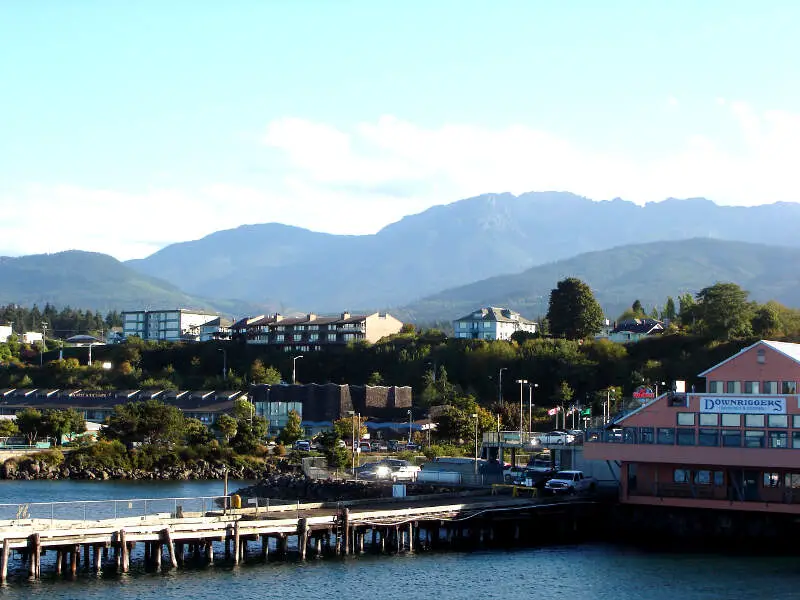
Population: 20,118
# Of Native American Residents: 487
% Native American: 2.42%
More on Port Angeles: Data | Crime | Cost Of Living | Movers

/10
Population: 8,373
# Of Native American Residents: 197
% Native American: 2.35%
More on Stanwood: Data | Crime | Cost Of Living | Movers

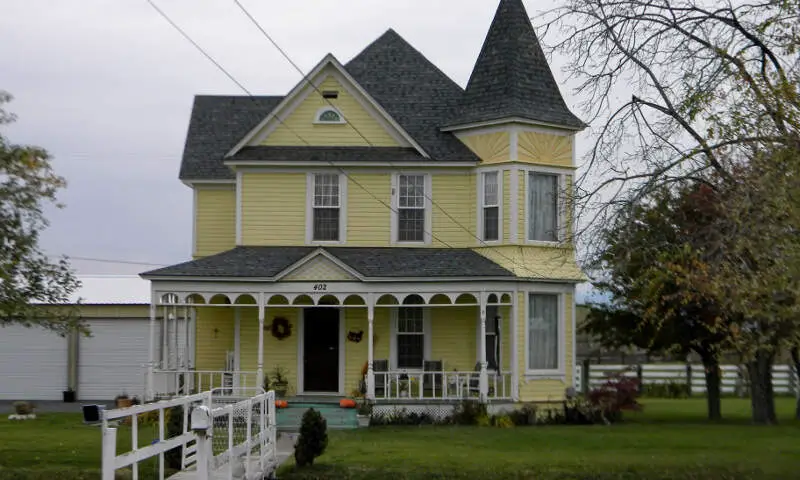
/10
Population: 8,723
# Of Native American Residents: 176
% Native American: 2.02%
More on Toppenish: Data | Crime | Cost Of Living | Movers

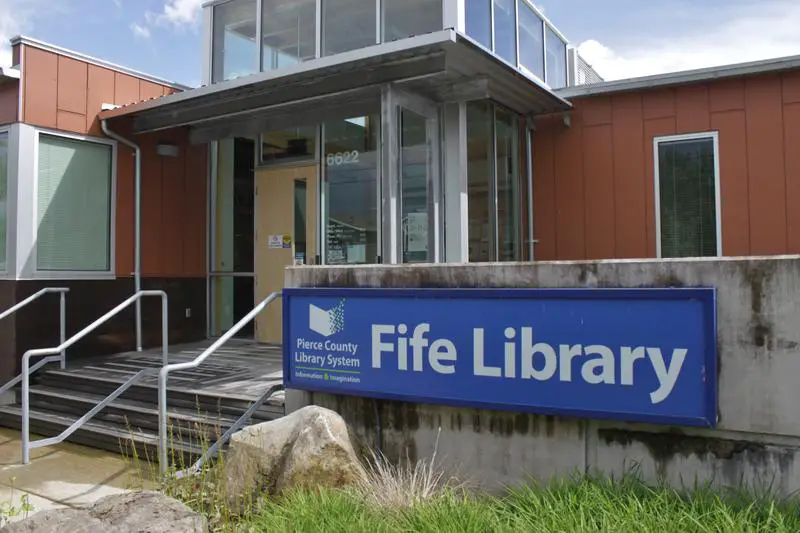
/10
Population: 10,949
# Of Native American Residents: 201
% Native American: 1.84%
More on Fife: Data | Crime | Cost Of Living | Movers

/10
Population: 6,584
# Of Native American Residents: 118
% Native American: 1.79%
More on Union Gap: Data | Crime | Cost Of Living | Movers

/10
Population: 7,953
# Of Native American Residents: 141
% Native American: 1.77%
More on North Bend: Data | Crime | Cost Of Living | Movers
Methodology: How We Determined The Cities In Washington With The Largest Native American Population For 2026
We still believe in the accuracy of data — especially from the Census. So that’s where we went to get the race breakdown across Washington.
We used Saturday Night Science to analyze the Census’s most recently available data, the 2020-2024 American Community Survey data.
Specifically, we looked at table B03002: Hispanic OR LATINO ORIGIN BY RACE. Here are the category names as defined by the Census:
- Hispanic or Latino
- White alone*
- Black or African American alone*
- American Indian and Alaska Native alone*
- Asian alone*
- Native Hawaiian and Other Pacific Islander alone*
- Some other race alone*
- Two or more races*
Our particular column of interest here was the number of people identifying as American Indian and Alaska Native alone.
We limited our analysis to places with a population greater than 6,000 people. That left us with 115 cities.
We then calculated the percentage of residents that are American Indian and Alaska Native. The percentages ranked from 4.12 to 0.00.
Finally, we ranked each city based on the percentage of the American Indian and Alaska Native population, with a higher score being more American Indian and Alaska Native than a lower score. Hoquiam took the distinction of being the most American Indian and Alaska Native, while Othello was the least Native American city.
We updated this article for 2026. This article is our eleventh time ranking the cities in Washington with the largest Native American population.
Summary: Native American Populations Across Washington
If you’re looking for a breakdown of Native American populations across Washington according to the most recent data, this is an accurate list.
The most Native American cities in Washington are Hoquiam, Airway Heights, Ocean Shores, Aberdeen, Port Angeles, Stanwood, Toppenish, Fife, Union Gap, and North Bend.
If you’re curious enough, here are the least Native American places in Washington:
- Othello
- Normandy Park
- Duvall
For more Washington reading, check out:
- Best Places To Raise A Family In Washington
- Best Counties To Live In Washington
- Richest Cities In Washington
Most Native American Places In Washington
| Rank | City | Population | Native American Population | % Native American |
|---|---|---|---|---|
| 1 | Hoquiam | 8,800 | 363 | 4.12% |
| 2 | Airway Heights | 11,245 | 370 | 3.29% |
| 3 | Ocean Shores | 7,302 | 209 | 2.86% |
| 4 | Aberdeen | 17,088 | 489 | 2.86% |
| 5 | Port Angeles | 20,118 | 487 | 2.42% |
| 6 | Stanwood | 8,373 | 197 | 2.35% |
| 7 | Toppenish | 8,723 | 176 | 2.02% |
| 8 | Fife | 10,949 | 201 | 1.84% |
| 9 | Union Gap | 6,584 | 118 | 1.79% |
| 10 | North Bend | 7,953 | 141 | 1.77% |
| 11 | Ferndale | 15,999 | 274 | 1.71% |
| 12 | Clarkston | 7,191 | 119 | 1.65% |
| 13 | Auburn | 85,676 | 1,370 | 1.6% |
| 14 | Cheney | 12,804 | 180 | 1.41% |
| 15 | Brier | 6,545 | 92 | 1.41% |
| 16 | Tukwila | 21,451 | 272 | 1.27% |
| 17 | Yelm | 11,102 | 138 | 1.24% |
| 18 | Woodland | 6,487 | 76 | 1.17% |
| 19 | Shelton | 10,612 | 120 | 1.13% |
| 20 | Bremerton | 44,830 | 404 | 0.9% |
| 21 | Sequim | 8,161 | 72 | 0.88% |
| 22 | Selah | 8,437 | 72 | 0.85% |
| 23 | Longview | 38,069 | 318 | 0.84% |
| 24 | Spokane | 230,293 | 1,899 | 0.82% |
| 25 | Marysville | 73,002 | 587 | 0.8% |
| 26 | Tacoma | 222,758 | 1,789 | 0.8% |
| 27 | Covington | 21,233 | 166 | 0.78% |
| 28 | Orting | 8,978 | 65 | 0.72% |
| 29 | Tumwater | 26,956 | 188 | 0.7% |
| 30 | Centralia | 18,830 | 128 | 0.68% |
| 31 | Anacortes | 17,966 | 121 | 0.67% |
| 32 | Moses Lake | 26,083 | 174 | 0.67% |
| 33 | Monroe | 19,755 | 127 | 0.64% |
| 34 | Yakima | 96,961 | 606 | 0.62% |
| 35 | Sedro-Woolley | 12,831 | 78 | 0.61% |
| 36 | Camas | 27,007 | 156 | 0.58% |
| 37 | Spokane Valley | 106,365 | 613 | 0.58% |
| 38 | University Place | 34,911 | 201 | 0.58% |
| 39 | Edgewood | 13,032 | 72 | 0.55% |
| 40 | Bellingham | 93,438 | 501 | 0.54% |
| 41 | Lacey | 57,737 | 304 | 0.53% |
| 42 | Kennewick | 85,295 | 442 | 0.52% |
| 43 | Olympia | 55,951 | 287 | 0.51% |
| 44 | Fircrest | 7,069 | 36 | 0.51% |
| 45 | Milton | 8,894 | 44 | 0.49% |
| 46 | Vancouver | 195,300 | 916 | 0.47% |
| 47 | Enumclaw | 12,798 | 60 | 0.47% |
| 48 | Wenatchee | 35,484 | 166 | 0.47% |
| 49 | East Wenatchee | 14,199 | 62 | 0.44% |
| 50 | Poulsbo | 12,165 | 51 | 0.42% |
| 51 | Kelso | 12,684 | 52 | 0.41% |
| 52 | Walla Walla | 33,925 | 136 | 0.4% |
| 53 | Federal Way | 99,493 | 392 | 0.39% |
| 54 | Mukilteo | 21,323 | 84 | 0.39% |
| 55 | Mountlake Terrace | 23,104 | 91 | 0.39% |
| 56 | Snohomish | 10,239 | 40 | 0.39% |
| 57 | Oak Harbor | 24,362 | 90 | 0.37% |
| 58 | Sumner | 10,733 | 39 | 0.36% |
| 59 | Edmonds | 42,735 | 153 | 0.36% |
| 60 | Mount Vernon | 35,377 | 122 | 0.34% |
| 61 | Chehalis | 7,587 | 26 | 0.34% |
| 62 | Lakewood | 62,937 | 210 | 0.33% |
| 63 | Lake Forest Park | 13,335 | 44 | 0.33% |
| 64 | Maple Valley | 28,287 | 91 | 0.32% |
| 65 | Sammamish | 66,463 | 212 | 0.32% |
| 66 | Seattle | 754,195 | 2,385 | 0.32% |
| 67 | Sunnyside | 16,277 | 51 | 0.31% |
| 68 | Burlington | 10,003 | 31 | 0.31% |
| 69 | Kent | 135,603 | 417 | 0.31% |
| 70 | Port Townsend | 10,438 | 32 | 0.31% |
| 71 | Everett | 111,845 | 335 | 0.3% |
| 72 | Bainbridge Island | 24,631 | 73 | 0.3% |
| 73 | Port Orchard | 17,149 | 50 | 0.29% |
| 74 | Pacific | 7,066 | 20 | 0.28% |
| 75 | Pullman | 32,229 | 89 | 0.28% |
| 76 | Renton | 105,317 | 287 | 0.27% |
| 77 | Seatac | 32,414 | 88 | 0.27% |
| 78 | Puyallup | 42,746 | 114 | 0.27% |
| 79 | Gig Harbor | 12,424 | 33 | 0.27% |
| 80 | Kirkland | 92,621 | 224 | 0.24% |
| 81 | Liberty Lake | 12,737 | 30 | 0.24% |
| 82 | Ellensburg | 20,874 | 48 | 0.23% |
| 83 | Woodinville | 13,438 | 29 | 0.22% |
| 84 | Bonney Lake | 22,090 | 47 | 0.21% |
| 85 | Burien | 51,513 | 109 | 0.21% |
| 86 | Shoreline | 61,431 | 123 | 0.2% |
| 87 | Quincy | 7,998 | 16 | 0.2% |
| 88 | Arlington | 21,095 | 40 | 0.19% |
| 89 | Ephrata | 8,560 | 16 | 0.19% |
| 90 | Issaquah | 39,591 | 73 | 0.18% |
| 91 | Dupont | 9,931 | 18 | 0.18% |
| 92 | Mill Creek | 20,956 | 35 | 0.17% |
| 93 | Des Moines | 32,823 | 54 | 0.16% |
| 94 | Lake Stevens | 40,253 | 66 | 0.16% |
| 95 | Pasco | 79,575 | 128 | 0.16% |
| 96 | Battle Ground | 21,886 | 33 | 0.15% |
| 97 | Kenmore | 23,741 | 35 | 0.15% |
| 98 | Richland | 62,753 | 89 | 0.14% |
| 99 | Lynden | 16,234 | 23 | 0.14% |
| 100 | Bothell | 49,610 | 56 | 0.11% |


