Are you looking for love in Ohio?
Or are you just hoping to hook up with a hot Ohioan?
Either way, we’ve got you covered here.
If you live in Ohio, there’s a pretty good chance there are a lot of singles in your area. The Buckeye State has plenty of people over 18 who aren’t married or in a serious relationship.
That’s great news for people who are single and looking to mingle.
So, where are the best cities for singles in Ohio? We used Saturday Night Science to find out.
35.5 median age · 23.0% married households
Lakewood is a city in Cuyahoga County, Ohio, United States. It is part of the Greater Cleveland Metropolitan Area, and borders the city of Cleveland. The population was 52,131 at the 2010 United States Census, making it the third largest city in Cuyahoga County, behind Cleveland and Parma.
Data | Crime | Cost of living | Movers
23.5 median age · 16.0% married households
Bowling Green is a city in and the county seat of Wood County, Ohio, United States. The population was 30,028 at the 2010 census. It is part of the Toledo Metropolitan Area and a member of the Toledo Metropolitan Area Council of Governments. Bowling Green is the home of Bowling Green State University.
Data | Crime | Cost of living | Movers
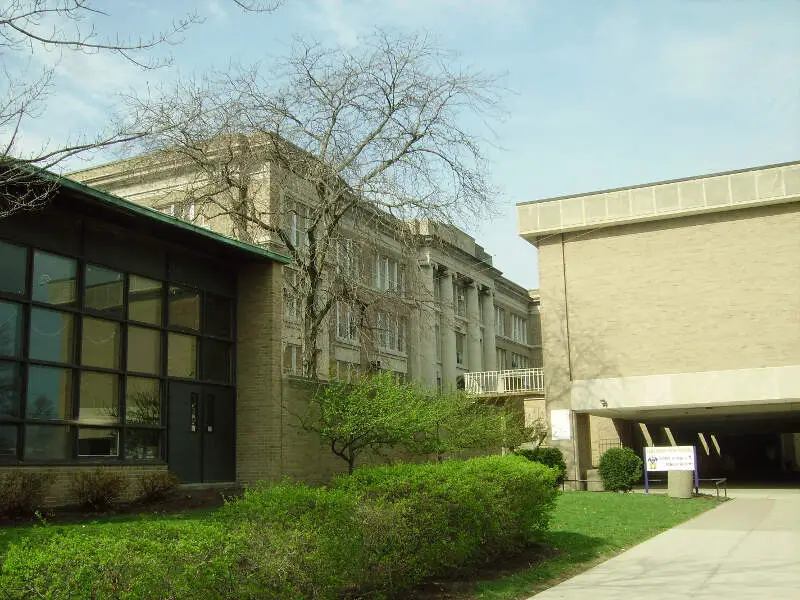
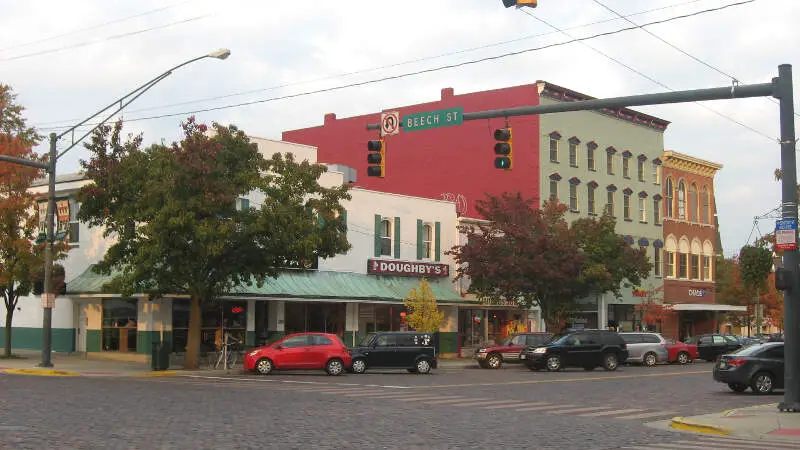
21.6 median age · 9.0% married households
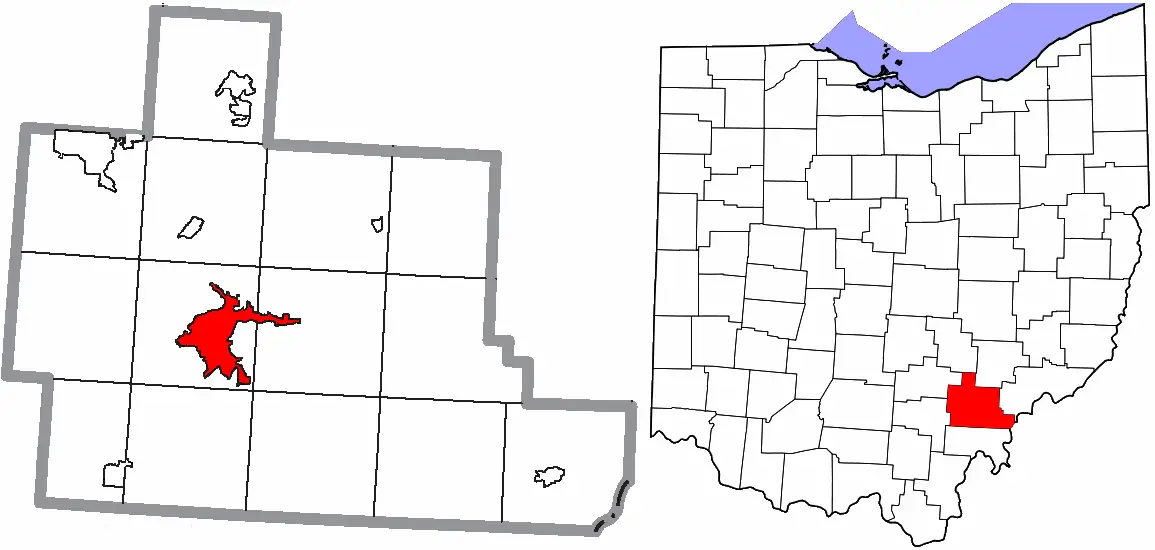
Athens is a city in and the county seat of Athens County, Ohio, United States. It is located along the Hocking River in the southeastern part of Ohio. A historic college town, Athens is home to Ohio University, and is the principal city of the Athens, Ohio Micropolitan Statistical Area. The official population of Athens in the 2010 U.S. Census was 23,832.
Data | Crime | Cost of living | Movers
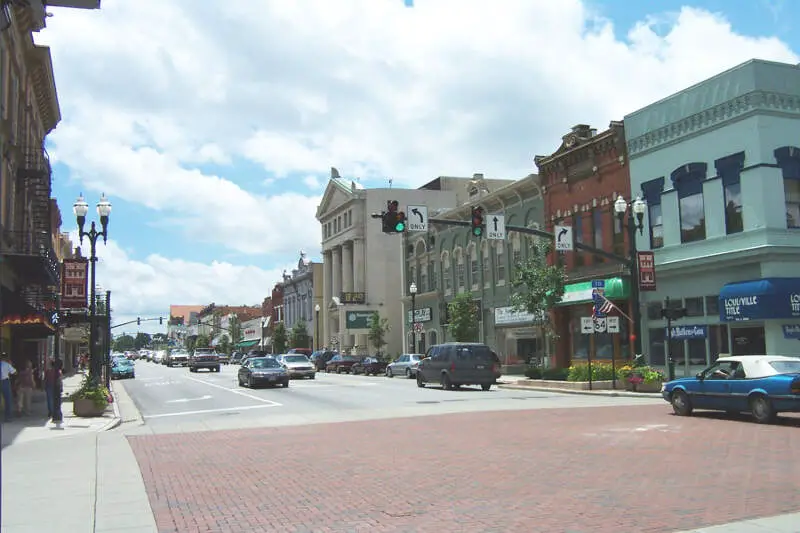
21.1 median age · 6.0% married households
Oxford is a city in northwestern Butler County, Ohio, United States, in the southwestern portion of the state. It lies in Oxford Township, originally called the College Township. The population was 21,371 at the 2010 census. This college town was founded as a home for Miami University. In 2014, Oxford was rated by Forbes as the “Best College Town” in the United States, based on a high percentage of students per capita and part-time jobs, and a low occurrence of brain-drain.
Data | Crime | Cost of living | Movers

33.2 median age · 17.0% married households
Cincinnati is a major city in the U.S. state of Ohio that serves as county seat of Hamilton County. Settled in 1788, the city is located on the north side of the confluence of the Licking with the Ohio River. With a population of 298,800, Cincinnati is the third-largest city in Ohio and the 65th-largest city in the United States. It has the fastest growing economic power of the Midwestern United States and 28th-biggest metropolitan statistical area in the United States, the biggest in Ohio. The city drives the Cincinnati-Middletown-Wilmington combined statistical area, which had a population of 2,172,191 in the 2010 census.
Data | Crime | Cost of living | Movers | Compare

36.3 median age · 14.0% married households
Cleveland is a city in the U.S. state of Ohio and the county seat of Cuyahoga County, the state’s second most-populous county. Located along Lake Erie, the city proper has a population of 388,072, making Cleveland the 51st largest city in the United States, and the second-largest city in Ohio after Columbus. Greater Cleveland ranked as the 32nd-largest metropolitan area in the United States, with 2,055,612 people in 2016. The city anchors the Cleveland-Akron-Canton Combined Statistical Area, which had a population of 3,515,646 in 2010 and ranks 15th in the United States.
Data | Crime | Cost of living | Movers | Compare

35.7 median age · 23.0% married households
Fairborn is a city in Greene County, Ohio, United States, near Dayton and Wright-Patterson Air Force Base. The population was 32,352 at the 2010 census. It is the only city in the world with the name of Fairborn, a portmanteau word created from the names Fairfield and Osborn, the two villages that merged in 1950 after the Great Dayton Flood of 1913 forced Osborn to move out of a flood plain and alongside Fairfield.
Data | Crime | Cost of living | Movers
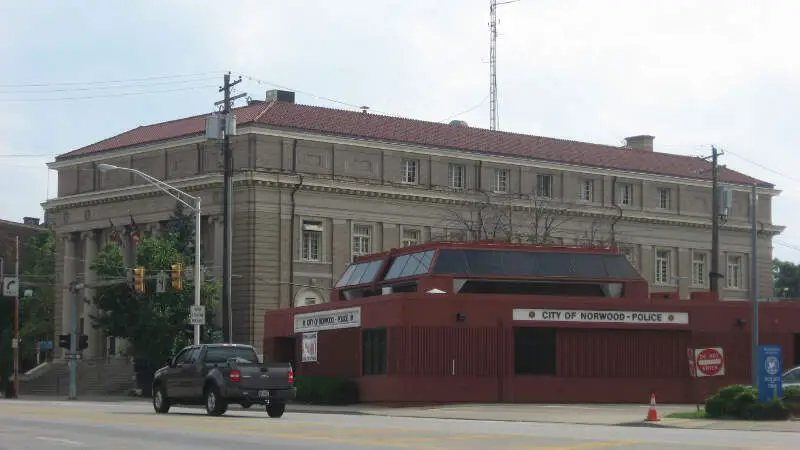
32.8 median age · 24.0% married households
Norwood is the second most populous city in Hamilton County, Ohio, United States, and an enclave of the larger city of Cincinnati. The population was 19,207 at the 2010 census. Originally settled as an early suburb of Cincinnati in the wooded countryside north of the city, the area is characterized by older homes and tree-lined streets.
Data | Crime | Cost of living | Movers
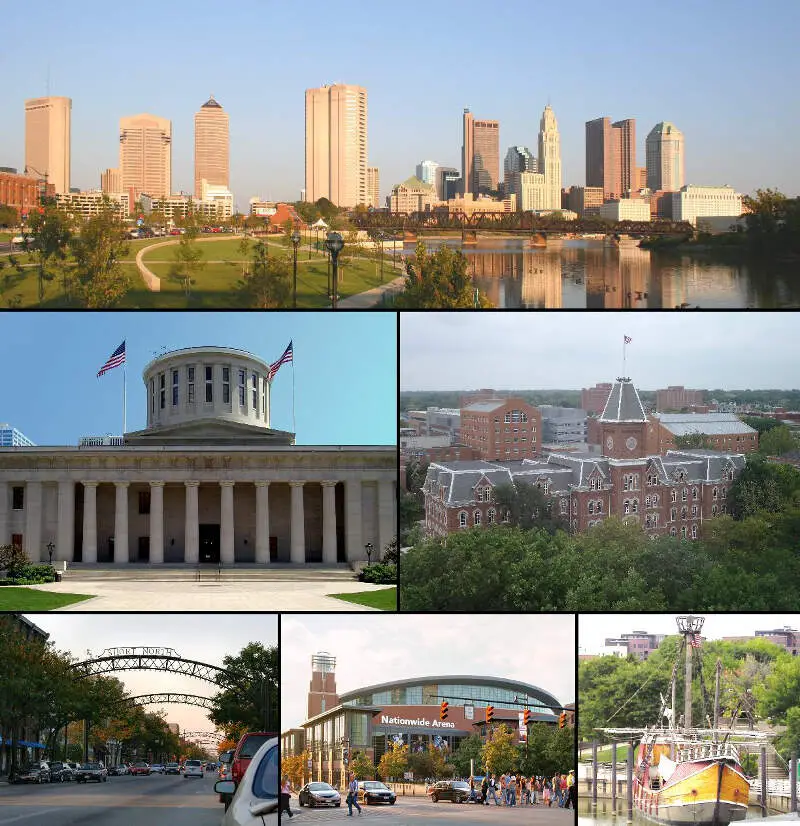
33.2 median age · 18.0% married households
Columbus is the state capital and the most populous city of the U.S. state of Ohio. It is the 14th-most populous city in the United States, with a population of 860,090 as of 2016 estimates. This makes Columbus the 3rd-most populous state capital in the United States after Phoenix, Arizona and Austin, Texas, and the second-most populous city in the Midwestern United States, after Chicago. It is the core city of the Columbus, Ohio, Metropolitan Statistical Area, which encompasses ten counties. With a population of 2,021,632, it is Ohio’s third-largest metropolitan area.
Data | Crime | Cost of living | Movers | Compare

34.1 median age · 15.0% married households
Dayton is the sixth-largest city in the state of Ohio and is the county seat of Montgomery County. A small portion of the city extends into Greene County. In the 2010 census, the population was 141,527, and the Dayton metropolitan area had 799,232 residents, making it Ohio’s fourth-largest metropolitan area, after Cleveland, Cincinnati, and Columbus and the 63rd-largest in the United States. The Dayton-Springfield-Greenville Combined Statistical Area had a population of 1,080,044 in 2010, making it the 43rd-largest in the United States. Dayton is within Ohio’s Miami Valley region, just north of the Cincinnati-Northern Kentucky metropolitan area.
Data | Crime | Cost of living | Movers
The receipts
Compare the top ten
Pick a metric. The bars rescale. The red line is Ohio’s statewide median.
On the map
Where Ohio’s singles cluster
Saturday Night Science
Methodology: How do you determine which city is best for singles in Ohio anyways?
To give you the places in Ohio which are best for singles to find one another, we used Saturday Night Science to look at a handful of metrics. Of course, we want to measure the type of people who live in each city and make some assumptions about what single people like.
So we researched the internet for a database that contains all that information.
We threw a lot of criteria at this one to get the best, most complete results possible. Using the 2020-2024 American Community Survey Census data produced for the state of Ohio, we looked at every single city in the state. We paid particular attention to:
- Population density
- % of population that’s male vs. female (closer to a 50-50 ratio is better)
- % of households with kids
- Median age
- Number of unmarried people in each city
We then gave each city a “Singles Score.”
The higher the score, the better the city is for singles to find one another. We also limited our results to cities with over 10,000 people. For Ohio, that meant a total of 173 cities.
We updated this article for 2026. This is our eleventh time ranking the best cities for singles in Ohio.
Read on to see why Lakewood is the talk of the town while Macedonia is probably a bit on the bland side.
The full plate
Best Cities For Singles In Ohio
Click any column to sort. Search by city name.
| Rank | City | Singles Score | Population | Median Age | % Married Households | % Households w/ Kids |
|---|---|---|---|---|---|---|
| 1 | Lakewood | 18.80 | 50,007 | 35.5 | 23.0% | 15.2% |
| 2 | Bowling Green | 19.10 | 29,983 | 23.5 | 16.0% | 18.1% |
| 3 | Athens | 25.70 | 23,396 | 21.6 | 9.0% | 12.3% |
| 4 | Oxford | 29.20 | 21,753 | 21.1 | 6.0% | 13.1% |
| 5 | Cincinnati | 29.80 | 311,224 | 33.2 | 17.0% | 22.4% |
| 6 | Cleveland | 30.50 | 366,097 | 36.3 | 14.0% | 23.5% |
| 7 | Fairborn | 31.10 | 34,534 | 35.7 | 23.0% | 22.2% |
| 8 | Norwood | 32.70 | 19,114 | 32.8 | 24.0% | 21.4% |
| 9 | Columbus | 33.70 | 914,802 | 33.2 | 18.0% | 26.8% |
| 10 | Dayton | 34.70 | 136,579 | 34.1 | 15.0% | 25.7% |
| 11 | Riverside | 36.30 | 24,435 | 36.0 | 21.0% | 25.7% |
| 12 | Warren | 40.80 | 38,912 | 38.4 | 21.0% | 25.1% |
| 13 | Painesville | 43.20 | 20,548 | 34.5 | 17.0% | 30.3% |
| 14 | Kent | 43.50 | 27,116 | 23.8 | 17.0% | 19.7% |
| 15 | Tiffin | 43.70 | 17,818 | 34.1 | 29.0% | 23.5% |
| 16 | Toledo | 43.90 | 267,463 | 35.8 | 23.0% | 26.2% |
| 17 | Cleveland Heights | 45.40 | 44,497 | 35.9 | 18.0% | 22.3% |
| 18 | Berea | 47.70 | 18,218 | 37.0 | 29.0% | 26.3% |
| 19 | University Heights | 47.70 | 13,394 | 30.5 | 23.0% | 32.1% |
| 20 | Whitehall | 49.70 | 20,019 | 36.2 | 17.0% | 36.9% |
| 21 | South Euclid | 51.00 | 21,534 | 37.3 | 28.0% | 27.1% |
| 22 | West Carrollton | 52.80 | 12,976 | 36.1 | 22.0% | 27.5% |
| 23 | Parma | 54.10 | 79,870 | 42.4 | 28.0% | 22.6% |
| 24 | Akron | 56.30 | 189,247 | 36.9 | 22.0% | 26.4% |
| 25 | Willowick | 57.80 | 14,162 | 42.4 | 36.0% | 19.8% |
| 26 | Steubenville | 58.40 | 18,124 | 35.3 | 19.0% | 25.4% |
| 27 | Hamilton | 58.60 | 63,468 | 34.8 | 24.0% | 30.9% |
| 28 | Lima | 58.60 | 35,010 | 36.8 | 24.0% | 30.1% |
| 29 | Youngstown | 59.70 | 59,331 | 37.5 | 16.0% | 26.2% |
| 30 | Maple Heights | 60.40 | 23,258 | 37.8 | 20.0% | 32.2% |
| 31 | Fremont | 62.10 | 15,835 | 36.8 | 28.0% | 27.6% |
| 32 | Parma Heights | 63.90 | 20,581 | 40.8 | 27.0% | 26.1% |
| 33 | Fairfield | 65.40 | 44,828 | 38.1 | 26.0% | 27.6% |
| 34 | Mayfield Heights | 65.40 | 20,022 | 38.6 | 22.0% | 25.6% |
| 35 | Canton | 65.50 | 69,755 | 35.2 | 22.0% | 30.1% |
| 36 | Ravenna | 65.60 | 11,274 | 37.9 | 31.0% | 24.2% |
| 37 | Euclid | 66.10 | 48,823 | 40.2 | 19.0% | 25.2% |
| 38 | Franklin | 66.20 | 11,712 | 35.2 | 21.0% | 29.6% |
| 39 | Eastlake | 67.50 | 17,493 | 46.9 | 30.0% | 19.7% |
| 40 | Marietta | 68.40 | 13,203 | 39.4 | 20.0% | 23.4% |
| 41 | Springdale | 69.30 | 11,033 | 38.9 | 24.0% | 24.6% |
| 42 | Lorain | 69.70 | 65,395 | 39.8 | 25.0% | 27.9% |
| 43 | East Cleveland | 70.10 | 13,534 | 44.3 | 9.0% | 22.9% |
| 44 | Kettering | 70.60 | 57,206 | 38.5 | 33.0% | 25.2% |
| 45 | Bedford | 70.90 | 12,931 | 42.2 | 25.0% | 21.8% |
| 46 | Forest Park | 71.00 | 20,025 | 36.1 | 18.0% | 30.9% |
| 47 | Warrensville Heights | 71.90 | 13,545 | 37.9 | 14.0% | 28.2% |
| 48 | Dover | 72.20 | 13,053 | 41.7 | 34.0% | 25.2% |
| 49 | Sandusky | 73.50 | 24,606 | 36.5 | 24.0% | 27.8% |
| 50 | Elyria | 73.60 | 53,035 | 39.4 | 29.0% | 26.2% |
| 51 | Alliance | 74.10 | 21,478 | 35.5 | 30.0% | 30.6% |
| 52 | Middletown | 74.40 | 51,617 | 38.6 | 25.0% | 27.7% |
| 53 | Ashtabula | 74.60 | 17,856 | 41.2 | 22.0% | 26.9% |
| 54 | Barberton | 74.80 | 24,844 | 39.5 | 34.0% | 25.0% |
| 55 | Sharonville | 75.10 | 14,030 | 43.5 | 27.0% | 18.3% |
| 56 | Reynoldsburg | 75.40 | 41,224 | 37.2 | 24.0% | 30.7% |
| 57 | Marion | 75.70 | 35,669 | 39.0 | 27.0% | 24.8% |
| 58 | Pickerington | 75.80 | 24,477 | 36.0 | 29.0% | 44.6% |
| 59 | Bexley | 76.00 | 13,114 | 37.5 | 32.0% | 44.0% |
| 60 | Circleville | 76.30 | 14,142 | 35.4 | 33.0% | 27.9% |
| 61 | Bedford Heights | 77.00 | 10,847 | 41.1 | 23.0% | 21.0% |
| 62 | Wickliffe | 77.80 | 12,659 | 41.9 | 36.0% | 27.0% |
| 63 | Zanesville | 79.30 | 24,740 | 36.9 | 23.0% | 28.4% |
| 64 | Cuyahoga Falls | 79.60 | 50,909 | 38.4 | 32.0% | 23.1% |
| 65 | Beavercreek | 79.70 | 47,126 | 40.5 | 27.0% | 29.2% |
| 66 | Washington Court House | 79.80 | 14,439 | 38.1 | 33.0% | 25.8% |
| 67 | Wilmington | 80.20 | 12,620 | 36.3 | 25.0% | 21.2% |
| 68 | Chillicothe | 80.80 | 21,902 | 40.7 | 34.0% | 26.2% |
| 69 | Springfield | 81.30 | 58,190 | 37.9 | 26.0% | 29.8% |
| 70 | Garfield Heights | 82.00 | 29,269 | 38.1 | 25.0% | 30.1% |
| 71 | Salem | 82.10 | 11,758 | 42.0 | 26.0% | 23.0% |
| 72 | Fairview Park | 82.20 | 17,018 | 40.4 | 37.0% | 23.6% |
| 73 | Massillon | 82.70 | 32,338 | 41.0 | 34.0% | 23.5% |
| 74 | Bellefontaine | 83.60 | 13,807 | 35.6 | 30.0% | 31.8% |
| 75 | Newark | 83.90 | 50,783 | 38.8 | 30.0% | 30.0% |
| 76 | Mansfield | 83.90 | 47,663 | 40.0 | 22.0% | 20.5% |
| 77 | Troy | 84.90 | 26,842 | 37.8 | 37.0% | 32.5% |
| 78 | Brooklyn | 84.90 | 11,158 | 47.8 | 26.0% | 21.9% |
| 79 | Defiance | 85.00 | 17,276 | 41.8 | 32.0% | 25.5% |
| 80 | Findlay | 85.10 | 40,287 | 38.0 | 32.0% | 25.8% |
| 81 | Shaker Heights | 86.40 | 28,922 | 41.8 | 24.0% | 29.2% |
| 82 | Piqua | 86.70 | 20,646 | 38.8 | 35.0% | 26.3% |
| 83 | Richmond Heights | 87.40 | 10,626 | 50.6 | 21.0% | 17.6% |
| 84 | Centerville | 87.70 | 25,205 | 46.4 | 29.0% | 21.6% |
| 85 | North Olmsted | 88.10 | 31,924 | 44.5 | 36.0% | 24.6% |
| 86 | Portsmouth | 88.10 | 17,728 | 39.0 | 25.0% | 26.7% |
| 87 | Ironton | 88.10 | 10,768 | 40.9 | 24.0% | 27.5% |
| 88 | Sidney | 88.20 | 20,501 | 40.7 | 34.0% | 26.8% |
| 89 | Blue Ash | 88.30 | 13,455 | 38.8 | 31.0% | 33.0% |
| 90 | Upper Arlington | 88.70 | 36,293 | 40.2 | 38.0% | 35.9% |
| 91 | Niles | 88.70 | 18,287 | 43.2 | 28.0% | 21.0% |
| 92 | London | 89.20 | 10,484 | 41.9 | 36.0% | 23.2% |
| 93 | Lyndhurst | 89.70 | 13,801 | 48.0 | 31.0% | 17.4% |
| 94 | Lancaster | 90.00 | 41,249 | 37.4 | 34.0% | 30.3% |
| 95 | Brook Park | 90.10 | 18,284 | 44.7 | 35.0% | 23.8% |
| 96 | Delaware | 90.50 | 44,589 | 36.9 | 33.0% | 38.6% |
| 97 | Medina | 90.60 | 25,950 | 40.7 | 35.0% | 28.9% |
| 98 | Rocky River | 91.10 | 21,490 | 43.3 | 34.0% | 24.1% |
| 99 | Perrysburg | 91.40 | 25,181 | 38.1 | 36.0% | 31.9% |
| 100 | Fostoria | 91.70 | 12,344 | 39.1 | 32.0% | 28.9% |
Source: U.S. Census ACS 2020-2024. 173 cities with more than 10,000 residents.
Summary
Summary: The Best Cities For Singles In Ohio For 2026
If you’re looking for a breakdown of cities in Ohio ranked by criteria that most agree make a place a great spot for finding a single person (and potentially love), this is an accurate list.
The best cities for singles in Ohio are Lakewood, Bowling Green, Athens, Oxford, Cincinnati, Cleveland, Fairborn, Norwood, Columbus, and Dayton. Not sold on Ohio? Take the two-minute Find Your Place quiz and see which state actually fits you.
Questions and answers
Best Cities For Singles In Ohio FAQs
What is the best city for singles in Ohio?
Lakewood is the best city for singles in Ohio for 2026, according to Saturday Night Science. Bowling Green and Athens are next.
What are the best cities for singles in Ohio?
The best Ohio cities for singles are Lakewood, Bowling Green, Athens, Oxford, Cincinnati, Cleveland, Fairborn, Norwood, Columbus, and Dayton. We ranked all 173 cities with more than 10,000 residents.
How do you rank cities for singles?
Singles-friendliness is measured by population density, gender balance, median age, and the share of unmarried residents, all from Census American Community Survey data. More single people around means better odds.
Why did Lakewood come out on top?
Lakewood posts the best combination of unmarried residents, a dating-friendly age mix, and enough density to actually run into people. That combination beat the other 173 qualifying cities.
What is the toughest place to be single in Ohio?
Macedonia ranks last for singles in Ohio — more married households and fewer chances to mingle. If you are single and settling there anyway, bring hobbies.


