100 Biggest Cities In New Mexico For 2026
Using the latest Census data, we detail the 100 biggest cities in New Mexico. You can all see a comprehensive list of all 140 cities and places in New Mexico.

We all love the biggest cities that the Land of Enchantment has to offer. You know the places like Albuquerque and Las Cruces which make all the headlines.
But there are a bunch of other great large cities in New Mexico that don't get as much love.
We're going to change that right now.
Using the most recent Census data, we can tell you about all the places in New Mexico with a focus on the biggest. We update the data each year and this is our fourth time doing this.
Table Of Contents: Top Ten | Methodology | Table
The Largest Cities In New Mexico For 2026:
You can click here to see a full table of the full of the 100 biggest cities in New Mexico, along with every other place over 1,000 people big. It is sortable by clicking on the headers.
Read on below to see more on the biggest cities. Or for more reading on places to live in New Mexico, check out:
- Best Places To Live In New Mexico
- Cheapest Places To Live In New Mexico
- Most Dangerous Cities In New Mexico
The 10 Biggest Cities In New Mexico

/10
Rank Last Year: 1 (No Change)
Population: 562,218.0
Population 2010: 531,403
Growth: 5.8%
More on Albuquerque: Data | Crime | Cost Of Living | Real Estate

/10
Rank Last Year: 2 (No Change)
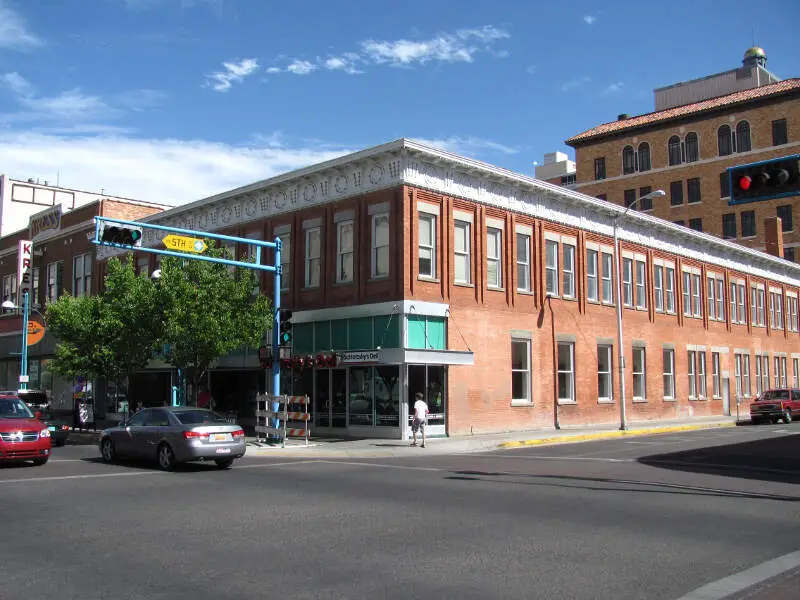
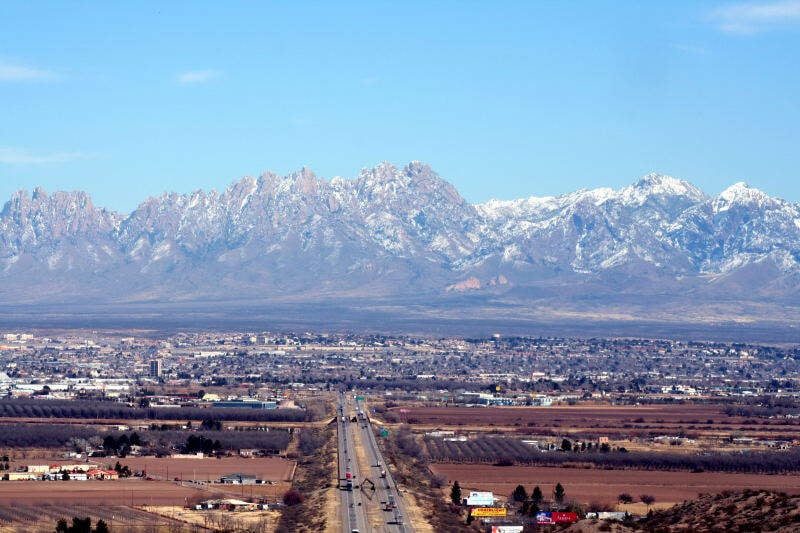
Population: 114,197.0
Population 2010: 92,897
Growth: 22.9%
More on Las Cruces: Data | Crime | Cost Of Living | Real Estate

/10
Rank Last Year: 3 (No Change)
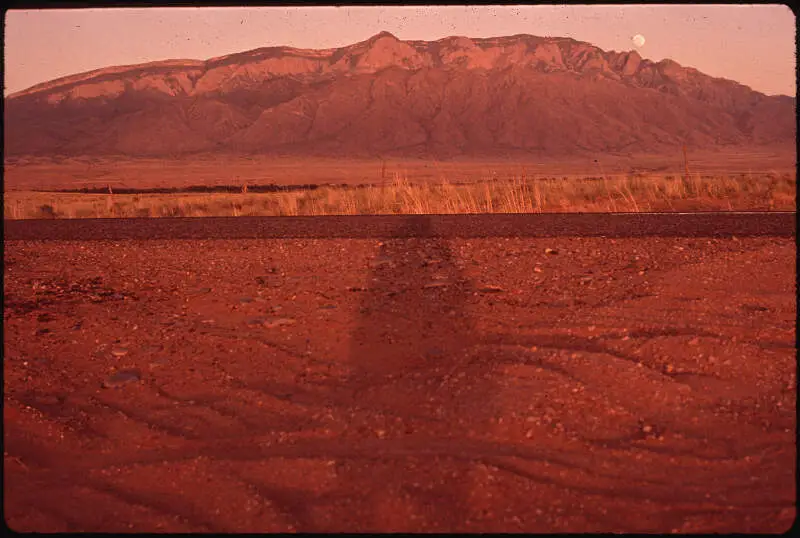
Population: 108,515.0
Population 2010: 81,056
Growth: 33.9%
More on Rio Rancho: Data | Crime | Cost Of Living | Real Estate

/10
Rank Last Year: 4 (No Change)
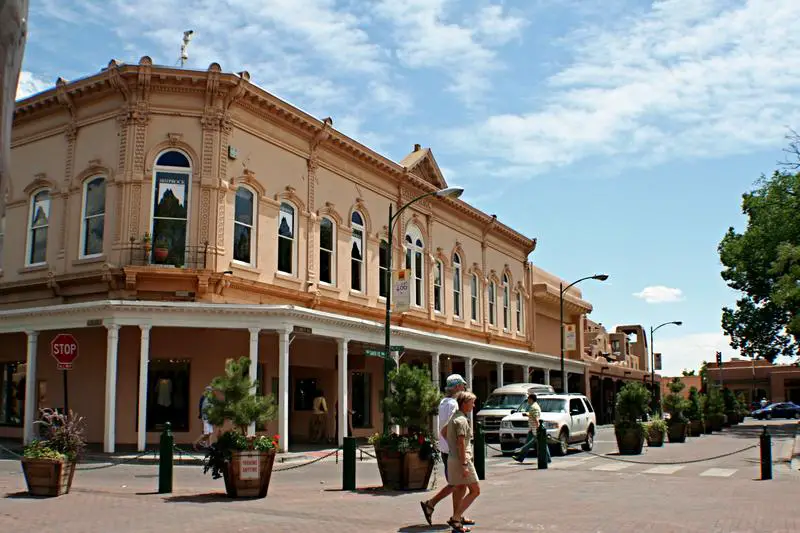
Population: 89,019.0
Population 2010: 67,588
Growth: 31.7%
More on Santa Fe: Data | Cost Of Living | Real Estate

/10
Rank Last Year: 5 (No Change)
Population: 47,638.0
Population 2010: 47,414
Growth: 0.5%
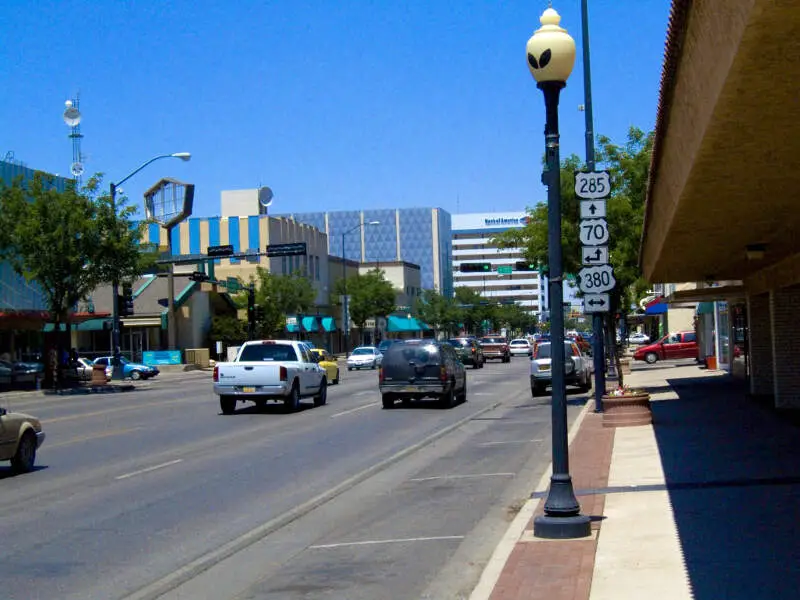
More on Roswell: Data | Crime | Cost Of Living | Real Estate

/10
Rank Last Year: 6 (No Change)
Population: 46,314.0
Population 2010: 44,650
Growth: 3.7%
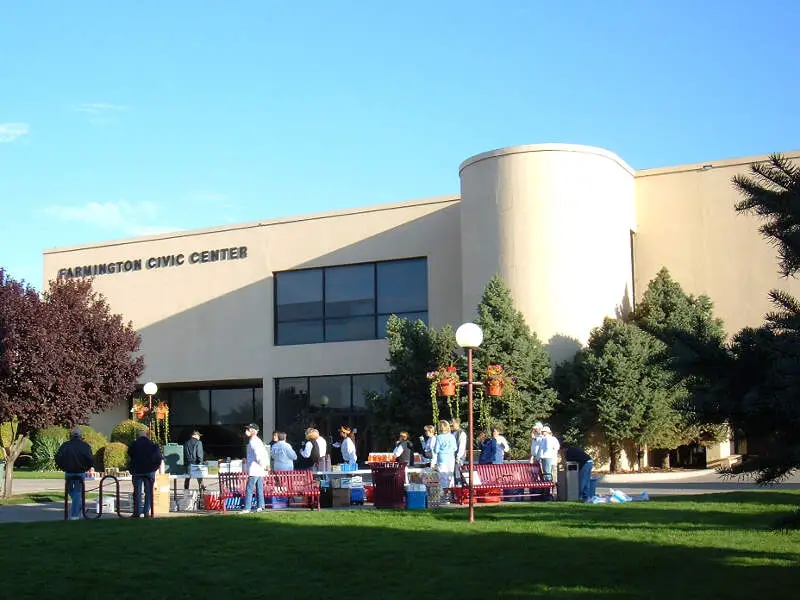
More on Farmington: Data | Crime | Cost Of Living | Real Estate

/10
Rank Last Year: 7 (No Change)
Population: 40,252.0
Population 2010: 32,940
Growth: 22.2%
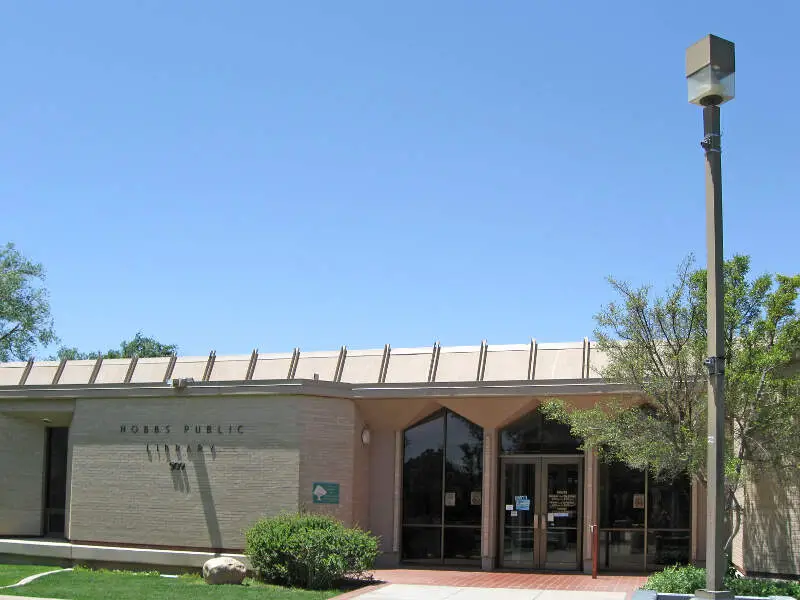
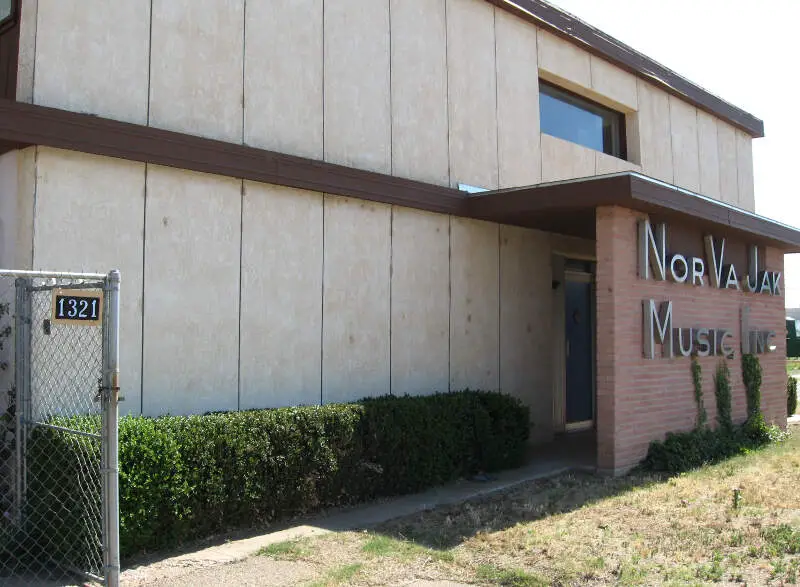
More on Hobbs: Data | Cost Of Living | Real Estate

/10
Rank Last Year: 8 (No Change)
Population: 37,942.0
Population 2010: 36,217
Growth: 4.8%
More on Clovis: Data | Crime | Cost Of Living | Real Estate

/10
Rank Last Year: 9 (No Change)
Population: 37,120.0
Population 2010: 41,992
Growth: -11.6%
More on South Valley: Data | Cost Of Living | Real Estate

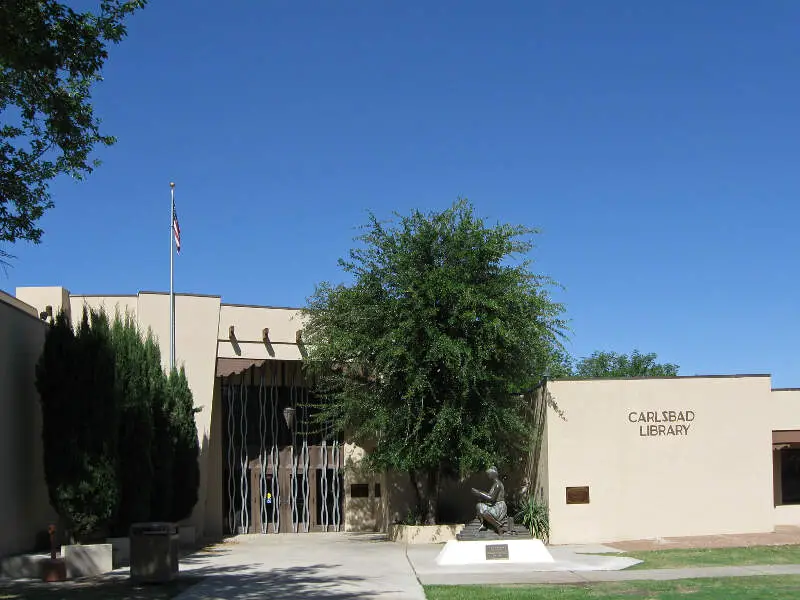
/10
Rank Last Year: 10 (No Change)
Population: 31,746.0
Population 2010: 25,698
Growth: 23.5%
More on Carlsbad: Data | Crime | Cost Of Living | Real Estate
How We Determined The Largest Cities In New Mexico
We've been ranking and dissecting cities in the Land of Enchantment for over 4 years now -- making this actually the fourth time we've run the numbers. We always use the best data, the US Census. In this case, that means we are using the American Community Survey.
It what is probably the most simple analysis we run each year, we ranked every place in New Mexico from biggest to smallest. The biggest city this year? That would be Albuquerque.
The smallest? Rock Springs, although there are places smaller than 1,000 people not listed here, so keep that in mind as we take a look at the top ten.
Now on to numbers 11-100 Biggest in New Mexico
We hope that you find the big city, or really any city, that's right for you. Below is a list of the rest of the biggest cities along with every other place in New Mexico.
Have fun snacking around in the Land of Enchantment!
For more reading on New Mexico, check out:
- Best Places To Raise A Family In New Mexico
- Best Places To Retire In New Mexico
- Richest Cities In New Mexico
- Safest Places In New Mexico
- Worst Places To Live In New Mexico
- Most Expensive Places To Live In New Mexico
Detailed List Of The Biggest Cities In New Mexico
| Rank | City | Current Population | 2010 | Growth | |||||
|---|---|---|---|---|---|---|---|---|---|
| 1 | Albuquerque | 562,218.0 | 531,403 | 5.8% | |||||
| 2 | Las Cruces | 114,197.0 | 92,897 | 22.9% | |||||
| 3 | Rio Rancho | 108,515.0 | 81,056 | 33.9% | |||||
| 4 | Santa Fe | 89,019.0 | 67,588 | 31.7% | |||||
| 5 | Roswell | 47,638.0 | 47,414 | 0.5% | |||||
| 6 | Farmington | 46,314.0 | 44,650 | 3.7% | |||||
| 7 | Hobbs | 40,252.0 | 32,940 | 22.2% | |||||
| 8 | Clovis | 37,942.0 | 36,217 | 4.8% | |||||
| 9 | South Valley | 37,120.0 | 41,992 | -11.6% | |||||
| 10 | Carlsbad | 31,746.0 | 25,698 | 23.5% | |||||
| 11 | Alamogordo | 31,307.0 | 29,753 | 5.2% | |||||
| 12 | Gallup | 21,023.0 | 21,077 | -0.3% | |||||
| 13 | Los Lunas | 18,618.0 | 13,874 | 34.2% | |||||
| 14 | Chaparral | 18,186.0 | 13,540 | 34.3% | |||||
| 15 | Sunland Park | 17,463.0 | 13,832 | 26.3% | |||||
| 16 | Deming | 15,221.0 | 14,877 | 2.3% | |||||
| 17 | Los Alamos | 13,317.0 | 12,030 | 10.7% | |||||
| 18 | Las Vegas | 13,000.0 | 13,845 | -6.1% | |||||
| 19 | Artesia | 12,576.0 | 11,061 | 13.7% | |||||
| 20 | Portales | 11,968.0 | 12,017 | -0.4% | |||||
| 21 | Lovington | 11,498.0 | 10,644 | 8.0% | |||||
| 22 | North Valley | 10,455.0 | 11,705 | -10.7% | |||||
| 23 | Silver City | 9,536.0 | 10,343 | -7.8% | |||||
| 24 | Bernalillo | 9,086.0 | 8,073 | 12.5% | |||||
| 25 | Grants | 8,951.0 | 9,215 | -2.9% | |||||
| 26 | Anthony | 8,767.0 | 0 | nan% | |||||
| 27 | Corrales | 8,555.0 | 8,156 | 4.9% | |||||
| 28 | Socorro | 8,481.0 | 9,059 | -6.4% | |||||
| 29 | Ruidoso | 7,699.0 | 8,154 | -5.6% | |||||
| 30 | Shiprock | 7,610.0 | 9,575 | -20.5% | |||||
| 31 | Belen | 7,450.0 | 7,255 | 2.7% | |||||
| 32 | Bloomfield | 7,395.0 | 7,887 | -6.2% | |||||
| 33 | Taos | 6,458.0 | 5,597 | 15.4% | |||||
| 34 | Aztec | 6,150.0 | 6,778 | -9.3% | |||||
| 35 | Edgewood | 6,124.0 | 3,664 | 67.1% | |||||
| 36 | Santa Teresa | 6,041.0 | 3,960 | 52.6% | |||||
| 37 | North Hobbs | 6,034.0 | 4,981 | 21.1% | |||||
| 38 | Raton | 6,026.0 | 6,965 | -13.5% | |||||
| 39 | Truth Or Consequences | 6,019.0 | 6,490 | -7.3% | |||||
| 40 | Zuni Pueblo | 5,864.0 | 9,527 | -38.4% | |||||
| 41 | Los Ranchos De Albuquerque | 5,857.0 | 5,948 | -1.5% | |||||
| 42 | White Rock | 5,716.0 | 5,908 | -3.2% | |||||
| 43 | Eldorado At Santa Fe | 5,619.0 | 5,810 | -3.3% | |||||
| 44 | El Cerro Mission | 5,323.0 | 3,757 | 41.7% | |||||
| 45 | Tucumcari | 5,160.0 | 5,338 | -3.3% | |||||
| 46 | Los Chaves | 4,838.0 | 4,451 | 8.7% | |||||
| 47 | Paradise Hills | 4,591.0 | 5,159 | -11.0% | |||||
| 48 | Holloman Afb | 4,433.0 | 3,689 | 20.2% | |||||
| 49 | Lee Acres | 4,272.0 | 5,484 | -22.1% | |||||
| 50 | Meadow Lake | 4,259.0 | 5,867 | -27.4% | |||||
| 51 | Bosque Farms | 4,071.0 | 3,901 | 4.4% | |||||
| 52 | La Cienega | 3,543.0 | 3,330 | 6.4% | |||||
| 53 | Peralta | 3,404.0 | 3,615 | -5.8% | |||||
| 54 | Dulce | 3,218.0 | 2,795 | 15.1% | |||||
| 55 | Sandia Heights | 3,160.0 | 3,625 | -12.8% | |||||
| 56 | Eunice | 3,015.0 | 2,839 | 6.2% | |||||
| 57 | El Cerro | 2,923.0 | 3,401 | -14.1% | |||||
| 58 | Agua Fria | 2,898.0 | 3,234 | -10.4% | |||||
| 59 | Vado | 2,895.0 | 2,544 | 13.8% | |||||
| 60 | Crownpoint | 2,882.0 | 2,688 | 7.2% | |||||
| 61 | University Park | 2,782.0 | 3,105 | -10.4% | |||||
| 62 | Flora Vista | 2,770.0 | 2,736 | 1.2% | |||||
| 63 | Clayton | 2,753.0 | 2,693 | 2.2% | |||||
| 64 | La Mesilla | 2,697.0 | 1,941 | 38.9% | |||||
| 65 | Ruidoso Downs | 2,655.0 | 2,813 | -5.6% | |||||
| 66 | Tularosa | 2,597.0 | 2,830 | -8.2% | |||||
| 67 | Ranchos De Taos | 2,536.0 | 2,904 | -12.7% | |||||
| 68 | Questa | 2,466.0 | 2,229 | 10.6% | |||||
| 69 | Santa Rosa | 2,462.0 | 3,001 | -18.0% | |||||
| 70 | Cannon Afb | 2,405.0 | 2,987 | -19.5% | |||||
| 71 | Chimayo | 2,390.0 | 2,766 | -13.6% | |||||
| 72 | Santo Domingo Pueblo | 2,370.0 | 2,309 | 2.6% | |||||
| 73 | Jal | 2,364.0 | 1,838 | 28.6% | |||||
| 74 | Milan | 2,327.0 | 3,068 | -24.2% | |||||
| 75 | Pojoaque | 2,327.0 | 1,925 | 20.9% | |||||
| 76 | West Hammond | 2,236.0 | 2,731 | -18.1% | |||||
| 77 | La Plata | 2,233.0 | 557 | 300.9% | |||||
| 78 | Jemez Pueblo | 2,199.0 | 1,918 | 14.7% | |||||
| 79 | Navajo | 2,181.0 | 2,355 | -7.4% | |||||
| 80 | Jarales | 2,144.0 | 2,073 | 3.4% | |||||
| 81 | San Ysidro | 2,118.0 | 2,212 | -4.2% | |||||
| 82 | Arroyo Seco | 2,112.0 | 1,903 | 11.0% | |||||
| 83 | Moriarty | 2,102.0 | 1,891 | 11.2% | |||||
| 84 | Bayard | 2,057.0 | 2,825 | -27.2% | |||||
| 85 | Lordsburg | 2,057.0 | 3,112 | -33.9% | |||||
| 86 | Nambe | 2,035.0 | 2,118 | -3.9% | |||||
| 87 | Thoreau | 1,973.0 | 957 | 106.2% | |||||
| 88 | Mcintosh | 1,943.0 | 1,522 | 27.7% | |||||
| 89 | Radium Springs | 1,908.0 | 1,590 | 20.0% | |||||
| 90 | Boles Acres | 1,848.0 | 1,840 | 0.4% | |||||
| 91 | Santa Clara | 1,809.0 | 1,416 | 27.8% | |||||
| 92 | La Luz | 1,797.0 | 1,719 | 4.5% | |||||
| 93 | Elephant Butte | 1,790.0 | 1,125 | 59.1% | |||||
| 94 | Tome | 1,723.0 | 1,446 | 19.2% | |||||
| 95 | Mesilla | 1,717.0 | 2,771 | -38.0% | |||||
| 96 | Dixon | 1,623.0 | 1,038 | 56.4% | |||||
| 97 | White Sands | 1,609.0 | 1,232 | 30.6% | |||||
| 98 | Las Maravillas | 1,594.0 | 1,793 | -11.1% | |||||
| 99 | Hatch | 1,588.0 | 1,000 | 58.8% | |||||
| 100 | La Villita | 1,534.0 | 1,718 | -10.7% | |||||
| 101 | Cuartelez | 1,512.0 | 480 | 215.0% | |||||
| 102 | Algodones | 1,479.0 | 845 | 75.0% | |||||
| 103 | Upper Fruitland | 1,457.0 | 1,604 | -9.2% | |||||
| 104 | Berino | 1,454.0 | 1,348 | 7.9% | |||||
| 105 | El Rancho | 1,451.0 | 1,296 | 12.0% | |||||
| 106 | Sandia Knolls | 1,445.0 | 1,712 | -15.6% | |||||
| 107 | Ponderosa Pine | 1,442.0 | 998 | 44.5% | |||||
| 108 | Estancia | 1,432.0 | 2,226 | -35.7% | |||||
| 109 | Church Rock | 1,381.0 | 569 | 142.7% | |||||
| 110 | Keeler Farm | 1,376.0 | 1,488 | -7.5% | |||||
| 111 | Loving | 1,357.0 | 1,114 | 21.8% | |||||
| 112 | Atoka | 1,347.0 | 870 | 54.8% | |||||
| 113 | Paraje | 1,333.0 | 884 | 50.8% | |||||
| 114 | High Rolls | 1,313.0 | 690 | 90.3% | |||||
| 115 | El Valle De Arroyo Seco | 1,293.0 | 1,367 | -5.4% | |||||
| 116 | La Huerta | 1,288.0 | 1,518 | -15.2% | |||||
| 117 | Spencerville | 1,264.0 | 1,533 | -17.5% | |||||
| 118 | Arenas Valley | 1,247.0 | 1,606 | -22.4% | |||||
| 119 | Skyline-Ganipa | 1,226.0 | 1,124 | 9.1% | |||||
| 120 | Pecos | 1,204.0 | 1,629 | -26.1% | |||||
| 121 | Columbus | 1,196.0 | 1,285 | -6.9% | |||||
| 122 | Ohkay Owingeh | 1,194.0 | 978 | 22.1% | |||||
| 123 | Capitan | 1,191.0 | 1,744 | -31.7% | |||||
| 124 | Mountainair | 1,178.0 | 788 | 49.5% | |||||
| 125 | Waterflow | 1,140.0 | 1,234 | -7.6% | |||||
| 126 | Los Luceros | 1,136.0 | 490 | 131.8% | |||||
| 127 | Taos Pueblo | 1,129.0 | 1,479 | -23.7% | |||||
| 128 | Dexter | 1,128.0 | 1,297 | -13.0% | |||||
| 129 | Black Rock | 1,125.0 | 955 | 17.8% | |||||
| 130 | San Felipe Pueblo | 1,119.0 | 2,165 | -48.3% | |||||
| 131 | Angel Fire | 1,111.0 | 741 | 49.9% | |||||
| 132 | El Rito | 1,102.0 | 741 | 48.7% | |||||
| 133 | Tesuque | 1,079.0 | 825 | 30.8% | |||||
| 134 | La Union | 1,071.0 | 1,111 | -3.6% | |||||
| 135 | Hurley | 1,044.0 | 1,626 | -35.8% | |||||
| 136 | San Rafael | 1,039.0 | 395 | 163.0% | |||||
| 137 | Polvadera | 1,033.0 | 483 | 113.9% | |||||
| 138 | Santa Ana Pueblo | 1,026.0 | 843 | 21.7% | |||||
| 139 | Springer | 1,017.0 | 1,170 | -13.1% | |||||
| 140 | Rock Springs | 1,013.0 | 655 | 54.7% | |||||