Most Asian cities in Indiana research summary. We analyzed Indiana’s most recent Census data to determine the most Asian cities in Indiana based on the percentage of Asian residents.

21.9% Asian · #1 most Asian in Indiana
West Lafayette is a city in Wabash Township, Tippecanoe County, Indiana, United States, about 65 miles northwest of the state capital of Indianapolis and 103 miles southeast of Chicago. West Lafayette is directly across the Wabash River from its sister city, Lafayette. As of the 2016 census estimate, its population was 45,872. It is the most densely populated city in Indiana and is home to Purdue University.
Data | Crime | Cost of living | Movers
11.6% Asian · #2 most Asian in Indiana
Carmel is a suburban city in Hamilton County, Indiana, United States, located immediately north of Indianapolis. It has been one of the fastest-growing communities in the country. In 2012, Carmel was selected as the “Best Place to Live in the United States” by CNN Money magazine, and received the same designation by Niche.com in 2017. The population was 79,191 as of the 2010 and was estimated to be 91,065 in 2016 by the US Census Bureau, making it the fifth-largest city in Indiana.
Data | Crime | Cost of living | Movers
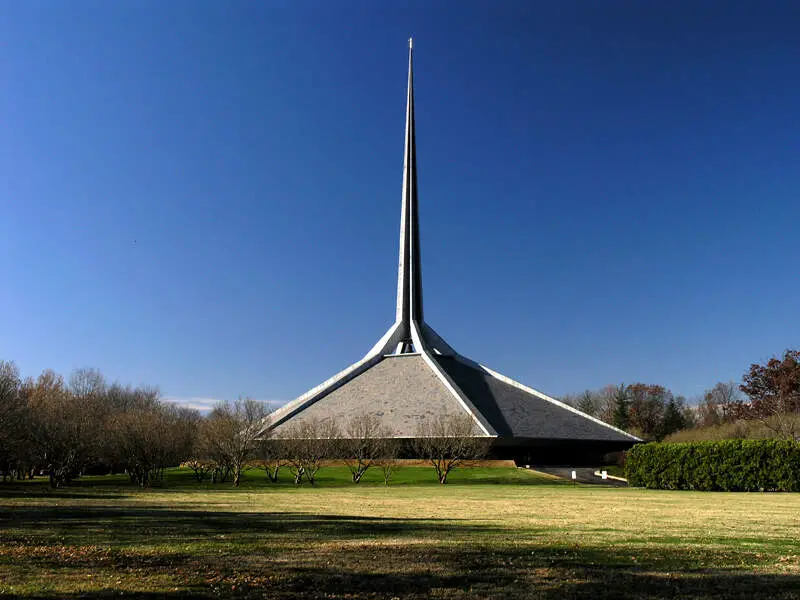
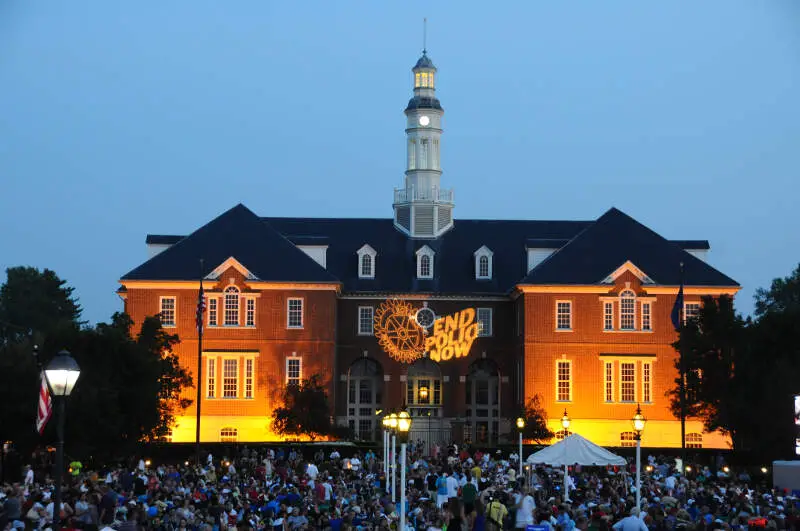
11.5% Asian · #3 most Asian in Indiana
Columbus is a city in and the county seat of Bartholomew County, Indiana, United States. The population was 44,061 at the 2010 census. In its built environment, the relatively small city has provided a unique place for noted Modern architecture and public art, commissioning numerous works since the mid-20th century. Located about 40 miles south of Indianapolis, on the east fork of the White River, it is the state’s 20th-largest city. It is the principal city of the Columbus, Indiana metropolitan statistical area, which encompasses all of Bartholomew County. Columbus is the birthplace of former Indiana Governor and current Vice President of the United States, Mike Pence.
Data | Crime | Cost of living | Movers
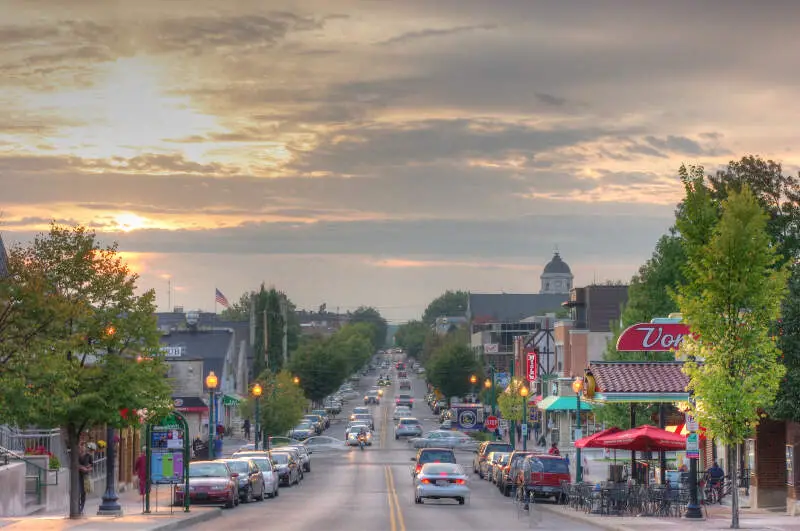
10.7% Asian · #4 most Asian in Indiana
Bloomington is a city in and the county seat of Monroe County in the southern region of the U.S. state of Indiana. It is the seventh-largest city in Indiana and the fourth-largest outside the Indianapolis metropolitan area. According to the Monroe County History Center, Bloomington is known as the “Gateway to Scenic Southern Indiana.” The city was established in 1818 by a group of settlers from Kentucky, Tennessee, the Carolinas, and Virginia who were so impressed with “a haven of blooms” that they called it Bloomington.
Data | Crime | Cost of living | Movers
9.0% Asian · #5 most Asian in Indiana
Greenwood is a city in Johnson County, Indiana, United States. The population was 49,791 at the 2010 Census, and increased to 56,545 in the Census 2016 estimates. Greenwood is located between Indiana State Road 37 and Interstate 65. The city shares a border with Indianapolis and is the most populous suburb in the southern portion of the Indianapolis Metropolitan Area. The current Mayor of Greenwood is Nicolas A. Dietz.
Data | Crime | Cost of living | Movers
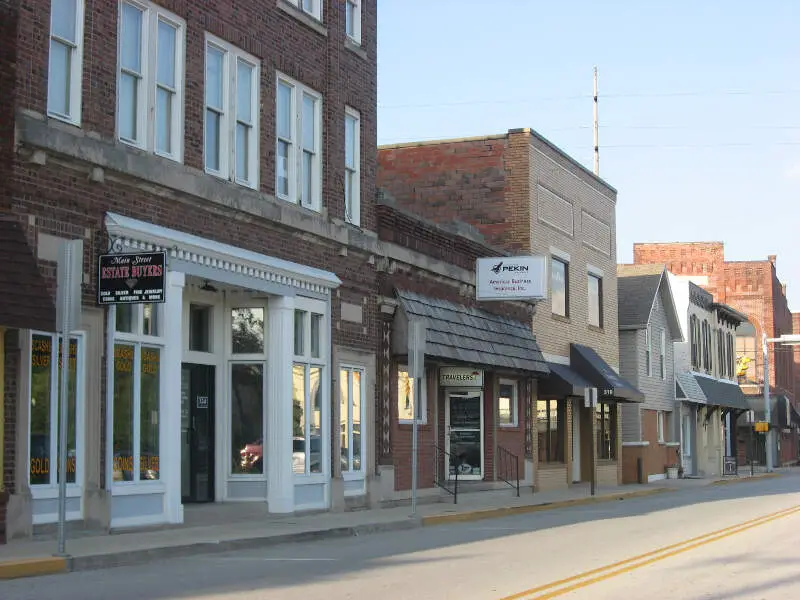
6.6% Asian · #6 most Asian in Indiana
Plainfield is a town in Guilford, Liberty, and Washington townships, Hendricks County, Indiana, United States. The population was 27,631 at the 2010 census, and in 2016 the estimated population was 31,409.
Data | Crime | Cost of living | Movers

6.3% Asian · #7 most Asian in Indiana
Munster is a town located in North Township, Lake County, in Northwest Indiana, United States. This bedroom community lies in the Chicago metropolitan area, approximately 30 miles southeast of the Chicago Loop, and shares municipal boundaries with Hammond to the north, Highland to the east, Dyer and Schererville to the south and Lansing and Lynwood directly west of the Illinois border. The 2010 U.S. Census counted the town’s population at 23,603.
Data | Crime | Cost of living | Movers
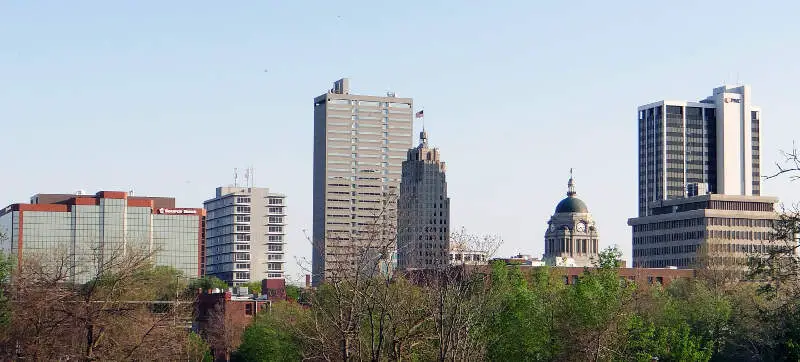
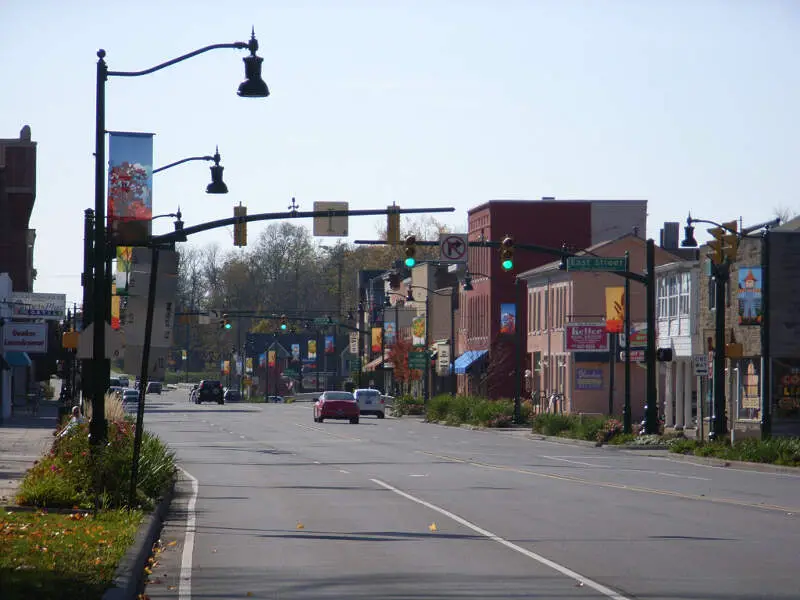
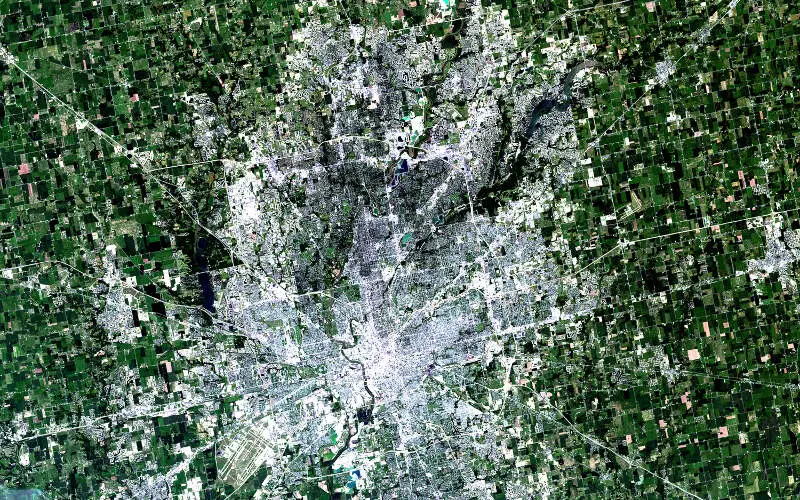
6.1% Asian · #8 most Asian in Indiana
Coordinates: 410449.62N 850820.94W 41.0804500; -85.1391500
Data | Crime | Cost of living | Movers | Compare
4.6% Asian · #9 most Asian in Indiana
Avon is a town in Washington Township, Hendricks County, Indiana, United States. The population was 12,446 at the 2010 census, and in 2016 the estimated population was 16,960.
Data | Crime | Cost of living | Movers
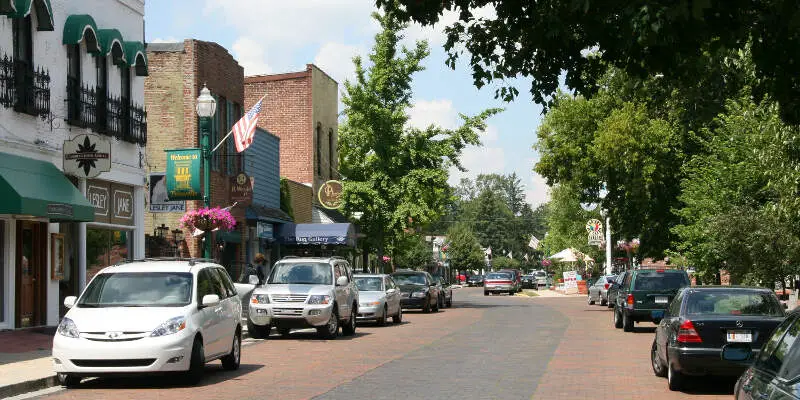
4.3% Asian · #10 most Asian in Indiana
Zionsville is a suburban town located in the extreme southeast area of Boone County, Indiana, United States, northwest of Indianapolis. The population was 14,160 at the 2010 census, and grew to 26,784 in the Census 2016 estimates.
Data | Crime | Cost of living | Movers
The receipts
Compare the top ten
Pick a metric. The bars rescale. The red line is Indiana’s statewide median.
On the map
Where Indiana’s Asian communities live
Saturday Night Science
Methodology: How We Determined The Cities In Indiana With The Largest Asian Population For 2026
We used Saturday Night Science to compare Census data on race across every place in Indiana.
The Census’s most recently available data comes from the 2020-2024 American Community Survey.
Specifically, we looked at table B03002: Hispanic OR LATINO ORIGIN BY RACE. Here are the category names as defined by the Census:
- Hispanic or Latino
- White alone*
- Black or African American alone*
- American Indian and Alaska Native alone*
- Asian alone*
- Native Hawaiian and Other Pacific Islander alone*
- Some other race alone*
- Two or more races*
Our particular column of interest here was the number of people who identified as Asian alone.
We limited our analysis to cities with a population greater than 5,000 people. That left us with 112 cities.
We then calculated the percentage of residents that are Asian. The percentages ranked from 21.9% to 0.0%.
Finally, we ranked each city based on the percentage of Asian population, with a higher percentage being more Asian. West Lafayette took the distinction of being the most Asian, while Alexandria was the least Asian city.
We updated this article for 2026. This report reflects our eleventh time ranking the cities in Indiana with the largest Asian population.
The full plate
Cities In Indiana By Asian Population
Click any column to sort. Search by city name.
| Rank | City | Population | Asian Population | % Asian |
|---|---|---|---|---|
| 1 | West Lafayette | 45,159 | 9,873 | 21.9% |
| 2 | Carmel | 101,651 | 11,807 | 11.6% |
| 3 | Columbus | 51,824 | 5,956 | 11.5% |
| 4 | Bloomington | 80,049 | 8,592 | 10.7% |
| 5 | Greenwood | 66,029 | 5,947 | 9.0% |
| 6 | Plainfield | 36,369 | 2,407 | 6.6% |
| 7 | Munster | 23,733 | 1,491 | 6.3% |
| 8 | Fort Wayne | 268,589 | 16,331 | 6.1% |
| 9 | Avon | 23,437 | 1,079 | 4.6% |
| 10 | Zionsville | 32,095 | 1,372 | 4.3% |
| 11 | Indianapolis | 885,860 | 36,861 | 4.2% |
| 12 | Seymour | 22,371 | 913 | 4.1% |
| 13 | Warsaw | 16,768 | 682 | 4.1% |
| 14 | Noblesville | 73,362 | 2,570 | 3.5% |
| 15 | Dyer | 16,400 | 508 | 3.1% |
| 16 | Yor | 11,699 | 359 | 3.1% |
| 17 | Speedway | 13,968 | 385 | 2.8% |
| 18 | Greencastle | 9,864 | 259 | 2.6% |
| 19 | Lafayette | 71,159 | 1,768 | 2.5% |
| 20 | Mishawaka | 51,021 | 1,240 | 2.4% |
| 21 | Valparaiso | 34,733 | 842 | 2.4% |
| 22 | South Bend | 103,085 | 2,364 | 2.3% |
| 23 | Crown Point | 34,393 | 748 | 2.2% |
| 24 | Schererville | 29,701 | 630 | 2.1% |
| 25 | Muncie | 64,751 | 1,348 | 2.1% |
| 26 | Terre Haute | 58,427 | 1,216 | 2.1% |
| 27 | St. John | 22,567 | 459 | 2.0% |
| 28 | Lawrence | 49,517 | 993 | 2.0% |
| 29 | Griffith | 16,273 | 321 | 2.0% |
| 30 | Kokomo | 59,122 | 1,153 | 2.0% |
| 31 | New Haven | 15,698 | 305 | 1.9% |
| 32 | Chesterton | 14,446 | 272 | 1.9% |
| 33 | Jeffersonville | 51,043 | 957 | 1.9% |
| 34 | Shelbyville | 20,296 | 375 | 1.8% |
| 35 | Highland | 23,680 | 434 | 1.8% |
| 36 | Nappanee | 6,815 | 120 | 1.8% |
| 37 | Kendallville | 10,556 | 183 | 1.7% |
| 38 | Greenfield | 24,940 | 427 | 1.7% |
| 39 | Sellersburg | 10,137 | 157 | 1.5% |
| 40 | Richmond | 35,581 | 539 | 1.5% |
| 41 | Hammond | 76,768 | 1,154 | 1.5% |
| 42 | Huntingburg | 6,396 | 95 | 1.5% |
| 43 | Franklin | 26,168 | 384 | 1.5% |
| 44 | Lake Station | 13,185 | 184 | 1.4% |
| 45 | North Vernon | 7,078 | 92 | 1.3% |
| 46 | New Albany | 37,581 | 487 | 1.3% |
| 47 | Madison | 12,223 | 156 | 1.3% |
| 48 | Beech Grove | 14,913 | 188 | 1.3% |
| 49 | Portage | 38,082 | 474 | 1.2% |
| 50 | Garrett | 6,642 | 82 | 1.2% |
| 51 | Logansport | 17,790 | 205 | 1.2% |
| 52 | Marion | 27,531 | 315 | 1.1% |
| 53 | Brownsburg | 31,215 | 355 | 1.1% |
| 54 | Huntington | 17,030 | 192 | 1.1% |
| 55 | Goshen | 34,420 | 386 | 1.1% |
| 56 | Hobart | 29,558 | 329 | 1.1% |
| 57 | Danville | 11,714 | 124 | 1.1% |
| 58 | Evansville | 116,116 | 1,211 | 1.0% |
| 59 | Merrillville | 36,476 | 365 | 1.0% |
| 60 | Cedar Lake | 15,295 | 153 | 1.0% |
| 61 | Princeton | 8,372 | 77 | 0.9% |
| 62 | Vincennes | 16,586 | 152 | 0.9% |
| 63 | Angola | 9,408 | 86 | 0.9% |
| 64 | Brazil | 7,831 | 65 | 0.8% |
| 65 | Clarksville | 22,016 | 180 | 0.8% |
| 66 | Martinsville | 11,933 | 90 | 0.8% |
| 67 | Plymouth | 10,664 | 78 | 0.7% |
| 68 | Jasper | 15,991 | 112 | 0.7% |
| 69 | Charlestown | 8,294 | 56 | 0.7% |
| 70 | Michigan City | 31,814 | 214 | 0.7% |
| 71 | New Castle | 17,367 | 116 | 0.7% |
| 72 | La Porte | 22,449 | 149 | 0.7% |
| 73 | Anderson | 55,367 | 354 | 0.6% |
| 74 | Linton | 5,260 | 33 | 0.6% |
| 75 | Crawfordsville | 16,491 | 103 | 0.6% |
| 76 | Washington | 12,367 | 68 | 0.5% |
| 77 | Elkhart | 53,733 | 280 | 0.5% |
| 78 | Wabash | 10,358 | 49 | 0.5% |
| 79 | Rensselaer | 5,573 | 26 | 0.5% |
| 80 | Ellettsville | 6,698 | 30 | 0.4% |
| 81 | Frankfort | 15,917 | 71 | 0.4% |
| 82 | Tell City | 7,505 | 33 | 0.4% |
| 83 | Boonville | 6,702 | 29 | 0.4% |
| 84 | Batesville | 7,282 | 30 | 0.4% |
| 85 | Gary | 68,113 | 240 | 0.4% |
| 86 | Cumberland | 6,267 | 22 | 0.4% |
| 87 | Gas City | 6,076 | 19 | 0.3% |
| 88 | Mount Vernon | 6,400 | 19 | 0.3% |
| 89 | Mooresville | 9,751 | 28 | 0.3% |
| 90 | Elwood | 8,356 | 22 | 0.3% |
| 91 | Westville | 5,279 | 13 | 0.2% |
| 92 | Bluffton | 10,529 | 20 | 0.2% |
| 93 | Lebanon | 17,812 | 33 | 0.2% |
| 94 | Columbia City | 9,897 | 18 | 0.2% |
| 95 | Bedford | 13,837 | 22 | 0.2% |
| 96 | Rochester | 6,215 | 9 | 0.1% |
| 97 | Peru | 10,901 | 12 | 0.1% |
| 98 | Auburn | 13,565 | 12 | 0.1% |
| 99 | Decatur | 9,811 | 2 | 0.0% |
| 100 | Greensburg | 12,229 | 1 | 0.0% |
Source: U.S. Census ACS 2020-2024. 112 cities with more than 5,000 residents.
Summary
Summary: Asian Populations Across Indiana
If you’re looking for a breakdown of Asian populations across Indiana according to the most recent data, this is an accurate list.
The most Asian cities in Indiana are West Lafayette, Carmel, Columbus, Bloomington, Greenwood, Plainfield, Munster, Fort Wayne, Avon, and Zionsville. Not sold on Indiana? Take the two-minute Find Your Place quiz and see which state actually fits you.
Questions and answers
Most Asian Cities In Indiana FAQs
What is the most Asian city in Indiana?
West Lafayette is the most Asian city in Indiana for 2026, at 21.9% of residents. Carmel and Columbus are next.
What cities in Indiana have the largest Asian population?
The Indiana cities with the largest Asian population shares are West Lafayette, Carmel, Columbus, Bloomington, Greenwood, Plainfield, Munster, Fort Wayne, Avon, and Zionsville. We ranked all 112 places with more than 5,000 residents.
What percent of West Lafayette is Asian?
Asian residents make up 21.9% of West Lafayette, the highest share of the 112 Indiana places we measured. The numbers come from the Census Bureau’s American Community Survey.
What is the least Asian city in Indiana?
Alexandria is the least Asian city in Indiana, at 0.0%. It sits at the opposite end of the same ranking.
Where does this data come from?
Every share is calculated from the Census Bureau’s American Community Survey (2020-2024), based on residents identifying as Asian alone. We rank each Indiana place with more than 5,000 residents.


