Most Native American places in Indiana research summary. We used Saturday Night Science to research the Indiana cities with the highest percentage of Native American residents for 2026. The data comes from the American Community Survey 2020-2024 vintage, which breaks down race by origin.
The city with the highest percentage of Native Americans is Gas City. 0.86% of people in Gas City are Native Americans.
The city with the lowest percentage of Native Americans is Zionsville. 0.00% of people in Zionsville are Native American.
The city with the most Native Americans is Indianapolis. 467 people in Indianapolis are Native American.
The city with the fewest Native Americans is Zionsville. 0 people in Zionsville are Native American.
The United States has 1,698,432 Native Americans and is 0.51% Native American.
Which city in Indiana had the largest Native American population? The place with the largest Native American population in Indiana for 2026 is Gas City. 0.86% of Gas City identify as Native American.
0.9% Native American · 52 Native American residents
Gas City is a city in Grant County, Indiana, along the Mississinewa River. The population was 5,965 at the 2010 census.
Data | Crime | Cost of living | Movers
0.4% Native American · 134 Native American residents
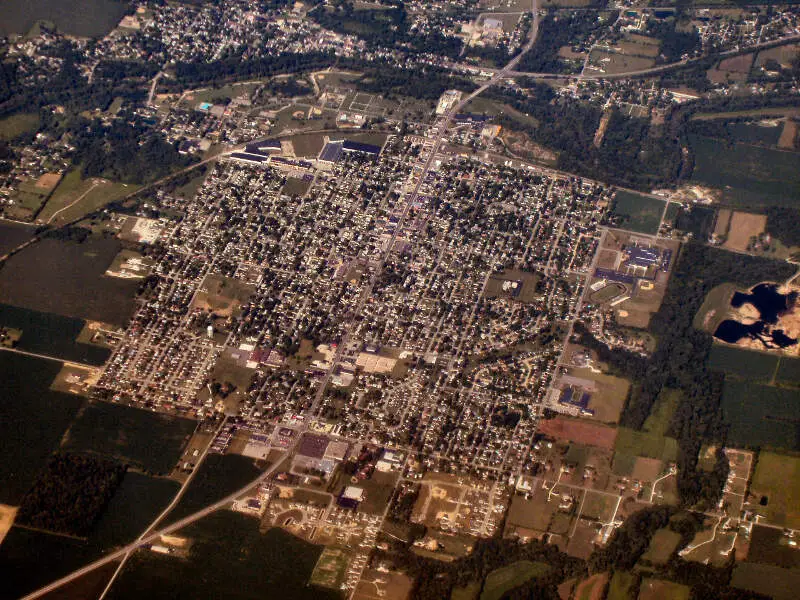
Goshen is a city in and the county seat of Elkhart County, Indiana, United States. It is the smaller of the two principal cities of the Elkhart-Goshen Metropolitan Statistical Area, which in turn is part of the South Bend-Elkhart-Mishawaka Combined Statistical Area. It is located in the northern part of Indiana near the Michigan border, in a region known as Michiana. Goshen is located 10 miles southeast of Elkhart, 25 miles southeast of South Bend, 120 miles east of Chicago, and 150 miles north of Indianapolis. The population was 31,719 at the 2010 census. The city is known as a center of manufacturing for recreational vehicles and accessories, the home of Goshen College, a small Mennonite liberal arts college, and home to the Elkhart County 4-H Fair, one of the largest county fairs in the United States.
Data | Crime | Cost of living | Movers
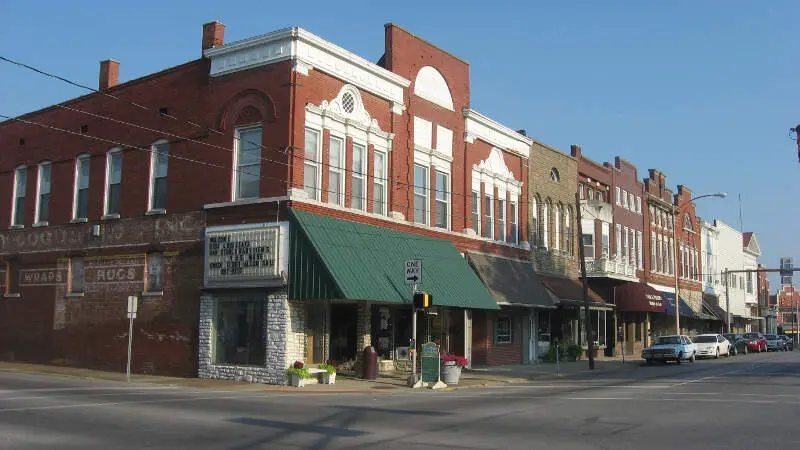
0.3% Native American · 20 Native American residents
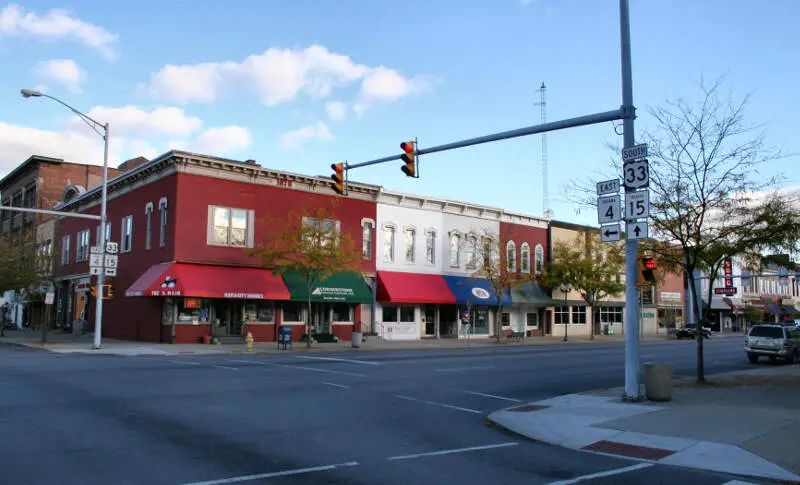
Mount Vernon is a city in and the county seat of Posey County, Indiana, United States. Located in the state’s far southwestern corner, within 15 miles of either the southernmost or westernmost points it is the westernmost city in the state, but not the southernmost, that being Rockport, about 40 miles to the southeast. The population was 6,687 at the 2010 census. It is located in Black Township and is part of the Evansville, Indiana, metropolitan area, which had a 2010 population of 358,676.
Data | Crime | Cost of living | Movers
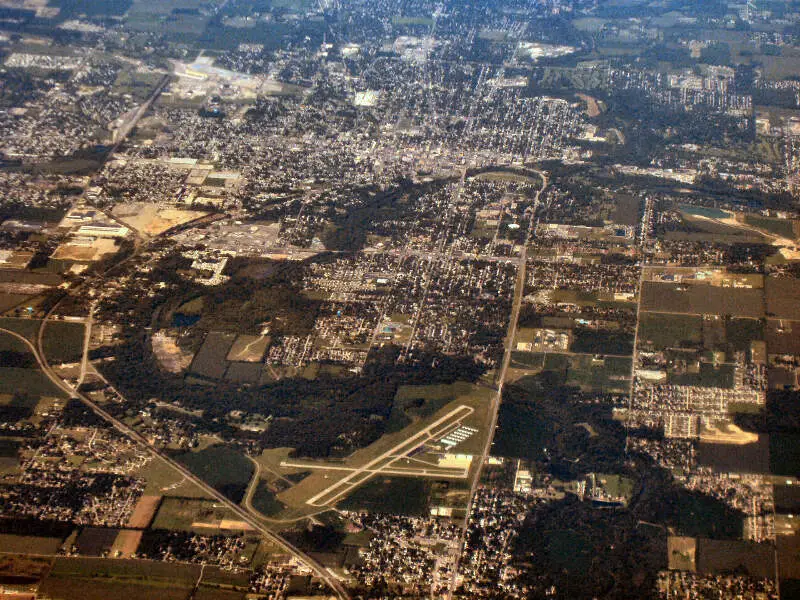
0.3% Native American · 34 Native American residents
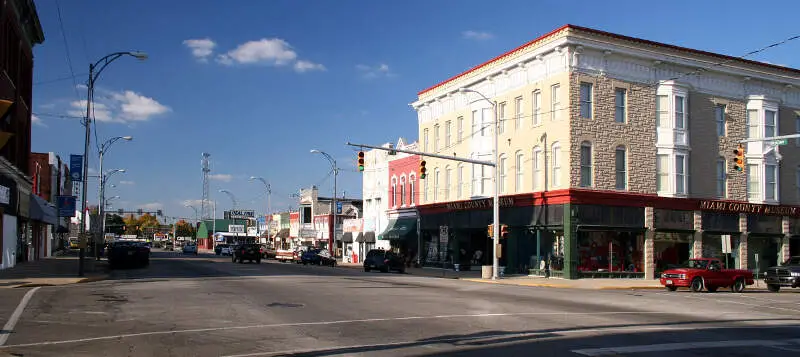
Peru is a city in, and the county seat of, Miami County, Indiana, United States. The population was 11,417 at the 2010 census, making it the most populous city in Miami County. Peru is located along the Wabash River, which divides the city in two.
Data | Crime | Cost of living | Movers
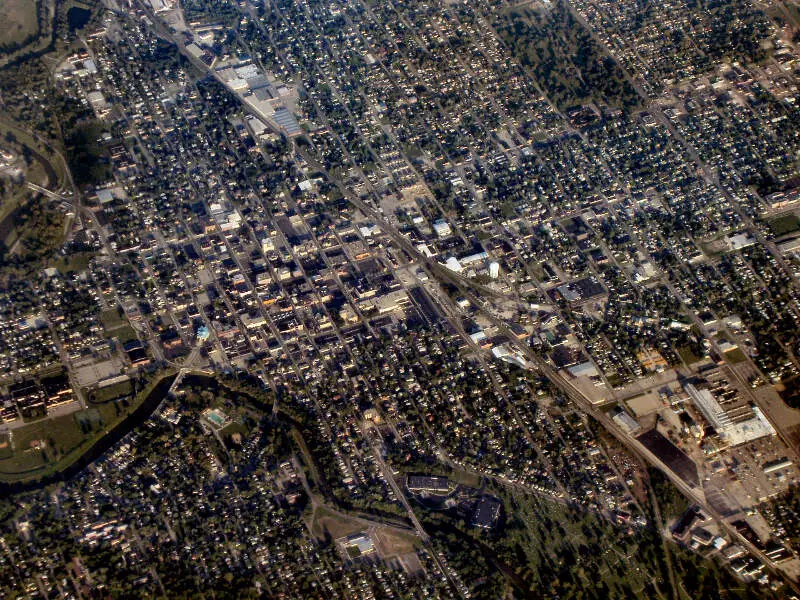
0.3% Native American · 72 Native American residents
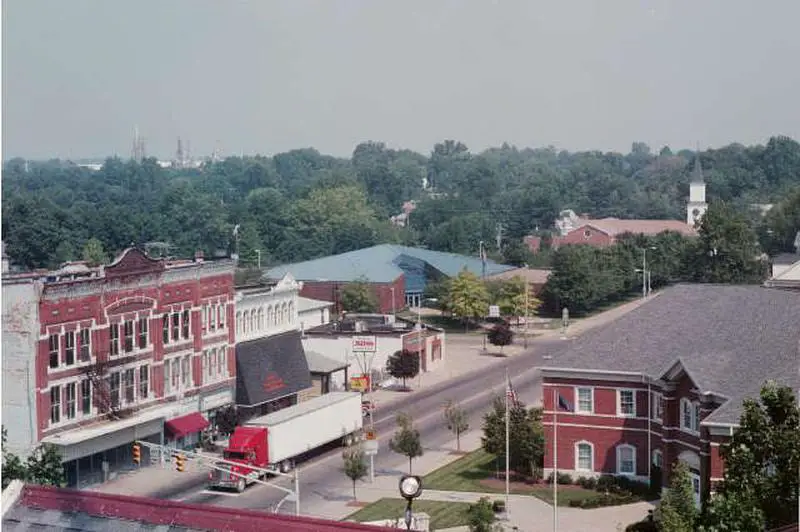
Marion is a city in Grant County, Indiana, United States. The population was 29,948 as of the 2010 census. The city is the county seat of Grant County. It is named for Francis Marion, a Brigadier General from South Carolina in the American Revolutionary War.
Data | Crime | Cost of living | Movers
0.2% Native American · 16 Native American residents
Boonville is a city in Boon Township, Warrick County, Indiana, United States. The population was 6,246 at the 2010 census. The city is the county seat of Warrick County.
Data | Crime | Cost of living | Movers
0.2% Native American · 54 Native American residents
Munster is a town located in North Township, Lake County, in Northwest Indiana, United States. This bedroom community lies in the Chicago metropolitan area, approximately 30 miles southeast of the Chicago Loop, and shares municipal boundaries with Hammond to the north, Highland to the east, Dyer and Schererville to the south and Lansing and Lynwood directly west of the Illinois border. The 2010 U.S. Census counted the town’s population at 23,603.
Data | Crime | Cost of living | Movers
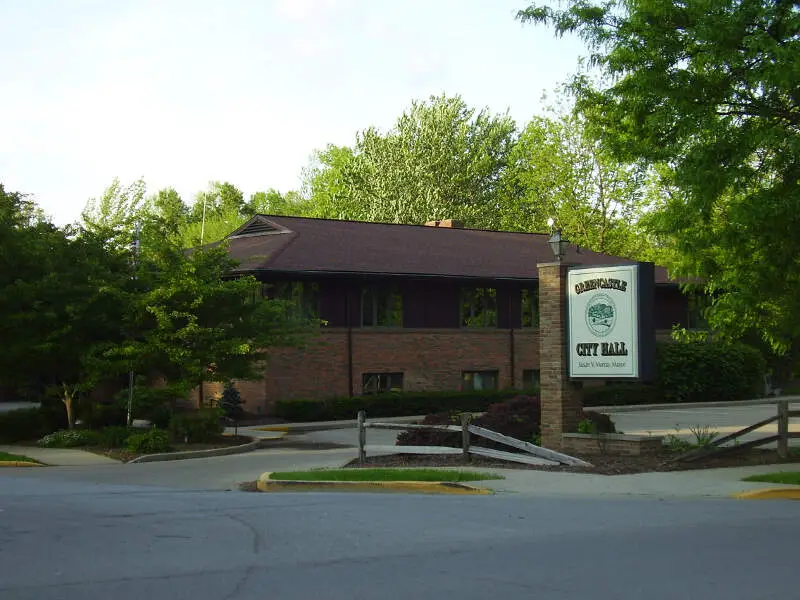
0.2% Native American · 22 Native American residents
Data | Crime | Cost of living | Movers
0.2% Native American · 116 Native American residents
Anderson is a city in and the county seat of Madison County, Indiana, United States. It is the principal city of the Anderson, Indiana Metropolitan Statistical Area which encompasses Madison County. Anderson is the headquarters of the Church of God and home of Anderson University, which is affiliated with that denomination. Highlights of the city include the historic Paramount Theatre and the Gruenewald Historic House.
Data | Crime | Cost of living | Movers
0.2% Native American · 127 Native American residents
Muncie is an incorporated city and the seat of Delaware County, Indiana. It is located in East Central Indiana, about 50 miles northeast of Indianapolis. The United States Census for 2010 reported the city’s population was 70,085. It is the principal city of the Muncie metropolitan statistical area, which has a population of 117,671.
Data | Crime | Cost of living | Movers
The receipts
Compare the top ten
Pick a metric. The bars rescale. The red line is Indiana’s statewide median.
On the map
Where Indiana’s Native American population is concentrated
Saturday Night Science
Methodology: How We Determined The Cities In Indiana With The Largest Native American Population For 2026
We still believe in the accuracy of data — especially from the Census. So that’s where we went to get the race breakdown across Indiana.
We used Saturday Night Science to analyze the Census’s most recently available data, the 2020-2024 American Community Survey data.
Specifically, we looked at table B03002: Hispanic OR LATINO ORIGIN BY RACE. Here are the category names as defined by the Census:
- Hispanic or Latino
- White alone
- Black or African American alone
- American Indian and Alaska Native alone
- Asian alone
- Native Hawaiian and Other Pacific Islander alone
- Some other race alone
- Two or more races
Our particular column of interest here was the number of people identifying as American Indian and Alaska Native alone.
We limited our analysis to places with a population greater than 5,000 people. That left us with 112 cities.
We then calculated the percentage of residents that are American Indian and Alaska Native. The percentages ranked from 0.86 to 0.00.
Finally, we ranked each city based on the percentage of the American Indian and Alaska Native population, with a higher score being more American Indian and Alaska Native than a lower score. Gas City took the distinction of being the most American Indian and Alaska Native, while Zionsville was the least Native American city.
We updated this article for 2026. This article is our eleventh time ranking the cities in Indiana with the largest Native American population.
The full plate
Most Native American Places In Indiana
Click any column to sort. Search by city name.
| Rank | City | Population | Native American Population | % Native American |
|---|---|---|---|---|
| 1 | Gas City | 6,076 | 52 | 0.9% |
| 2 | Goshen | 34,420 | 134 | 0.4% |
| 3 | Mount Vernon | 6,400 | 20 | 0.3% |
| 4 | Peru | 10,901 | 34 | 0.3% |
| 5 | Marion | 27,531 | 72 | 0.3% |
| 6 | Boonville | 6,702 | 16 | 0.2% |
| 7 | Munster | 23,733 | 54 | 0.2% |
| 8 | Greencastle | 9,864 | 22 | 0.2% |
| 9 | Anderson | 55,367 | 116 | 0.2% |
| 10 | Muncie | 64,751 | 127 | 0.2% |
| 11 | Rochester | 6,215 | 12 | 0.2% |
| 12 | Plainfield | 36,369 | 70 | 0.2% |
| 13 | Terre Haute | 58,427 | 108 | 0.2% |
| 14 | Cumberland | 6,267 | 11 | 0.2% |
| 15 | Hammond | 76,768 | 103 | 0.1% |
| 16 | Madison | 12,223 | 16 | 0.1% |
| 17 | West Lafayette | 45,159 | 58 | 0.1% |
| 18 | Schererville | 29,701 | 38 | 0.1% |
| 19 | Frankfort | 15,917 | 20 | 0.1% |
| 20 | Huntingburg | 6,396 | 8 | 0.1% |
| 21 | Michigan City | 31,814 | 38 | 0.1% |
| 22 | Avon | 23,437 | 27 | 0.1% |
| 23 | South Bend | 103,085 | 113 | 0.1% |
| 24 | Plymouth | 10,664 | 10 | 0.1% |
| 25 | Logansport | 17,790 | 16 | 0.1% |
| 26 | Rensselaer | 5,573 | 5 | 0.1% |
| 27 | Columbus | 51,824 | 45 | 0.1% |
| 28 | Gary | 68,113 | 59 | 0.1% |
| 29 | Hobart | 29,558 | 25 | 0.1% |
| 30 | St. John | 22,567 | 16 | 0.1% |
| 31 | Noblesville | 73,362 | 52 | 0.1% |
| 32 | Hartford City | 5,794 | 4 | 0.1% |
| 33 | Fort Wayne | 268,589 | 170 | 0.1% |
| 34 | Griffith | 16,273 | 10 | 0.1% |
| 35 | Columbia City | 9,897 | 6 | 0.1% |
| 36 | Lafayette | 71,159 | 41 | 0.1% |
| 37 | New Haven | 15,698 | 9 | 0.1% |
| 38 | Kendallville | 10,556 | 6 | 0.1% |
| 39 | Mishawaka | 51,021 | 27 | 0.1% |
| 40 | Indianapolis | 885,860 | 467 | 0.1% |
| 41 | Brownsburg | 31,215 | 16 | 0.1% |
| 42 | Evansville | 116,116 | 58 | 0.0% |
| 43 | Lawrence | 49,517 | 24 | 0.0% |
| 44 | Greenfield | 24,940 | 12 | 0.0% |
| 45 | Princeton | 8,372 | 4 | 0.0% |
| 46 | Crown Point | 34,393 | 16 | 0.0% |
| 47 | Richmond | 35,581 | 15 | 0.0% |
| 48 | Greenwood | 66,029 | 25 | 0.0% |
| 49 | Jasper | 15,991 | 6 | 0.0% |
| 50 | Franklin | 26,168 | 9 | 0.0% |
| 51 | Valparaiso | 34,733 | 11 | 0.0% |
| 52 | Bloomington | 80,049 | 25 | 0.0% |
| 53 | Connersville | 13,109 | 4 | 0.0% |
| 54 | Vincennes | 16,586 | 5 | 0.0% |
| 55 | Danville | 11,714 | 3 | 0.0% |
| 56 | Lake Station | 13,185 | 3 | 0.0% |
| 57 | Carmel | 101,651 | 21 | 0.0% |
| 58 | Clarksville | 22,016 | 4 | 0.0% |
| 59 | La Porte | 22,449 | 4 | 0.0% |
| 60 | Jeffersonville | 51,043 | 9 | 0.0% |
| 61 | Highland | 23,680 | 3 | 0.0% |
| 62 | East Chicago | 26,022 | 3 | 0.0% |
| 63 | Portage | 38,082 | 3 | 0.0% |
| 64 | Bedford | 13,837 | 1 | 0.0% |
| 65 | Speedway | 13,968 | 1 | 0.0% |
| 66 | Kokomo | 59,122 | 4 | 0.0% |
| 67 | Crawfordsville | 16,491 | 1 | 0.0% |
| 68 | New Castle | 17,367 | 1 | 0.0% |
| 69 | Elkhart | 53,733 | 2 | 0.0% |
| 91 | Cedar Lake | 15,295 | 0 | 0.0% |
| 91 | Charlestown | 8,294 | 0 | 0.0% |
| 91 | Chesterton | 14,446 | 0 | 0.0% |
| 91 | Decatur | 9,811 | 0 | 0.0% |
| 91 | Dyer | 16,400 | 0 | 0.0% |
| 91 | Ellettsville | 6,698 | 0 | 0.0% |
| 91 | Elwood | 8,356 | 0 | 0.0% |
| 91 | Garrett | 6,642 | 0 | 0.0% |
| 91 | Greensburg | 12,229 | 0 | 0.0% |
| 91 | Merrillville | 36,476 | 0 | 0.0% |
| 91 | Lebanon | 17,812 | 0 | 0.0% |
| 91 | Linton | 5,260 | 0 | 0.0% |
| 91 | Lowell | 11,073 | 0 | 0.0% |
| 91 | Martinsville | 11,933 | 0 | 0.0% |
| 91 | Brazil | 7,831 | 0 | 0.0% |
| 91 | Monticello | 5,496 | 0 | 0.0% |
| 91 | Mooresville | 9,751 | 0 | 0.0% |
| 91 | Nappanee | 6,815 | 0 | 0.0% |
| 91 | Huntington | 17,030 | 0 | 0.0% |
| 91 | Bluffton | 10,529 | 0 | 0.0% |
| 91 | Alexandria | 5,155 | 0 | 0.0% |
| 91 | Batesville | 7,282 | 0 | 0.0% |
| 91 | Portland | 6,416 | 0 | 0.0% |
| 91 | Westville | 5,279 | 0 | 0.0% |
| 91 | Washington | 12,367 | 0 | 0.0% |
| 91 | Yor | 11,699 | 0 | 0.0% |
| 91 | Sellersburg | 10,137 | 0 | 0.0% |
| 91 | Warsaw | 16,768 | 0 | 0.0% |
| 91 | Wabash | 10,358 | 0 | 0.0% |
| 91 | Rushville | 6,036 | 0 | 0.0% |
| 91 | Salem | 6,489 | 0 | 0.0% |
Source: U.S. Census ACS 2020-2024, table B03002. 112 Indiana cities with more than 5,000 residents.
Summary
Summary: Native American Populations Across Indiana
If you’re looking for a breakdown of Native American populations across Indiana according to the most recent data, this is an accurate list.
The most Native American cities in Indiana are Gas City, Goshen, Mount Vernon, Peru, Marion, Boonville, Munster, Greencastle, Anderson, and Muncie.


