Are you looking for love in Ohio?
Or are you just hoping to hook up with a hot Ohioan?
Either way, we’ve got you covered here.
If you live in Ohio, there’s a pretty good chance there are a lot of singles in your area. The Buckeye State has plenty of people over 18 who aren’t married or in a serious relationship.
That’s great news for people who are single and looking to mingle.
So, where are the best cities for singles in Ohio? We used Saturday Night Science to find out.
Table Of Contents: Top Ten | Methodology | Summary | Table
The 10 Best Cities For Singles In Ohio For 2026
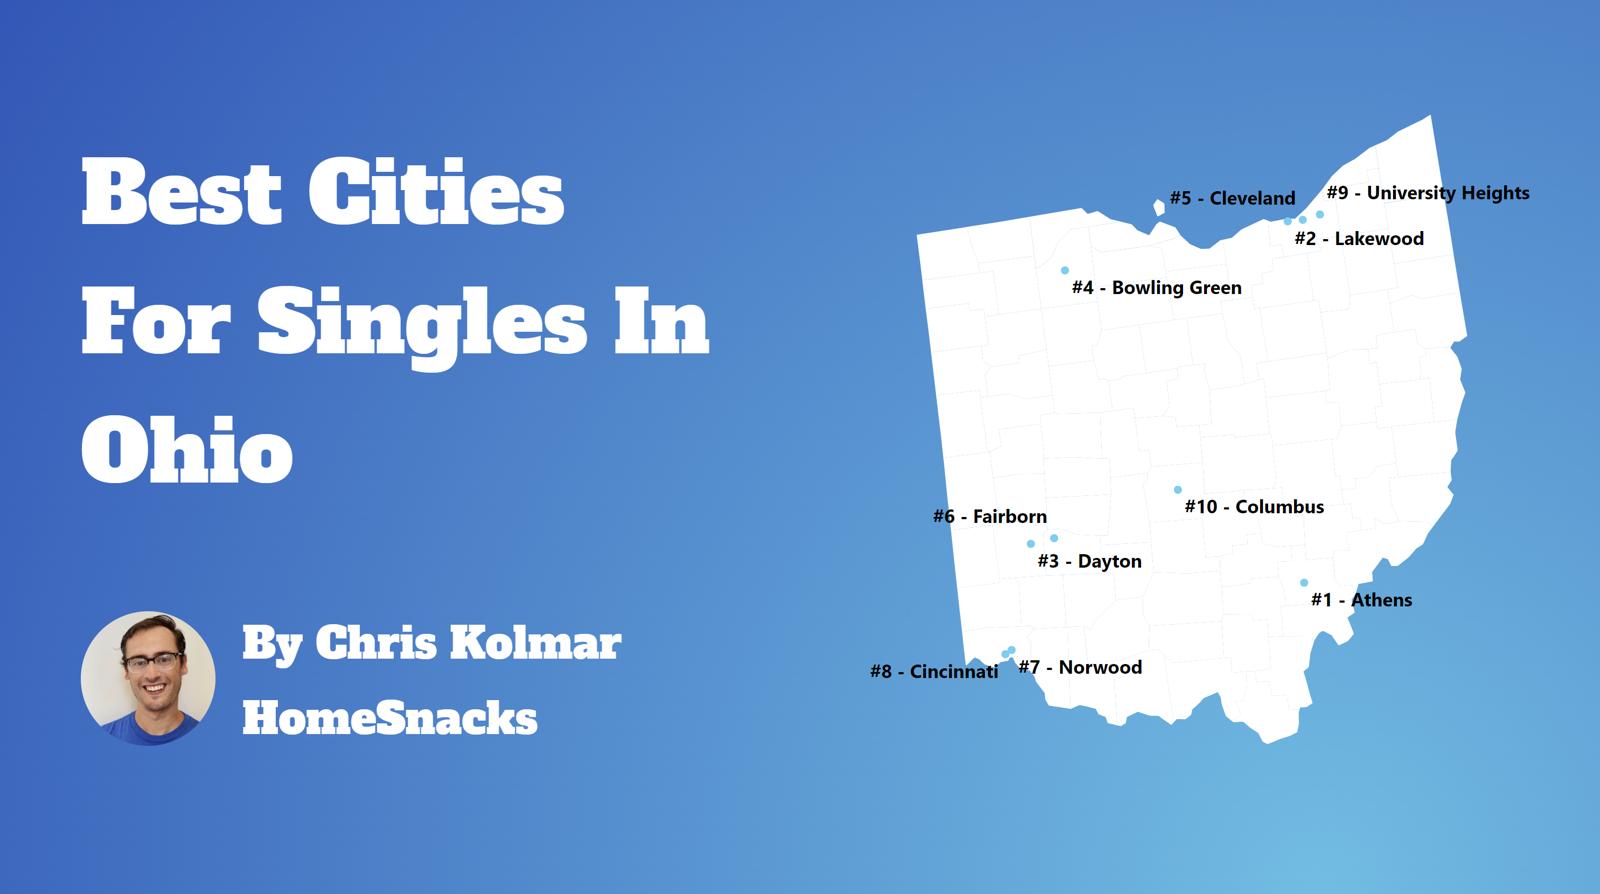
So, what was the best city for singles in Ohio? Lakewood ranks as the best place for singles in Ohio if you care about things singles care about, like nightlife, affordable housing, and other singles.
Read below to see how we crunched the numbers and how each city ranked. If you live in or are close to one of these cities and are single, you should probably get out more often.
Just saying.
For more Ohio reading, check out:
The 10 Best Cities For Singles In Ohio For 2026


/10
Population: 50,007
Median Age: 35.5
Married households: 23.0%
Households with kids: 15.2%
More on Lakewood: Data | Crime | Cost Of Living | Movers

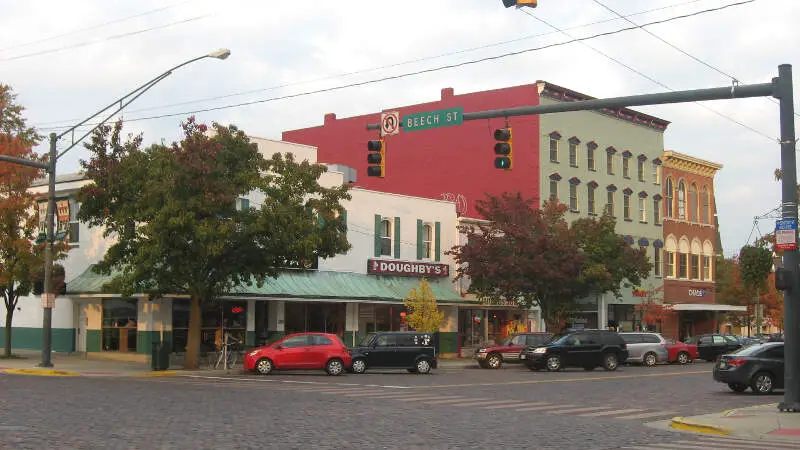
/10
Population: 29,983
Median Age: 23.5
Married households: 16.0%
Households with kids: 18.1%
More on Bowling Green: Data | Crime | Cost Of Living | Movers

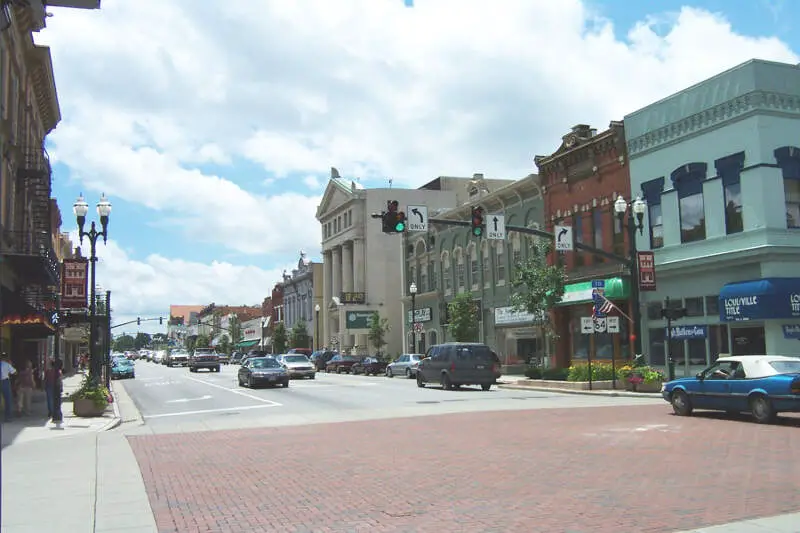
/10
Population: 23,396
Median Age: 21.6
Married households: 9.0%
Households with kids: 12.3%
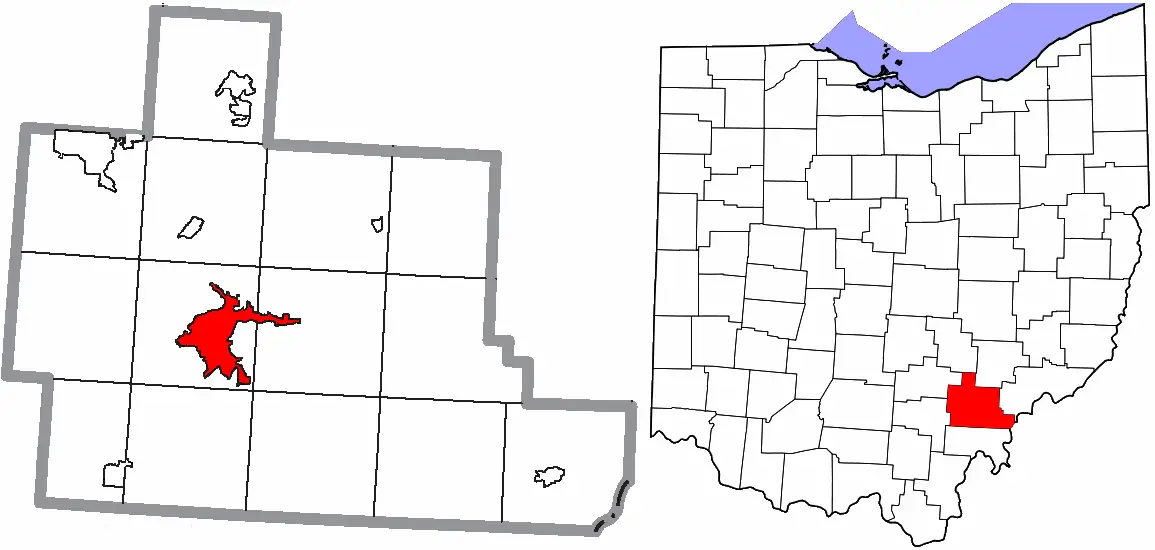
More on Athens: Data | Crime | Cost Of Living | Movers

Athens is a pretty great place to live or visit. I originally fell in love with the town when I was touring colleges and soon followed that love to a degree at the local university. Though somewhat known for its impoverished status as one of the poorest cities in America, it is a lovely, arty city of a small size filled with things that make it unique and beautiful in and of itself. It may not have the best shopping or the most activities, but it has a certain charm that has kept me there even after graduating college.
Jackie O’s Brewery is a well for its creative brews. Fluff Bakery has incredibly baked goods right within walking distance of campus. Ohio University is a beautiful college with a lot to see. The Dairy Barn has great arts and crafts to view on a daily basis. Avalanche Pizza is a local eatery that regularly wins competitions for the best pizza in the world.

/10
Population: 21,753
Median Age: 21.1
Married households: 6.0%
Households with kids: 13.1%
More on Oxford: Data | Cost Of Living | Movers


/10
Population: 311,224
Median Age: 33.2
Married households: 17.0%
Households with kids: 22.4%
More on Cincinnati: Data | Crime | Cost Of Living | Movers
Tons to do in Cincinnati. Lots of breweries and great food. The downtown area is constantly expanding with new things to do
Rhinegiest Brewery is awesome. It is downtown in an old warehouse with a beautiful rooftop patio. It is just down the street from the awesome Findlay market where you can find awesome food and local meat and produce.


/10
Population: 366,097
Median Age: 36.3
Married households: 14.0%
Households with kids: 23.5%
More on Cleveland: Data | Crime | Cost Of Living | Movers
I stayed in Cleveland, Ohio for about 2 months because I was currently staying with a friend at his house and during that time I would have to say it was the worst of my life. The crime rate is high and horrible and everyday I would hear gunshots in the neighborhood and people fighting one another. Also, the homes are run down and it is just a city that is dominated by violence and poverty. I will always stay away from this place.
To be honest, my whole time spent there was horrible from the violence to seeing nothing but run down homes. It was just a bad experience overall and I see why no one travels there.


/10
Population: 34,534
Median Age: 35.7
Married households: 23.0%
Households with kids: 22.2%
More on Fairborn: Data | Crime | Cost Of Living | Movers

/10
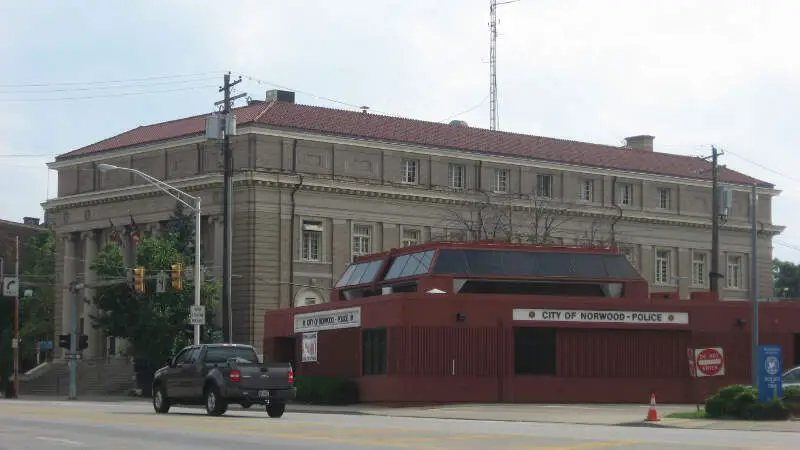
Population: 19,114
Median Age: 32.8
Married households: 24.0%
Households with kids: 21.4%
More on Norwood: Data | Cost Of Living | Movers

/10
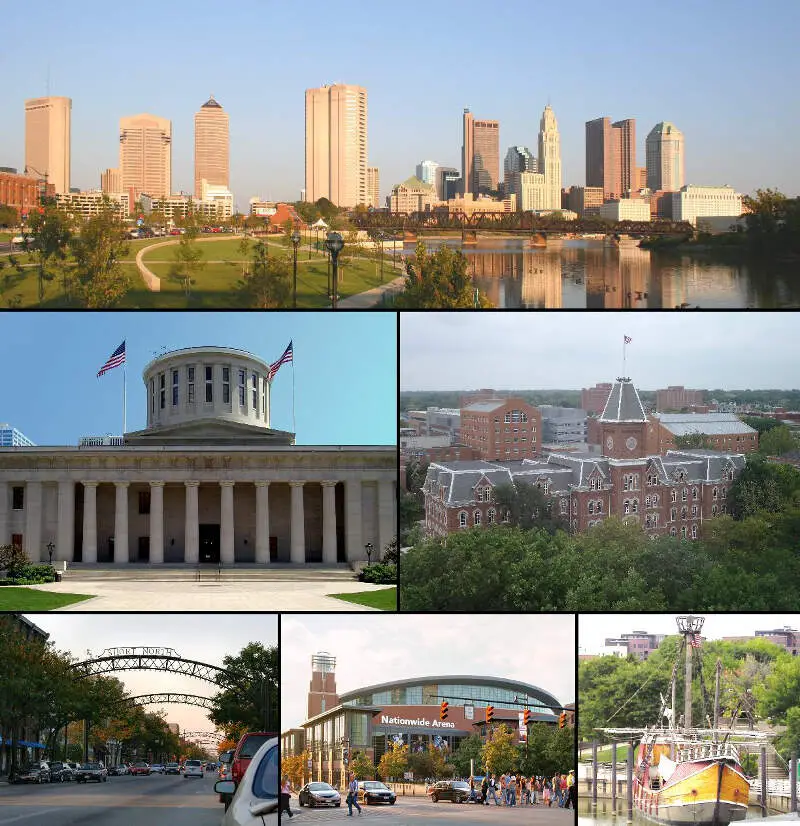
Population: 914,802
Median Age: 33.2
Married households: 18.0%
Households with kids: 26.8%
More on Columbus: Data | Crime | Cost Of Living | Movers
City centered around The Ohio State University but with a lackluster downtown and surrounded by suburbia.
S****y weather and tons of traffic with road construction.


/10
Population: 136,579
Median Age: 34.1
Married households: 15.0%
Households with kids: 25.7%
More on Dayton: Data | Crime | Cost Of Living | Movers
Dayton was listed as the 3rd worst city in the country…. I can’t believe there are 2 cities worse than mine
Junkies, junkies everywhere
Methodology: How do you determine which city is best for singles in Ohio anyways?
To give you the places in Ohio which are best for singles to find one another, we used Saturday Night Science to look at a handful of metrics. Of course, we want to measure the type of people who live in each city and make some assumptions about what single people like.
So we researched the internet for a database that contains all that information.
We threw a lot of criteria at this one to get the best, most complete results possible. Using the 2020-2024 American Community Survey Census data produced for the state of Ohio, we looked at every single city in the state. We paid particular attention to:
- Population density
- % of population that’s male vs. female (closer to a 50-50 ratio is better)
- % of households with kids
- Median age
- Number of unmarried people in each city
We then gave each city a “Singles Score.”
The higher the score, the better the city is for singles to find one another. We also limited our results to cities with over 10,000 people. For Ohio, that meant a total of 173 cities.
We updated this article for 2026. This is our eleventh time ranking the best cities for singles in Ohio.
Read on to see why Lakewood is the talk of the town while Macedonia is probably a bit on the bland side.
Summary: The Best Cities for Singles in Ohio for 2026
If you’re looking for a breakdown of cities in Ohio ranked by criteria that most agree make a place a great spot for finding a single person (and potentially love), this is an accurate list.
The best cities for singles in Ohio are Lakewood, Bowling Green, Athens, Oxford, Cincinnati, Cleveland, Fairborn, Norwood, Columbus, and Dayton.
Here’s a look at the most boring cities in Ohio according to the data:
- Macedonia
- Oregon
- Aurora
For more Ohio reading, check out:
Best Cities For Singles In Ohio
| Rank | City | Population | Median Age | % Married Households | % Households /w Kids |
|---|---|---|---|---|---|
| 1 | Lakewood, OH | 50,007 | 35.5 | 23.0% | 15.2% |
| 2 | Bowling Green, OH | 29,983 | 23.5 | 16.0% | 18.1% |
| 3 | Athens, OH | 23,396 | 21.6 | 9.0% | 12.3% |
| 4 | Oxford, OH | 21,753 | 21.1 | 6.0% | 13.1% |
| 5 | Cincinnati, OH | 311,224 | 33.2 | 17.0% | 22.4% |
| 6 | Cleveland, OH | 366,097 | 36.3 | 14.0% | 23.5% |
| 7 | Fairborn, OH | 34,534 | 35.7 | 23.0% | 22.2% |
| 8 | Norwood, OH | 19,114 | 32.8 | 24.0% | 21.4% |
| 9 | Columbus, OH | 914,802 | 33.2 | 18.0% | 26.8% |
| 10 | Dayton, OH | 136,579 | 34.1 | 15.0% | 25.7% |
| 11 | Riverside, OH | 24,435 | 36.0 | 21.0% | 25.7% |
| 12 | Warren, OH | 38,912 | 38.4 | 21.0% | 25.1% |
| 13 | Painesville, OH | 20,548 | 34.5 | 17.0% | 30.3% |
| 14 | Kent, OH | 27,116 | 23.8 | 17.0% | 19.7% |
| 15 | Tiffin, OH | 17,818 | 34.1 | 29.0% | 23.5% |
| 16 | Toledo, OH | 267,463 | 35.8 | 23.0% | 26.2% |
| 17 | Cleveland Heights, OH | 44,497 | 35.9 | 18.0% | 22.3% |
| 18 | Berea, OH | 18,218 | 37.0 | 29.0% | 26.3% |
| 19 | University Heights, OH | 13,394 | 30.5 | 23.0% | 32.1% |
| 20 | Whitehall, OH | 20,019 | 36.2 | 17.0% | 36.9% |
| 21 | South Euclid, OH | 21,534 | 37.3 | 28.0% | 27.1% |
| 22 | West Carrollton, OH | 12,976 | 36.1 | 22.0% | 27.5% |
| 23 | Parma, OH | 79,870 | 42.4 | 28.0% | 22.6% |
| 24 | Akron, OH | 189,247 | 36.9 | 22.0% | 26.4% |
| 25 | Willowick, OH | 14,162 | 42.4 | 36.0% | 19.8% |
| 26 | Steubenville, OH | 18,124 | 35.3 | 19.0% | 25.4% |
| 27 | Hamilton, OH | 63,468 | 34.8 | 24.0% | 30.9% |
| 28 | Lima, OH | 35,010 | 36.8 | 24.0% | 30.1% |
| 29 | Youngstown, OH | 59,331 | 37.5 | 16.0% | 26.2% |
| 30 | Maple Heights, OH | 23,258 | 37.8 | 20.0% | 32.2% |
| 31 | Fremont, OH | 15,835 | 36.8 | 28.0% | 27.6% |
| 32 | Parma Heights, OH | 20,581 | 40.8 | 27.0% | 26.1% |
| 33 | Fairfield, OH | 44,828 | 38.1 | 26.0% | 27.6% |
| 34 | Mayfield Heights, OH | 20,022 | 38.6 | 22.0% | 25.6% |
| 35 | Canton, OH | 69,755 | 35.2 | 22.0% | 30.1% |
| 36 | Ravenna, OH | 11,274 | 37.9 | 31.0% | 24.2% |
| 37 | Euclid, OH | 48,823 | 40.2 | 19.0% | 25.2% |
| 38 | Franklin, OH | 11,712 | 35.2 | 21.0% | 29.6% |
| 39 | Eastlake, OH | 17,493 | 46.9 | 30.0% | 19.7% |
| 40 | Marietta, OH | 13,203 | 39.4 | 20.0% | 23.4% |
| 41 | Springdale, OH | 11,033 | 38.9 | 24.0% | 24.6% |
| 42 | Lorain, OH | 65,395 | 39.8 | 25.0% | 27.9% |
| 43 | East Cleveland, OH | 13,534 | 44.3 | 9.0% | 22.9% |
| 44 | Kettering, OH | 57,206 | 38.5 | 33.0% | 25.2% |
| 45 | Bedford, OH | 12,931 | 42.2 | 25.0% | 21.8% |
| 46 | Forest Park, OH | 20,025 | 36.1 | 18.0% | 30.9% |
| 47 | Warrensville Heights, OH | 13,545 | 37.9 | 14.0% | 28.2% |
| 48 | Dover, OH | 13,053 | 41.7 | 34.0% | 25.2% |
| 49 | Sandusky, OH | 24,606 | 36.5 | 24.0% | 27.8% |
| 50 | Elyria, OH | 53,035 | 39.4 | 29.0% | 26.2% |
| 51 | Alliance, OH | 21,478 | 35.5 | 30.0% | 30.6% |
| 52 | Middletown, OH | 51,617 | 38.6 | 25.0% | 27.7% |
| 53 | Ashtabula, OH | 17,856 | 41.2 | 22.0% | 26.9% |
| 54 | Barberton, OH | 24,844 | 39.5 | 34.0% | 25.0% |
| 55 | Sharonville, OH | 14,030 | 43.5 | 27.0% | 18.3% |
| 56 | Reynoldsburg, OH | 41,224 | 37.2 | 24.0% | 30.7% |
| 57 | Marion, OH | 35,669 | 39.0 | 27.0% | 24.8% |
| 58 | Pickerington, OH | 24,477 | 36.0 | 29.0% | 44.6% |
| 59 | Bexley, OH | 13,114 | 37.5 | 32.0% | 44.0% |
| 60 | Circleville, OH | 14,142 | 35.4 | 33.0% | 27.9% |
| 61 | Bedford Heights, OH | 10,847 | 41.1 | 23.0% | 21.0% |
| 62 | Wickliffe, OH | 12,659 | 41.9 | 36.0% | 27.0% |
| 63 | Zanesville, OH | 24,740 | 36.9 | 23.0% | 28.4% |
| 64 | Cuyahoga Falls, OH | 50,909 | 38.4 | 32.0% | 23.1% |
| 65 | Beavercreek, OH | 47,126 | 40.5 | 27.0% | 29.2% |
| 66 | Washington Court House, OH | 14,439 | 38.1 | 33.0% | 25.8% |
| 67 | Wilmington, OH | 12,620 | 36.3 | 25.0% | 21.2% |
| 68 | Chillicothe, OH | 21,902 | 40.7 | 34.0% | 26.2% |
| 69 | Springfield, OH | 58,190 | 37.9 | 26.0% | 29.8% |
| 70 | Garfield Heights, OH | 29,269 | 38.1 | 25.0% | 30.1% |
| 71 | Salem, OH | 11,758 | 42.0 | 26.0% | 23.0% |
| 72 | Fairview Park, OH | 17,018 | 40.4 | 37.0% | 23.6% |
| 73 | Massillon, OH | 32,338 | 41.0 | 34.0% | 23.5% |
| 74 | Bellefontaine, OH | 13,807 | 35.6 | 30.0% | 31.8% |
| 75 | Newark, OH | 50,783 | 38.8 | 30.0% | 30.0% |
| 76 | Mansfield, OH | 47,663 | 40.0 | 22.0% | 20.5% |
| 77 | Troy, OH | 26,842 | 37.8 | 37.0% | 32.5% |
| 78 | Brooklyn, OH | 11,158 | 47.8 | 26.0% | 21.9% |
| 79 | Defiance, OH | 17,276 | 41.8 | 32.0% | 25.5% |
| 80 | Findlay, OH | 40,287 | 38.0 | 32.0% | 25.8% |
| 81 | Shaker Heights, OH | 28,922 | 41.8 | 24.0% | 29.2% |
| 82 | Piqua, OH | 20,646 | 38.8 | 35.0% | 26.3% |
| 83 | Richmond Heights, OH | 10,626 | 50.6 | 21.0% | 17.6% |
| 84 | Centerville, OH | 25,205 | 46.4 | 29.0% | 21.6% |
| 85 | North Olmsted, OH | 31,924 | 44.5 | 36.0% | 24.6% |
| 86 | Portsmouth, OH | 17,728 | 39.0 | 25.0% | 26.7% |
| 87 | Ironton, OH | 10,768 | 40.9 | 24.0% | 27.5% |
| 88 | Sidney, OH | 20,501 | 40.7 | 34.0% | 26.8% |
| 89 | Blue Ash, OH | 13,455 | 38.8 | 31.0% | 33.0% |
| 90 | Upper Arlington, OH | 36,293 | 40.2 | 38.0% | 35.9% |
| 91 | Niles, OH | 18,287 | 43.2 | 28.0% | 21.0% |
| 92 | London, OH | 10,484 | 41.9 | 36.0% | 23.2% |
| 93 | Lyndhurst, OH | 13,801 | 48.0 | 31.0% | 17.4% |
| 94 | Lancaster, OH | 41,249 | 37.4 | 34.0% | 30.3% |
| 95 | Brook Park, OH | 18,284 | 44.7 | 35.0% | 23.8% |
| 96 | Delaware, OH | 44,589 | 36.9 | 33.0% | 38.6% |
| 97 | Medina, OH | 25,950 | 40.7 | 35.0% | 28.9% |
| 98 | Rocky River, OH | 21,490 | 43.3 | 34.0% | 24.1% |
| 99 | Perrysburg, OH | 25,181 | 38.1 | 36.0% | 31.9% |
| 100 | Fostoria, OH | 12,344 | 39.1 | 32.0% | 28.9% |


