
Racial diversity in New York is a mixed bag.
There are parts of New York where there’s a high level of diversity. But where will you find the most diverse places in New York?
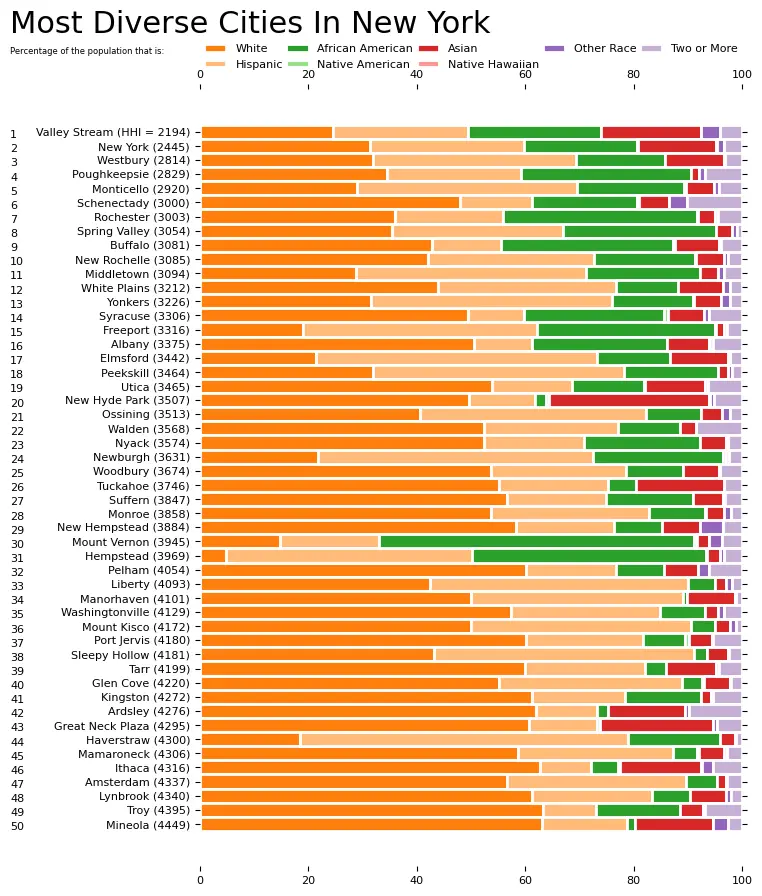
To answer that question, we went to the US Census data. Using Saturday Night Science, we measured the Gini coefficient for all 168 cities in New York to rank them from most to least diverse.
Table Of Contents: Top Ten | Methodology | Summary | Table
Here are the 10 most diverse places in New York for 2026:
So what city is the most diverse in New York? According to the most Census data, Valley Stream took the number one over all spot for diversity in New York.
Read on below to see how we crunched the numbers and how your town ranked. To see where New York ranked as a state, we have a ranking of the most diverse states in Ameria.
For more New York reading:
The 10 Most Diverse Places In New York For 2026

/10
Population: 40,315
HHI: 2,203
% White: 23.9%
% African American: 25.8%
% Hispanic: 23.6%
% Asian: 19.6%
More on Valley Stream: Data | Cost Of Living | Movers

/10
Population: 8,483,844
HHI: 2,419
% White: 31.0%
% African American: 20.4%
% Hispanic: 28.5%
% Asian: 14.6%
More on New York: Data | Crime | Cost Of Living | Movers

/10
Population: 15,808
HHI: 2,738
% White: 34.2%
% African American: 16.2%
% Hispanic: 34.4%
% Asian: 10.2%
More on Westbury: Data | Cost Of Living | Movers

/10
Population: 31,958
HHI: 2,782
% White: 32.8%
% African American: 30.0%
% Hispanic: 27.5%
% Asian: 1.6%
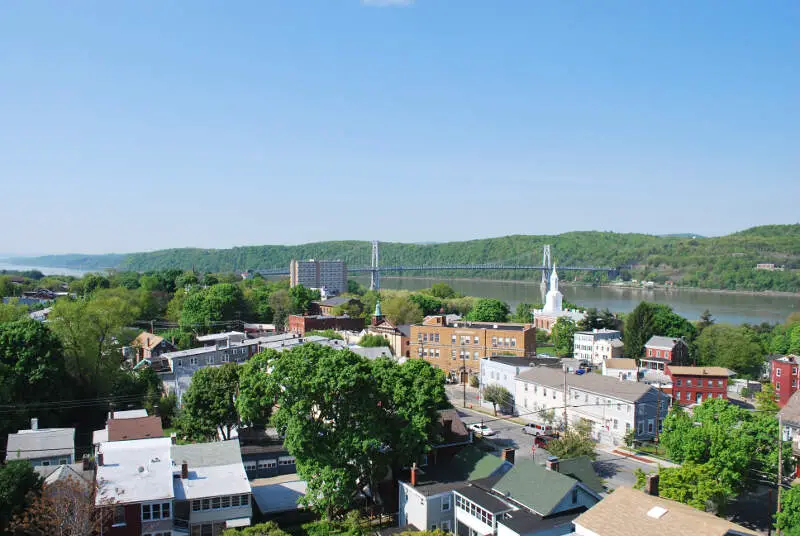
More on Poughkeepsie: Data | Crime | Cost Of Living | Movers

/10
Population: 7,279
HHI: 2,835
% White: 28.7%
% African American: 24.5%
% Hispanic: 37.1%
% Asian: 4.6%
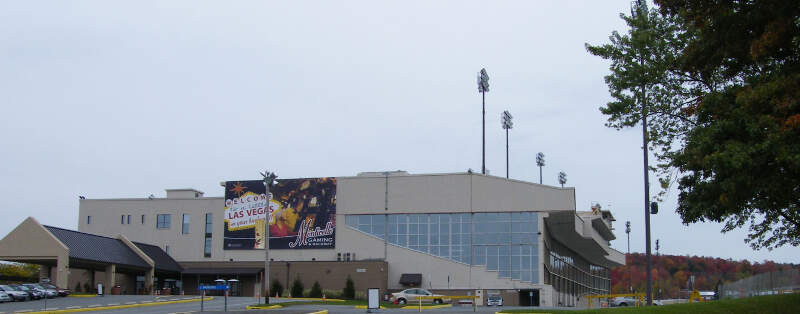
More on Monticello: Data | Crime | Cost Of Living | Movers

/10
Population: 68,847
HHI: 2,944
% White: 47.5%
% African American: 18.7%
% Hispanic: 12.7%
% Asian: 5.9%
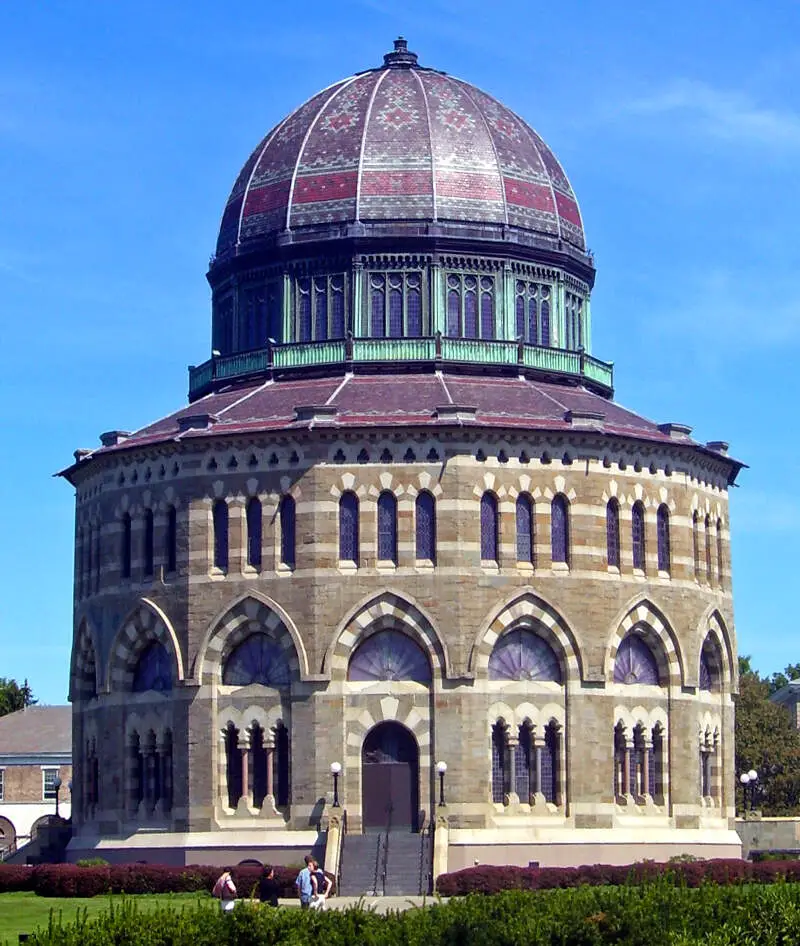
More on Schenectady: Data | Crime | Cost Of Living | Movers

/10
Population: 208,772
HHI: 2,949
% White: 36.4%
% African American: 34.7%
% Hispanic: 19.6%
% Asian: 3.2%
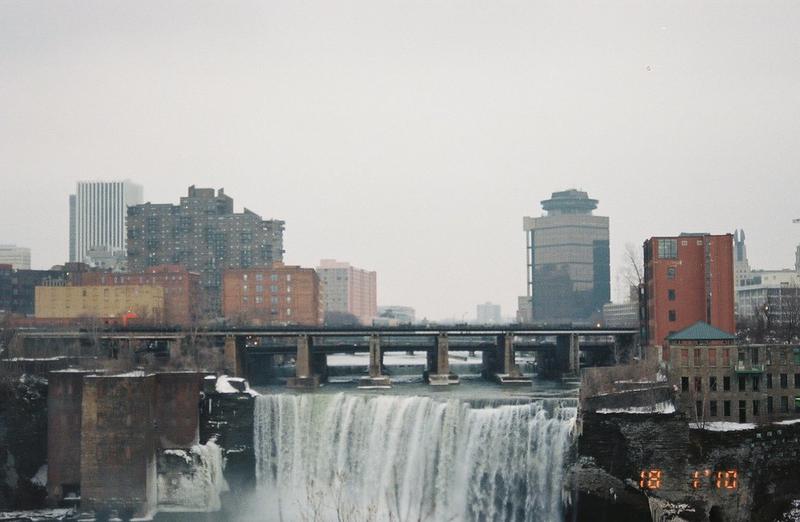
More on Rochester: Data | Crime | Cost Of Living | Movers

/10
Population: 33,192
HHI: 2,967
% White: 36.1%
% African American: 28.6%
% Hispanic: 28.7%
% Asian: 4.7%
More on Spring Valley: Data | Crime | Cost Of Living | Movers

/10
Population: 82,769
HHI: 2,985
% White: 41.4%
% African American: 18.2%
% Hispanic: 29.9%
% Asian: 5.3%
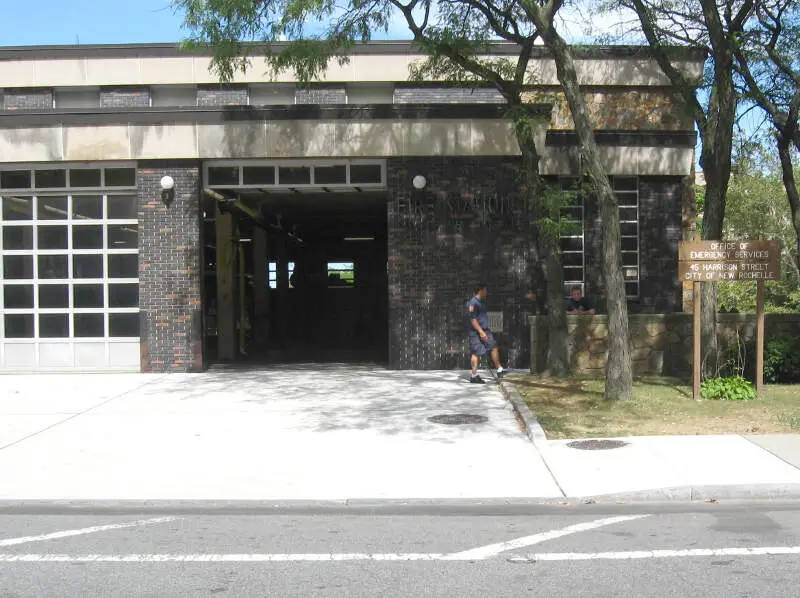
More on New Rochelle: Data | Crime | Cost Of Living | Movers

/10
Population: 276,854
HHI: 3,025
% White: 42.4%
% African American: 31.3%
% Hispanic: 12.3%
% Asian: 8.7%
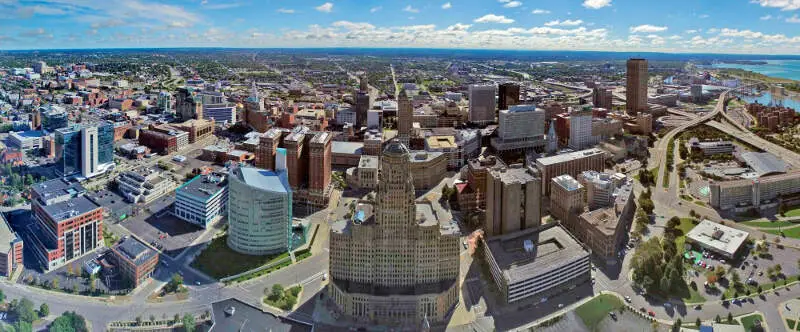
More on Buffalo: Data | Crime | Cost Of Living | Movers
Methodology: How we determined the most diverse cities in New York for 2026
We still believe in the accuracy of data — especially from the Census — and Saturday Night Science. So that’s where we went to get the race breakdown across New York.
That leads us to the Census’s most recently available data, the 2020-2024 American Community Survey data from the US Census.
Specifically, we looked at table B03002: HISPANIC OR LATINO ORIGIN BY RACE. Here are the category names as defined by the Census:
- White alone*
- Black or African American alone*
- American Indian and Alaska Native alone*
- Asian alone*
- Native Hawaiian and Other Pacific Islander alone*
- Some other race alone*
- Two or more races*
- Hispanic or Latino
We limited our analysis to non-CDPs with a population greater than 5,000 people. That left us with 168 cities.
We then calculated the HHI for each city by finding the racial breakdown of a city in percent terms, squaring them, and then adding the squares together. This left us with scores ranging from 2,203 (Valley Stream) to 9,702 (Kaser).
Finally, we ranked each city based on the HHI, with a lower score being more diverse than a high score. Valley Stream took the distinction of being the most diverse, while Kaser was the least diverse city.
We updated this article for 2026. This report is our eleventh time ranking the most diverse places in New York.
Summary: Diversity Across New York
If you’re looking for a scientific breakdown of diversity across New York, this is an accurate list.
The most diverse cities in New York are Valley Stream, New York, Westbury, Poughkeepsie, Monticello, Schenectady, Rochester, Spring Valley, New Rochelle, and Buffalo.
If you’re curious enough, here are the least diverse places in New York:
- Kaser
- Lancaster
- Kiryas Joel
For more New York reading, check out:
- Best Places To Live In New York
- Cheapest Places To Live In New York
- Most Dangerous Places In New York
- Best Places To Raise A Family In New York
- Safest Places In New York According To Science
- Worst Places To Live In New York State
Race By City In New York For 2026
| Rank | City | Population | HHI | % White | % Black | % Hispanic | % Asian |
|---|---|---|---|---|---|---|---|
| 1 | Valley Stream, NY | 40,315 | 2,203 | 23.9% | 25.8% | 23.6% | 19.6% |
| 2 | New York, NY | 8,483,844 | 2,419 | 31.0% | 20.4% | 28.5% | 14.6% |
| 3 | Westbury, NY | 15,808 | 2,738 | 34.2% | 16.2% | 34.4% | 10.2% |
| 4 | Poughkeepsie, NY | 31,958 | 2,782 | 32.8% | 30.0% | 27.5% | 1.6% |
| 5 | Monticello, NY | 7,279 | 2,835 | 28.7% | 24.5% | 37.1% | 4.6% |
| 6 | Schenectady, NY | 68,847 | 2,944 | 47.5% | 18.7% | 12.7% | 5.9% |
| 7 | Rochester, NY | 208,772 | 2,949 | 36.4% | 34.7% | 19.6% | 3.2% |
| 8 | Spring Valley, NY | 33,192 | 2,967 | 36.1% | 28.6% | 28.7% | 4.7% |
| 9 | New Rochelle, NY | 82,769 | 2,985 | 41.4% | 18.2% | 29.9% | 5.3% |
| 10 | Buffalo, NY | 276,854 | 3,025 | 42.4% | 31.3% | 12.3% | 8.7% |
| 11 | White Plains, NY | 60,666 | 3,069 | 42.5% | 12.4% | 32.1% | 8.6% |
| 12 | Walden, NY | 6,868 | 3,087 | 45.6% | 12.9% | 26.4% | 3.7% |
| 13 | Middletown, NY | 30,289 | 3,120 | 27.0% | 21.6% | 43.6% | 3.5% |
| 14 | Yonkers, NY | 209,978 | 3,247 | 30.9% | 14.6% | 45.2% | 5.3% |
| 15 | Syracuse, NY | 146,384 | 3,265 | 49.0% | 25.7% | 10.2% | 7.2% |
| 16 | Albany, NY | 100,492 | 3,321 | 50.1% | 24.6% | 11.0% | 7.7% |
| 17 | Freeport, NY | 44,088 | 3,374 | 16.2% | 32.5% | 45.2% | 2.6% |
| 18 | Manorhaven, NY | 6,958 | 3,383 | 43.0% | 0.8% | 30.1% | 25.1% |
| 19 | Utica, NY | 64,217 | 3,422 | 53.2% | 15.4% | 14.5% | 11.2% |
| 20 | Newburgh, NY | 28,519 | 3,497 | 21.9% | 24.4% | 49.1% | 0.5% |
| 21 | Nyack, NY | 7,393 | 3,510 | 52.2% | 18.2% | 20.6% | 4.5% |
| 22 | Peekskill, NY | 25,625 | 3,522 | 35.3% | 13.4% | 45.7% | 1.9% |
| 23 | Ossining, NY | 26,950 | 3,563 | 33.1% | 10.7% | 48.2% | 4.0% |
| 24 | Monroe, NY | 9,515 | 3,613 | 51.2% | 13.5% | 28.1% | 2.6% |
| 25 | Suffern, NY | 11,441 | 3,654 | 54.5% | 16.0% | 19.8% | 5.7% |
| 26 | New Hyde Park, NY | 10,220 | 3,669 | 48.9% | 1.9% | 9.4% | 34.2% |
| 27 | Great Neck Plaza, NY | 7,593 | 3,699 | 53.3% | 0.7% | 15.8% | 24.0% |
| 28 | Elmsford, NY | 5,186 | 3,821 | 18.7% | 13.4% | 56.7% | 8.3% |
| 29 | Mount Vernon, NY | 72,427 | 3,898 | 13.5% | 56.9% | 21.3% | 1.9% |
| 30 | New Hempstead, NY | 5,472 | 3,955 | 59.8% | 9.4% | 6.6% | 6.1% |
| 31 | Hempstead, NY | 58,801 | 3,957 | 4.5% | 43.2% | 45.3% | 2.8% |
| 32 | Woodbury, NY | 11,334 | 4,005 | 58.0% | 12.2% | 21.4% | 3.5% |
| 33 | Port Jervis, NY | 8,652 | 4,006 | 58.2% | 7.6% | 22.3% | 4.3% |
| 34 | Washingtonville, NY | 5,707 | 4,010 | 53.9% | 8.4% | 32.0% | 1.4% |
| 35 | Mamaroneck, NY | 19,826 | 4,026 | 56.7% | 4.8% | 27.3% | 5.8% |
| 36 | Hudson, NY | 5,865 | 4,045 | 60.4% | 12.8% | 10.3% | 10.2% |
| 37 | Glen Cove, NY | 28,112 | 4,056 | 53.9% | 4.3% | 33.0% | 5.5% |
| 38 | Wappingers Falls, NY | 5,761 | 4,067 | 55.0% | 7.3% | 31.2% | 2.7% |
| 39 | Amsterdam, NY | 18,166 | 4,127 | 53.9% | 5.3% | 34.2% | 1.5% |
| 40 | Lynbrook, NY | 20,325 | 4,140 | 59.7% | 7.7% | 21.0% | 8.4% |
| 41 | Troy, NY | 51,033 | 4,193 | 61.4% | 15.5% | 10.3% | 3.9% |
| 42 | Pelham, NY | 7,305 | 4,195 | 60.5% | 7.4% | 20.8% | 5.6% |
| 43 | West Haverstraw, NY | 10,711 | 4,211 | 16.7% | 16.0% | 60.5% | 2.8% |
| 44 | Sleepy Hollow, NY | 10,887 | 4,213 | 40.5% | 3.3% | 50.4% | 4.1% |
| 45 | Mount Kisco, NY | 10,737 | 4,214 | 58.3% | 7.1% | 27.2% | 3.9% |
| 46 | Kingston, NY | 23,911 | 4,214 | 61.2% | 12.7% | 15.9% | 3.0% |
| 47 | Port Chester, NY | 31,102 | 4,286 | 29.9% | 7.9% | 57.6% | 2.3% |
| 48 | Mineola, NY | 21,211 | 4,310 | 61.8% | 2.0% | 14.5% | 16.2% |
| 49 | Tuckahoe, NY | 6,973 | 4,310 | 61.9% | 4.8% | 15.1% | 14.5% |
| 50 | Ithaca, NY | 32,814 | 4,324 | 62.6% | 5.4% | 8.8% | 16.5% |
| 51 | Tarr, NY | 11,784 | 4,342 | 61.8% | 5.1% | 20.6% | 6.6% |
| 52 | Beacon, NY | 14,834 | 4,366 | 62.0% | 8.8% | 20.2% | 2.9% |
| 53 | New Paltz, NY | 8,314 | 4,380 | 63.5% | 7.0% | 15.0% | 5.7% |
| 54 | Niagara Falls, NY | 47,987 | 4,403 | 62.9% | 17.8% | 7.6% | 2.4% |
| 55 | Liberty, NY | 5,142 | 4,437 | 38.2% | 4.5% | 54.4% | 0.6% |
| 56 | Dunkirk, NY | 12,549 | 4,470 | 55.8% | 3.8% | 36.5% | 0.1% |
| 57 | Patchogue, NY | 12,396 | 4,524 | 62.9% | 6.5% | 22.3% | 4.1% |
| 58 | Haverstraw, NY | 12,325 | 4,539 | 18.5% | 13.8% | 63.2% | 2.7% |
| 59 | Binghamton, NY | 47,151 | 4,542 | 64.9% | 13.0% | 9.5% | 6.8% |
| 60 | Scarsdale, NY | 18,010 | 4,585 | 63.8% | 1.8% | 4.6% | 20.3% |
| 61 | Malverne, NY | 8,477 | 4,620 | 64.2% | 4.2% | 20.5% | 5.9% |
| 62 | Salamanca, NY | 5,846 | 4,624 | 64.8% | 1.9% | 6.5% | 0.1% |
| 63 | Rensselaer, NY | 9,287 | 4,711 | 66.6% | 8.0% | 8.0% | 10.3% |
| 64 | Lackawanna, NY | 19,753 | 4,835 | 66.7% | 15.2% | 11.7% | 1.6% |
| 65 | Dobbs Ferry, NY | 11,443 | 4,875 | 67.4% | 2.4% | 12.5% | 12.2% |
| 66 | Williston Park, NY | 7,542 | 4,940 | 66.9% | 1.0% | 13.9% | 16.6% |
| 67 | Floral Park, NY | 16,169 | 4,963 | 67.5% | 1.4% | 14.5% | 13.5% |
| 68 | Harrison, NY | 29,961 | 4,970 | 67.9% | 3.8% | 16.7% | 7.8% |
| 69 | Johnson City, NY | 14,940 | 5,077 | 69.4% | 7.4% | 4.0% | 11.8% |
| 70 | Great Neck, NY | 11,087 | 5,080 | 69.1% | 3.0% | 10.2% | 13.4% |
| 71 | Elmira, NY | 26,257 | 5,128 | 69.4% | 14.8% | 7.4% | 1.3% |
| 72 | Endicott, NY | 13,387 | 5,148 | 69.8% | 10.1% | 11.7% | 2.1% |
| 73 | Geneva, NY | 12,512 | 5,185 | 69.7% | 8.7% | 15.4% | 2.5% |
| 74 | Irvington, NY | 6,531 | 5,263 | 70.8% | 1.7% | 13.1% | 6.8% |
| 75 | North Hills, NY | 5,415 | 5,357 | 67.2% | 0.8% | 0.4% | 28.9% |
| 76 | Lake Grove, NY | 11,061 | 5,373 | 71.4% | 1.4% | 11.7% | 11.0% |
| 77 | Briarcliff Manor, NY | 7,519 | 5,423 | 72.0% | 1.4% | 10.0% | 9.9% |
| 78 | Lindenhurst, NY | 27,142 | 5,460 | 70.9% | 4.6% | 20.0% | 2.7% |
| 79 | Long Beach, NY | 34,756 | 5,492 | 72.3% | 2.6% | 14.1% | 4.5% |
| 80 | Cohoes, NY | 18,159 | 5,656 | 74.0% | 7.5% | 8.4% | 2.5% |
| 81 | Farmingdale, NY | 8,474 | 5,670 | 73.1% | 2.8% | 16.8% | 5.6% |
| 82 | Amityville, NY | 9,588 | 5,691 | 73.0% | 3.3% | 18.1% | 0.8% |
| 83 | Pelham Manor, NY | 5,644 | 5,709 | 74.5% | 3.4% | 8.6% | 7.8% |
| 84 | Goshen, NY | 5,773 | 5,716 | 73.1% | 1.0% | 18.7% | 3.8% |
| 85 | Watervliet, NY | 10,287 | 5,752 | 74.5% | 9.4% | 9.3% | 1.8% |
| 86 | Chestnut Ridge, NY | 10,557 | 5,782 | 74.8% | 8.1% | 10.3% | 1.6% |
| 87 | Rye Brook, NY | 9,900 | 5,919 | 75.7% | 0.8% | 8.9% | 10.1% |
| 88 | Rye, NY | 16,428 | 5,984 | 76.4% | 2.1% | 7.0% | 6.8% |
| 89 | Albion, NY | 5,506 | 5,993 | 76.2% | 6.3% | 10.6% | 0.0% |
| 90 | Cedarhurst, NY | 7,320 | 6,026 | 75.9% | 2.1% | 15.4% | 0.0% |
| 91 | Rockville Centre, NY | 25,765 | 6,083 | 77.0% | 4.9% | 9.6% | 5.6% |
| 92 | Fredonia, NY | 9,467 | 6,226 | 77.8% | 4.1% | 12.3% | 2.3% |
| 93 | Watertown, NY | 24,375 | 6,260 | 78.3% | 4.5% | 7.1% | 2.1% |
| 94 | Lockport, NY | 20,610 | 6,269 | 78.2% | 10.4% | 4.9% | 0.4% |
| 95 | East Hills, NY | 7,257 | 6,277 | 77.9% | 0.6% | 8.2% | 11.5% |
| 96 | Bronxville, NY | 6,510 | 6,284 | 78.2% | 0.5% | 10.1% | 5.6% |
| 97 | Brockport, NY | 7,277 | 6,291 | 78.5% | 8.2% | 6.7% | 3.2% |
| 98 | Port Jefferson, NY | 8,091 | 6,295 | 78.3% | 0.4% | 10.5% | 6.4% |
| 99 | Newark, NY | 8,991 | 6,374 | 78.8% | 4.2% | 11.1% | 0.5% |
| 100 | Croton-On-Hudson, NY | 8,202 | 6,374 | 78.7% | 1.8% | 12.3% | 3.1% |