
Racial diversity in Washington is a mixed bag.
There are parts of Washington where there’s a high level of diversity. But where will you find the most diverse places in Washington?
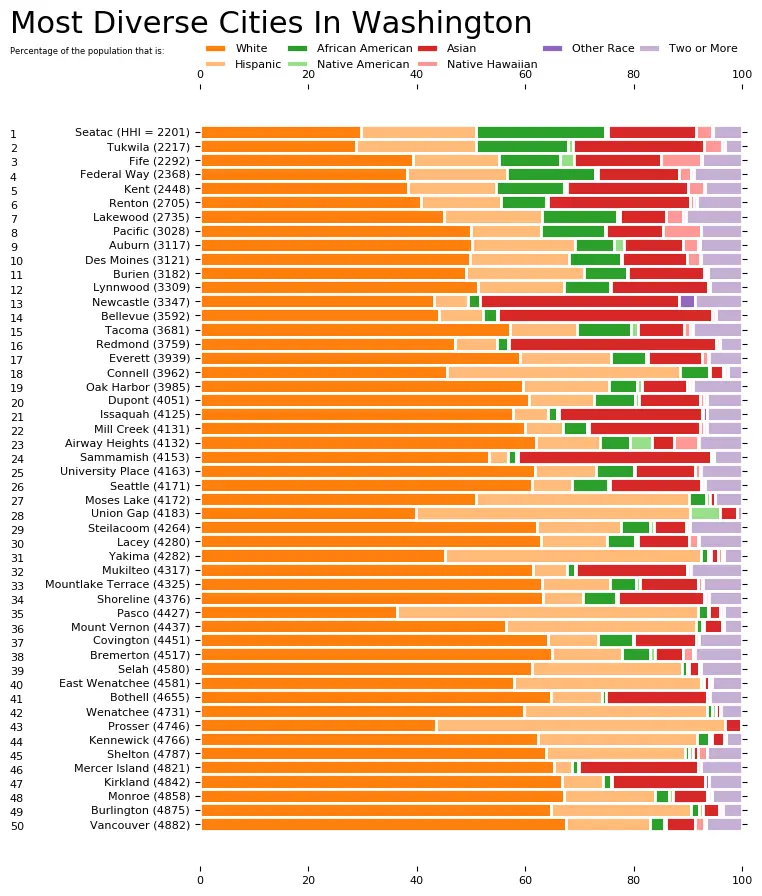
To answer that question, we went to the US Census data. Using Saturday Night Science, we measured the Gini coefficient for all 122 cities in Washington to rank them from most to least diverse.
Table Of Contents: Top Ten | Methodology | Summary | Table
Here are the 10 most diverse places in Washington for 2026:
So what city is the most diverse in Washington? According to the most Census data, Tukwila took the number one over all spot for diversity in Washington.
Read on below to see how we crunched the numbers and how your town ranked. To see where Washington ranked as a state, we have a ranking of the most diverse states in Ameria.
For more Washington reading:
The 10 Most Diverse Places In Washington For 2026

/10
Population: 21,451
HHI: 2,151
% White: 26.1%
% African American: 17.7%
% Hispanic: 24.0%
% Asian: 23.5%
More on Tukwila: Data | Crime | Cost Of Living | Movers

/10
Population: 32,414
HHI: 2,189
% White: 27.0%
% African American: 24.4%
% Hispanic: 22.8%
% Asian: 17.4%
More on Seatac: Data | Crime | Cost Of Living | Movers

/10
Population: 10,949
HHI: 2,213
% White: 37.7%
% African American: 13.3%
% Hispanic: 15.2%
% Asian: 15.7%
More on Fife: Data | Crime | Cost Of Living | Movers

/10
Population: 99,493
HHI: 2,247
% White: 34.9%
% African American: 17.8%
% Hispanic: 20.0%
% Asian: 15.3%
More on Federal Way: Data | Crime | Cost Of Living | Movers

/10
Population: 135,603
HHI: 2,396
% White: 37.0%
% African American: 12.7%
% Hispanic: 16.6%
% Asian: 23.0%
More on Kent: Data | Crime | Cost Of Living | Movers

/10
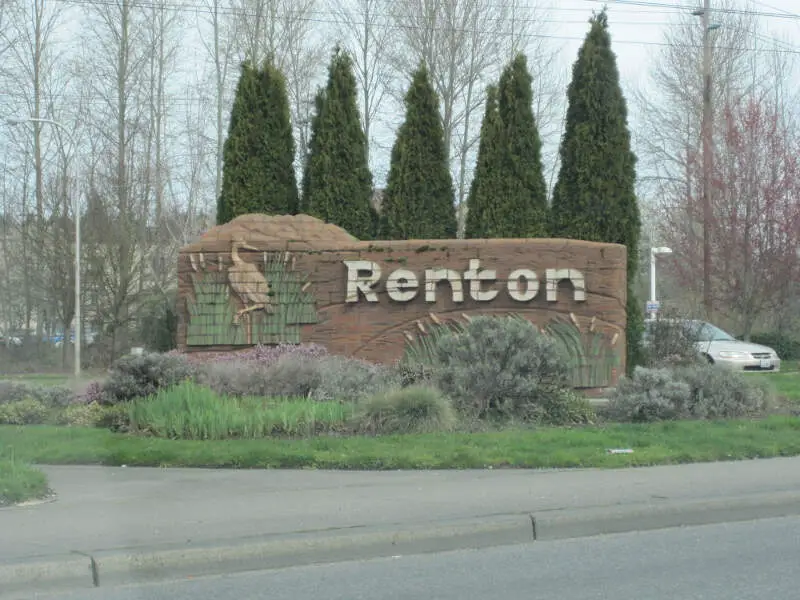
Population: 105,317
HHI: 2,587
% White: 38.6%
% African American: 9.0%
% Hispanic: 15.6%
% Asian: 26.4%
More on Renton: Data | Crime | Cost Of Living | Movers

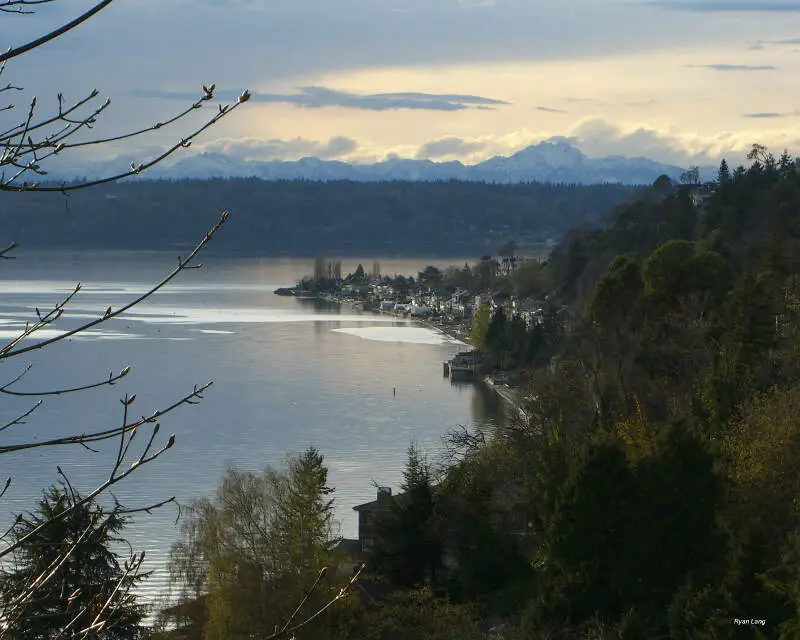
/10
Population: 32,823
HHI: 2,722
% White: 44.0%
% African American: 12.7%
% Hispanic: 19.8%
% Asian: 12.0%
More on Des Moines: Data | Crime | Cost Of Living | Movers

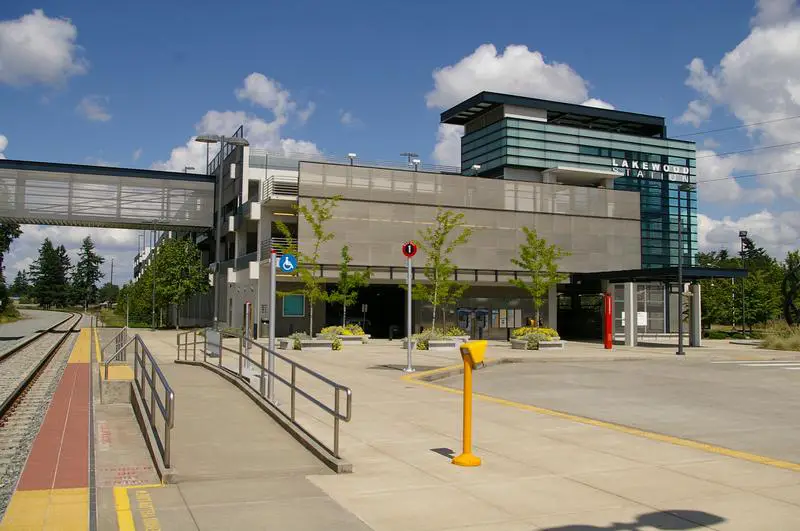
/10
Population: 62,937
HHI: 2,743
% White: 45.0%
% African American: 13.3%
% Hispanic: 18.8%
% Asian: 6.9%
More on Lakewood: Data | Crime | Cost Of Living | Movers

/10
Population: 51,513
HHI: 2,995
% White: 45.7%
% African American: 7.6%
% Hispanic: 24.2%
% Asian: 15.3%
More on Burien: Data | Crime | Cost Of Living | Movers

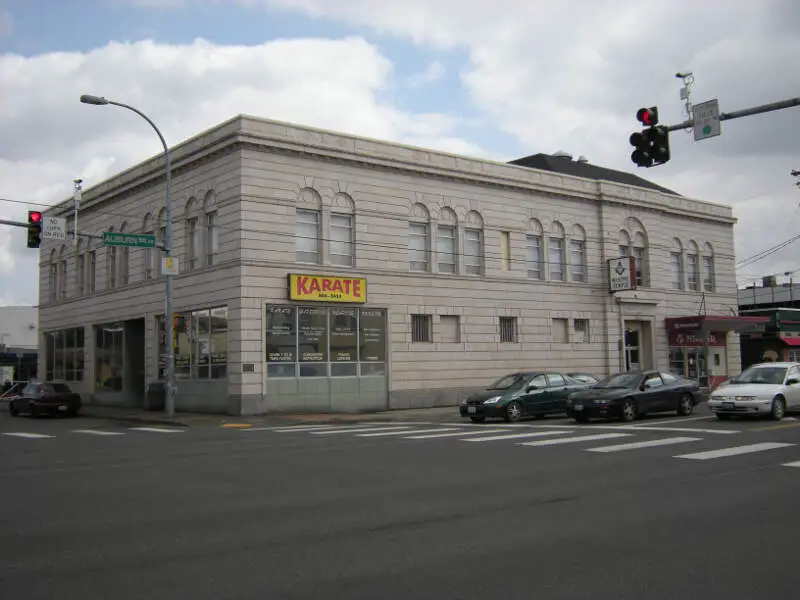
/10
Population: 85,676
HHI: 3,005
% White: 48.2%
% African American: 6.6%
% Hispanic: 20.8%
% Asian: 12.1%
More on Auburn: Data | Crime | Cost Of Living | Movers
Methodology: How we determined the most diverse cities in Washington for 2026
We still believe in the accuracy of data — especially from the Census — and Saturday Night Science. So that’s where we went to get the race breakdown across Washington.
That leads us to the Census’s most recently available data, the 2020-2024 American Community Survey data from the US Census.
Specifically, we looked at table B03002: HISPANIC OR LATINO ORIGIN BY RACE. Here are the category names as defined by the Census:
- White alone*
- Black or African American alone*
- American Indian and Alaska Native alone*
- Asian alone*
- Native Hawaiian and Other Pacific Islander alone*
- Some other race alone*
- Two or more races*
- Hispanic or Latino
We limited our analysis to non-CDPs with a population greater than 5,000 people. That left us with 122 cities.
We then calculated the HHI for each city by finding the racial breakdown of a city in percent terms, squaring them, and then adding the squares together. This left us with scores ranging from 2,151 (Tukwila) to 8,293 (Toppenish).
Finally, we ranked each city based on the HHI, with a lower score being more diverse than a high score. Tukwila took the distinction of being the most diverse, while Toppenish was the least diverse city.
We updated this article for 2026. This report is our eleventh time ranking the most diverse places in Washington.
Summary: Diversity Across Washington
If you’re looking for a scientific breakdown of diversity across Washington, this is an accurate list.
The most diverse cities in Washington are Tukwila, SeaTac, Fife, Federal Way, Kent, Renton, Des Moines, Lakewood, Burien, and Auburn.
If you’re curious enough, here are the least diverse places in Washington:
- Toppenish
- Port Townsend
- Liberty Lake
For more Washington reading, check out:
- Best Places To Live In Washington
- Cheapest Places To Live In Washington
- Most Dangerous Cities In Washington
- Best Places To Raise A Family In Washington
- Safest Places In Washington
- Worst Places To Live In Washington
Race By City In Washington For 2026
| Rank | City | Population | HHI | % White | % Black | % Hispanic | % Asian |
|---|---|---|---|---|---|---|---|
| 1 | Tukwila, WA | 21,451 | 2,151 | 26.1% | 17.7% | 24.0% | 23.5% |
| 2 | Seatac, WA | 32,414 | 2,189 | 27.0% | 24.4% | 22.8% | 17.4% |
| 3 | Fife, WA | 10,949 | 2,213 | 37.7% | 13.3% | 15.2% | 15.7% |
| 4 | Federal Way, WA | 99,493 | 2,247 | 34.9% | 17.8% | 20.0% | 15.3% |
| 5 | Kent, WA | 135,603 | 2,396 | 37.0% | 12.7% | 16.6% | 23.0% |
| 6 | Renton, WA | 105,317 | 2,587 | 38.6% | 9.0% | 15.6% | 26.4% |
| 7 | Des Moines, WA | 32,823 | 2,722 | 44.0% | 12.7% | 19.8% | 12.0% |
| 8 | Lakewood, WA | 62,937 | 2,743 | 45.0% | 13.3% | 18.8% | 6.9% |
| 9 | Burien, WA | 51,513 | 2,995 | 45.7% | 7.6% | 24.2% | 15.3% |
| 10 | Auburn, WA | 85,676 | 3,005 | 48.2% | 6.6% | 20.8% | 12.1% |
| 11 | Lynnwood, WA | 40,110 | 3,149 | 49.0% | 10.0% | 15.6% | 19.2% |
| 12 | Newcastle, WA | 12,989 | 3,309 | 37.6% | 3.5% | 4.5% | 42.1% |
| 13 | Pacific, WA | 7,066 | 3,339 | 51.4% | 6.7% | 22.4% | 10.7% |
| 14 | Bellevue, WA | 151,847 | 3,519 | 39.9% | 2.6% | 7.9% | 42.7% |
| 15 | Tacoma, WA | 222,758 | 3,547 | 55.6% | 9.3% | 13.8% | 9.4% |
| 16 | Airway Heights, WA | 11,245 | 3,642 | 57.6% | 6.0% | 11.5% | 4.3% |
| 17 | Redmond, WA | 77,353 | 3,700 | 44.8% | 2.2% | 6.7% | 40.2% |
| 18 | Dupont, WA | 9,931 | 3,744 | 57.4% | 4.5% | 12.3% | 14.4% |
| 19 | Sultan, WA | 6,116 | 3,752 | 56.0% | 1.9% | 19.2% | 13.8% |
| 20 | Everett, WA | 111,845 | 3,759 | 56.9% | 6.1% | 18.1% | 10.0% |
| 21 | Covington, WA | 21,233 | 3,863 | 58.9% | 8.1% | 11.2% | 10.9% |
| 22 | Sammamish, WA | 66,463 | 3,871 | 49.2% | 1.3% | 5.6% | 37.1% |
| 23 | University Place, WA | 34,911 | 3,892 | 59.0% | 7.1% | 12.4% | 10.7% |
| 24 | Issaquah, WA | 39,591 | 3,919 | 55.7% | 2.2% | 5.7% | 26.6% |
| 25 | Seattle, WA | 754,195 | 3,932 | 58.8% | 6.4% | 8.5% | 17.5% |
| 26 | Connell, WA | 5,054 | 3,943 | 52.3% | 4.6% | 34.2% | 3.6% |
| 27 | Mountlake Terrace, WA | 23,104 | 4,025 | 59.8% | 4.2% | 15.3% | 11.5% |
| 28 | Mukilteo, WA | 21,323 | 4,043 | 59.2% | 1.8% | 9.8% | 18.6% |
| 29 | Oak Harbor, WA | 24,362 | 4,106 | 60.7% | 3.9% | 14.0% | 9.5% |
| 30 | Shoreline, WA | 61,431 | 4,179 | 61.6% | 6.6% | 8.7% | 14.4% |
| 31 | Mount Vernon, WA | 35,377 | 4,249 | 53.6% | 1.4% | 36.8% | 3.3% |
| 32 | Moses Lake, WA | 26,083 | 4,253 | 54.7% | 2.7% | 34.9% | 1.0% |
| 33 | Mill Creek, WA | 20,956 | 4,279 | 61.3% | 3.2% | 8.6% | 20.3% |
| 34 | Yakima, WA | 96,961 | 4,284 | 42.7% | 1.0% | 49.4% | 1.3% |
| 35 | Lacey, WA | 57,737 | 4,316 | 63.3% | 5.8% | 11.4% | 9.2% |
| 36 | Bremerton, WA | 44,830 | 4,323 | 63.0% | 3.1% | 13.3% | 6.3% |
| 37 | Kenmore, WA | 23,741 | 4,352 | 62.7% | 2.8% | 9.8% | 16.2% |
| 38 | Kirkland, WA | 92,621 | 4,372 | 62.3% | 1.8% | 7.8% | 19.3% |
| 39 | Yelm, WA | 11,102 | 4,372 | 63.2% | 4.8% | 16.3% | 1.3% |
| 40 | Marysville, WA | 73,002 | 4,389 | 63.0% | 3.4% | 16.9% | 8.6% |
| 41 | East Wenatchee, WA | 14,199 | 4,408 | 54.7% | 0.7% | 37.2% | 1.2% |
| 42 | Monroe, WA | 19,755 | 4,461 | 63.4% | 3.2% | 17.6% | 9.5% |
| 43 | Kennewick, WA | 85,295 | 4,501 | 58.2% | 2.2% | 33.0% | 2.0% |
| 44 | Union Gap, WA | 6,584 | 4,509 | 34.2% | 0.0% | 57.6% | 2.7% |
| 45 | Milton, WA | 8,894 | 4,519 | 64.5% | 3.8% | 15.9% | 5.4% |
| 46 | Pasco, WA | 79,575 | 4,588 | 34.0% | 1.8% | 58.5% | 1.8% |
| 47 | Bothell, WA | 49,610 | 4,622 | 64.4% | 0.8% | 8.4% | 19.1% |
| 48 | Selah, WA | 8,437 | 4,633 | 61.5% | 0.3% | 28.5% | 2.4% |
| 49 | Vancouver, WA | 195,300 | 4,639 | 65.3% | 3.1% | 16.8% | 5.3% |
| 50 | Wenatchee, WA | 35,484 | 4,645 | 57.9% | 0.5% | 35.7% | 0.9% |
| 51 | Woodinville, WA | 13,438 | 4,646 | 64.6% | 1.6% | 8.0% | 19.2% |
| 52 | Tumwater, WA | 26,956 | 4,673 | 66.5% | 4.6% | 9.3% | 7.3% |
| 53 | Mercer Island, WA | 25,307 | 4,680 | 63.3% | 0.9% | 2.4% | 24.4% |
| 54 | Omak, WA | 5,036 | 4,680 | 65.6% | 0.4% | 14.3% | 1.3% |
| 55 | Burlington, WA | 10,003 | 4,719 | 62.3% | 1.6% | 28.6% | 2.5% |
| 56 | Shelton, WA | 10,612 | 4,841 | 63.3% | 0.3% | 28.2% | 0.9% |
| 57 | Duvall, WA | 8,526 | 4,844 | 66.2% | 0.6% | 17.6% | 11.5% |
| 58 | Prosser, WA | 6,305 | 4,847 | 45.0% | 0.0% | 53.1% | 0.7% |
| 59 | Lake Stevens, WA | 40,253 | 4,855 | 67.6% | 2.5% | 11.3% | 10.1% |
| 60 | Aberdeen, WA | 17,088 | 4,856 | 65.5% | 1.3% | 22.8% | 1.5% |
| 61 | Ephrata, WA | 8,560 | 4,901 | 61.2% | 0.5% | 33.8% | 0.1% |
| 62 | Walla Walla, WA | 33,925 | 4,907 | 65.0% | 2.4% | 25.7% | 2.0% |
| 63 | Black Diamond, WA | 5,961 | 4,909 | 67.0% | 0.4% | 7.9% | 17.6% |
| 64 | Lake Forest Park, WA | 13,335 | 4,915 | 68.3% | 5.2% | 5.9% | 11.2% |
| 65 | Pullman, WA | 32,229 | 4,916 | 68.0% | 1.6% | 9.2% | 9.4% |
| 66 | Maple Valley, WA | 28,287 | 4,927 | 67.7% | 1.6% | 5.0% | 15.4% |
| 67 | Steilacoom, WA | 6,686 | 4,949 | 68.2% | 4.4% | 13.1% | 5.0% |
| 68 | Puyallup, WA | 42,746 | 5,013 | 69.0% | 3.7% | 11.2% | 5.6% |
| 69 | North Bend, WA | 7,953 | 5,041 | 68.8% | 0.0% | 13.3% | 6.3% |
| 70 | Fircrest, WA | 7,069 | 5,064 | 69.3% | 5.6% | 4.6% | 7.5% |
| 71 | Camas, WA | 27,007 | 5,161 | 70.0% | 1.4% | 6.5% | 12.6% |
| 72 | Ferndale, WA | 15,999 | 5,174 | 70.0% | 0.6% | 12.6% | 8.4% |
| 73 | Edgewood, WA | 13,032 | 5,214 | 70.9% | 3.0% | 7.9% | 7.9% |
| 74 | Brier, WA | 6,545 | 5,244 | 71.0% | 6.8% | 3.0% | 10.6% |
| 75 | Olympia, WA | 55,951 | 5,286 | 71.2% | 2.7% | 10.6% | 6.7% |
| 76 | Arlington, WA | 21,095 | 5,407 | 71.4% | 1.4% | 16.0% | 5.4% |
| 77 | Sedro-Woolley, WA | 12,831 | 5,421 | 70.6% | 0.3% | 20.3% | 2.5% |
| 78 | College Place, WA | 9,854 | 5,447 | 71.0% | 0.9% | 19.3% | 3.0% |
| 79 | Edmonds, WA | 42,735 | 5,455 | 72.5% | 2.3% | 6.1% | 10.0% |
| 80 | Richland, WA | 62,753 | 5,497 | 72.2% | 1.0% | 14.8% | 6.4% |
| 81 | Blaine, WA | 6,100 | 5,580 | 73.6% | 2.3% | 9.9% | 4.6% |
| 82 | Sumner, WA | 10,733 | 5,590 | 71.5% | 0.4% | 21.1% | 0.6% |
| 83 | Port Orchard, WA | 17,149 | 5,594 | 73.5% | 1.3% | 10.6% | 4.9% |
| 84 | Poulsbo, WA | 12,165 | 5,595 | 73.5% | 2.3% | 10.9% | 2.4% |
| 85 | Centralia, WA | 18,830 | 5,644 | 72.4% | 1.1% | 19.7% | 1.6% |
| 86 | West Richland, WA | 17,586 | 5,661 | 73.4% | 0.7% | 14.6% | 2.1% |
| 87 | Woodland, WA | 6,487 | 5,721 | 71.9% | 0.9% | 23.2% | 0.4% |
| 88 | Cheney, WA | 12,804 | 5,727 | 74.4% | 1.1% | 10.7% | 3.5% |
| 89 | Kelso, WA | 12,684 | 5,887 | 75.4% | 1.9% | 10.3% | 0.7% |
| 90 | Bonney Lake, WA | 22,090 | 5,898 | 75.6% | 2.2% | 9.0% | 3.3% |
| 91 | Ellensburg, WA | 20,874 | 5,956 | 75.8% | 2.1% | 12.8% | 2.6% |
| 92 | Bellingham, WA | 93,438 | 5,976 | 76.2% | 1.3% | 10.2% | 5.2% |
| 93 | Snoqualmie, WA | 13,798 | 6,032 | 76.1% | 0.6% | 2.7% | 14.0% |
| 94 | Ridgefield, WA | 13,408 | 6,102 | 77.0% | 1.4% | 10.3% | 3.6% |
| 95 | Chehalis, WA | 7,587 | 6,118 | 76.6% | 1.0% | 14.6% | 0.5% |
| 96 | Spokane, WA | 230,293 | 6,151 | 77.6% | 2.8% | 8.4% | 2.5% |
| 97 | Orting, WA | 8,978 | 6,158 | 77.5% | 1.5% | 9.6% | 3.2% |
| 98 | Longview, WA | 38,069 | 6,165 | 77.2% | 0.6% | 12.6% | 1.7% |
| 99 | Lynden, WA | 16,234 | 6,192 | 77.2% | 0.3% | 13.9% | 2.3% |
| 100 | Quincy, WA | 7,998 | 6,196 | 19.5% | 0.5% | 76.2% | 1.2% |