We all love the biggest cities that the Sooner State has to offer. You know the places like Oklahoma City and Tulsa which make all the headlines.
But there are a bunch of other great large cities in Oklahoma that don't get as much love.
We're going to change that right now.
Using the most recent Census data, we can tell you about all the places in Oklahoma with a focus on the biggest. We update the data each year and this is our fourth time doing this.
The Largest Cities In Oklahoma For 2026:
You can click here to see a full table of the 100 biggest cities in Oklahoma, along with every other place over 1,000 people big. It is sortable by clicking on the headers.
Read on below to see more on the biggest cities. Or for more reading on places to live in Oklahoma, check out:
- Best Places To Live In Oklahoma
- Cheapest Places To Live In Oklahoma
- Most Dangerous Cities In Oklahoma
The 10 Biggest Cities In Oklahoma

/10
Rank Last Year: 1 (No Change)
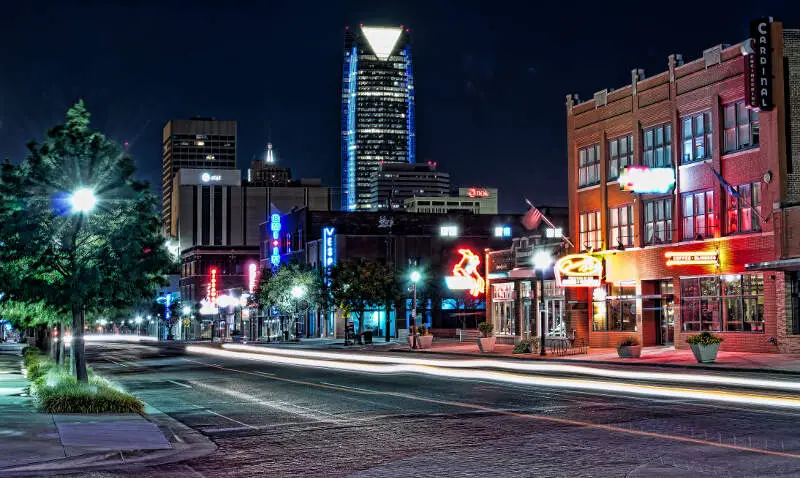
Population: 697,125.0
Population 2010: 563,571
Growth: 23.7%
More on Oklahoma City: Data | Crime | Cost Of Living | Real Estate

/10
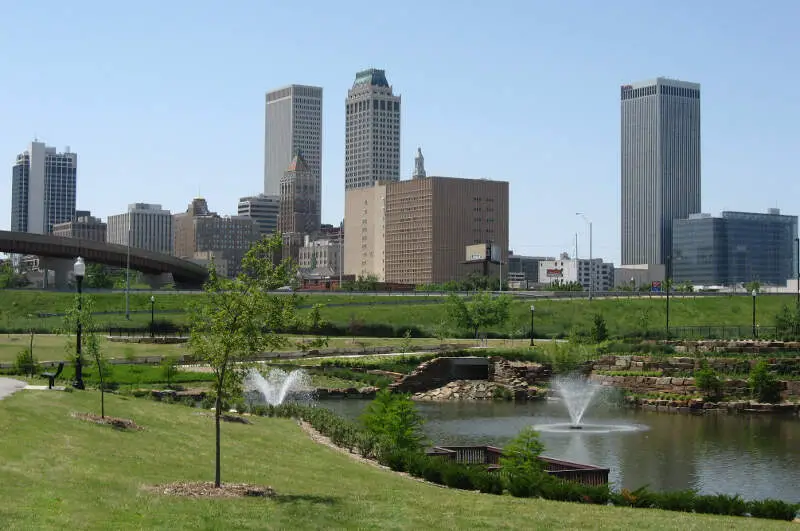
Rank Last Year: 2 (No Change)
Population: 413,794.0
Population 2010: 388,247
Growth: 6.6%
More on Tulsa: Data | Crime | Cost Of Living | Real Estate

/10
Rank Last Year: 3 (No Change)
Population: 129,672.0
Population 2010: 108,265
Growth: 19.8%
More on Norman: Data | Crime | Cost Of Living | Real Estate
/10
Rank Last Year: 4 (No Change)
Population: 118,180.0
Population 2010: 94,755
Growth: 24.7%
More on Broken Arrow: Data | Crime | Cost Of Living | Real Estate

/10
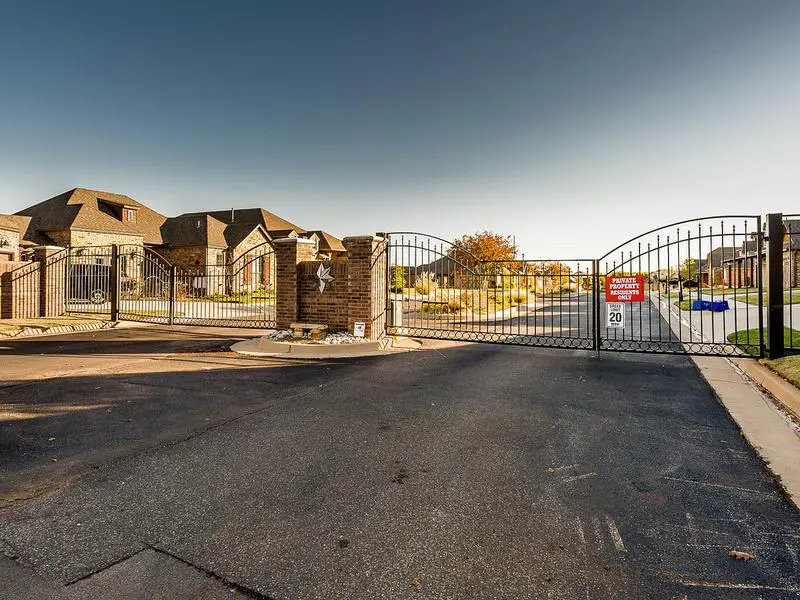
Rank Last Year: 5 (No Change)
Population: 96,825.0
Population 2010: 78,598
Growth: 23.2%
More on Edmond: Data | Crime | Cost Of Living | Real Estate

/10
Rank Last Year: 6 (No Change)
Population: 90,595.0
Population 2010: 94,217
Growth: -3.8%
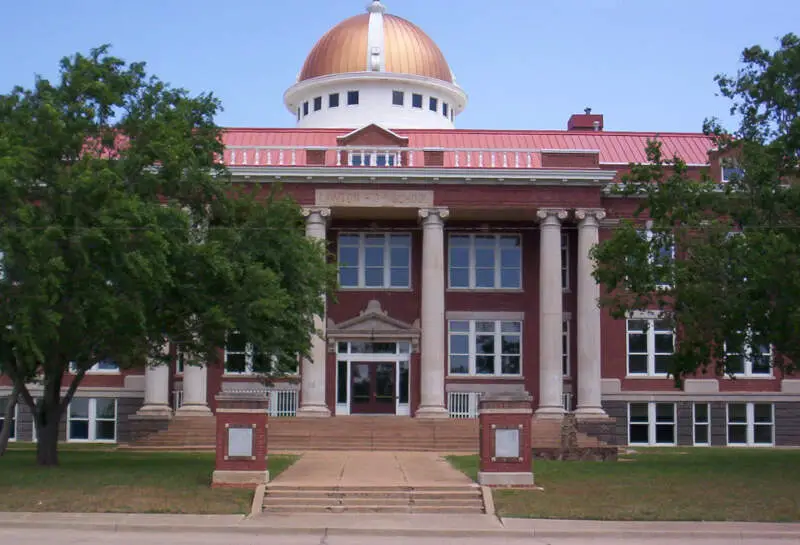
More on Lawton: Data | Crime | Cost Of Living | Real Estate

/10
Rank Last Year: 7 (No Change)
Population: 63,420.0
Population 2010: 52,506
Growth: 20.8%
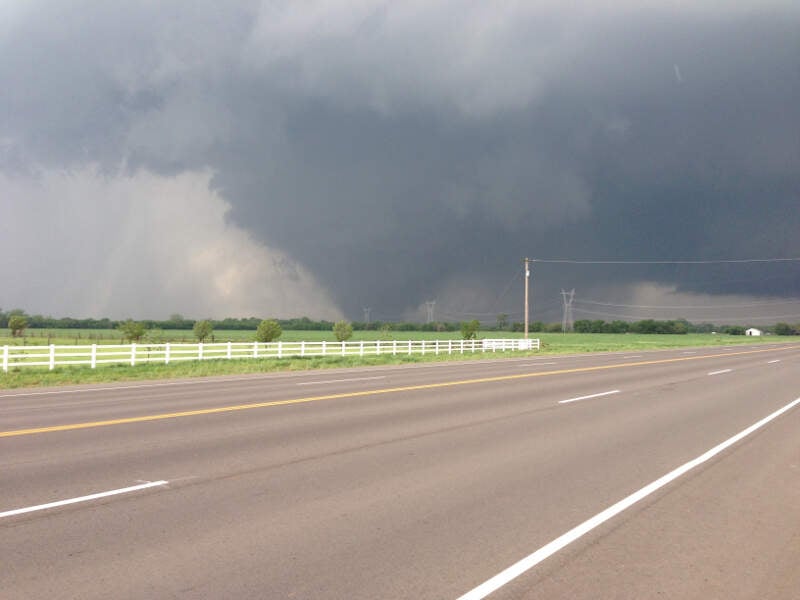
More on Moore: Data | Crime | Cost Of Living | Real Estate

/10
Rank Last Year: 8 (No Change)
Population: 58,297.0
Population 2010: 53,919
Growth: 8.1%
More on Midwest City: Data | Crime | Cost Of Living | Real Estate

/10
Rank Last Year: 9 (No Change)
Population: 50,653.0
Population 2010: 48,126
Growth: 5.3%
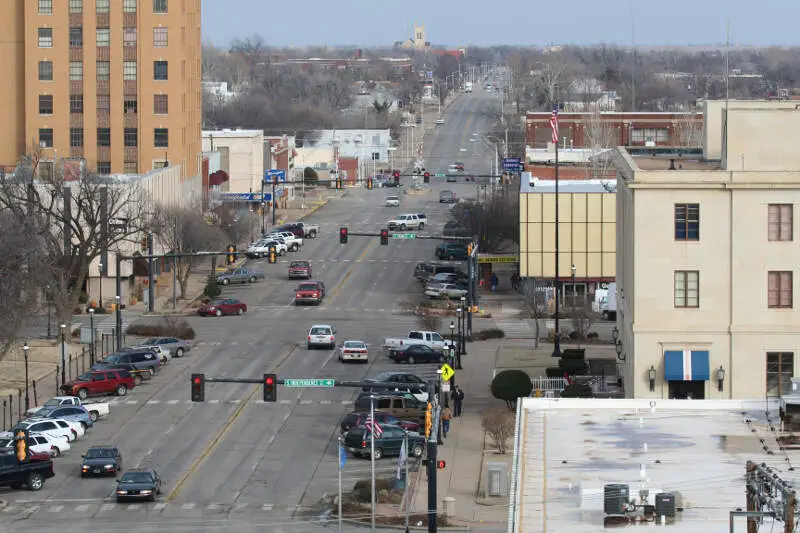
More on Enid: Data | Crime | Cost Of Living | Real Estate

/10
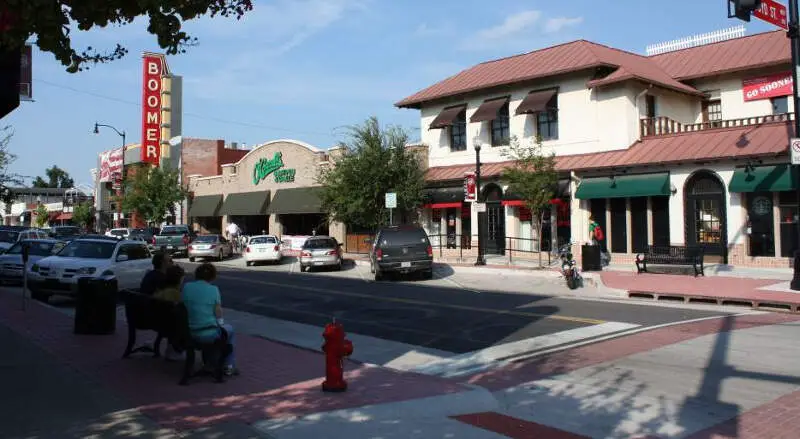
Rank Last Year: 10 (No Change)
Population: 49,269.0
Population 2010: 44,681
Growth: 10.3%
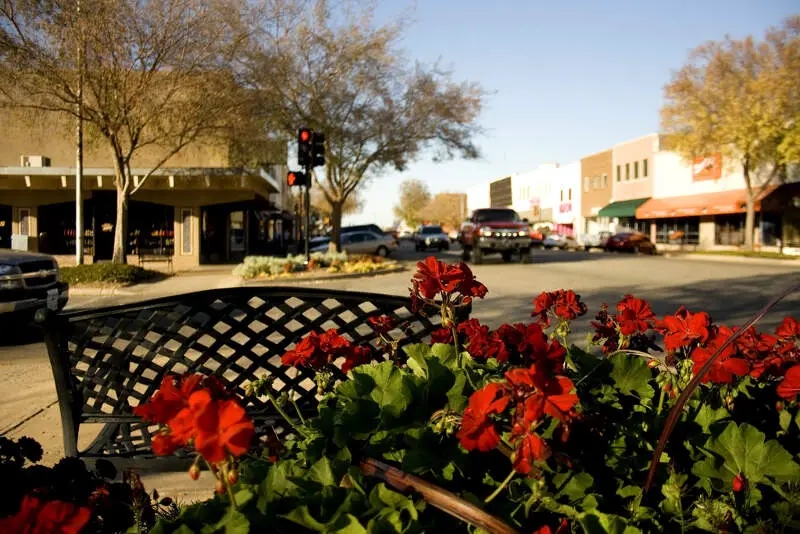
More on Stillwater: Data | Crime | Cost Of Living | Real Estate
How We Determined The Largest Cities In Oklahoma
We've been ranking and dissecting cities in the Sooner State for over 4 years now -- making this actually the fourth time we've run the numbers. We always use the best data, the US Census. In this case, that means we are using the American Community Survey.
It what is probably the most simple analysis we run each year, we ranked every place in Oklahoma from biggest to smallest. The biggest city this year? That would be Oklahoma City.
The smallest? Medford, although there are places smaller than 1,000 people not listed here, so keep that in mind as we take a look at the top ten.
Now on to numbers 11-100 Biggest in Oklahoma
We hope that you find the big city, or really any city, that's right for you. Below is a list of the rest of the biggest cities along with every other place in Oklahoma.
Have fun snacking around in the Sooner State!
For more reading on Oklahoma, check out:
- Best Places To Raise A Family In Oklahoma
- Best Places To Retire In Oklahoma
- Richest Cities In Oklahoma
- Safest Places In Oklahoma
- Worst Places To Live In Oklahoma
- Most Expensive Places To Live In Oklahoma
Detailed List Of The Biggest Cities In Oklahoma
| Rank | City | Current Population | 2010 | Growth |
|---|---|---|---|---|
| 1 | Oklahoma City | 697,125.0 | 563,571 | 23.7% |
| 2 | Tulsa | 413,794.0 | 388,247 | 6.6% |
| 3 | Norman | 129,672.0 | 108,265 | 19.8% |
| 4 | Broken Arrow | 118,180.0 | 94,755 | 24.7% |
| 5 | Edmond | 96,825.0 | 78,598 | 23.2% |
| 6 | Lawton | 90,595.0 | 94,217 | -3.8% |
| 7 | Moore | 63,420.0 | 52,506 | 20.8% |
| 8 | Midwest City | 58,297.0 | 53,919 | 8.1% |
| 9 | Enid | 50,653.0 | 48,126 | 5.3% |
| 10 | Stillwater | 49,269.0 | 44,681 | 10.3% |
| 11 | Owasso | 40,151.0 | 26,905 | 49.2% |
| 12 | Bartlesville | 37,878.0 | 35,391 | 7.0% |
| 13 | Muskogee | 36,758.0 | 39,052 | -5.9% |
| 14 | Shawnee | 31,671.0 | 29,757 | 6.4% |
| 15 | Bixby | 30,155.0 | 19,419 | 55.3% |
| 16 | Jenks | 27,102.0 | 15,446 | 75.5% |
| 17 | Yukon | 25,529.0 | 22,265 | 14.7% |
| 18 | Ardmore | 24,877.0 | 24,145 | 3.0% |
| 19 | Ponca City | 24,326.0 | 25,326 | -3.9% |
| 20 | Duncan | 22,958.0 | 23,157 | -0.9% |
| 21 | Sapulpa | 22,570.0 | 20,434 | 10.5% |
| 22 | Mustang | 22,192.0 | 16,529 | 34.3% |
| 23 | Del City | 21,494.0 | 21,380 | 0.5% |
| 24 | Bethany | 20,560.0 | 19,202 | 7.1% |
| 25 | Claremore | 20,166.0 | 18,416 | 9.5% |
| 26 | Sand Springs | 20,117.0 | 18,455 | 9.0% |
| 27 | Durant | 19,746.0 | 15,612 | 26.5% |
| 28 | Altus | 18,646.0 | 19,784 | -5.8% |
| 29 | El Reno | 18,557.0 | 16,542 | 12.2% |
| 30 | Mcalester | 18,111.0 | 18,365 | -1.4% |
| 31 | Tahlequah | 16,935.0 | 15,621 | 8.4% |
| 32 | Ada | 16,575.0 | 16,543 | 0.2% |
| 33 | Chickasha | 16,539.0 | 16,196 | 2.1% |
| 34 | Glenpool | 14,151.0 | 10,319 | 37.1% |
| 35 | Newcastle | 13,001.0 | 7,255 | 79.2% |
| 36 | Miami | 12,926.0 | 13,663 | -5.4% |
| 37 | Guymon | 12,539.0 | 10,904 | 15.0% |
| 38 | Choctaw | 12,303.0 | 10,782 | 14.1% |
| 39 | Weatherford | 12,004.0 | 10,515 | 14.2% |
| 40 | Woodward | 11,882.0 | 12,075 | -1.6% |
| 41 | Elk City | 11,361.0 | 11,567 | -1.8% |
| 42 | Okmulgee | 11,348.0 | 12,302 | -7.8% |
| 43 | Guthrie | 11,243.0 | 9,987 | 12.6% |
| 44 | Warr Acres | 10,466.0 | 9,984 | 4.8% |
| 45 | Coweta | 10,433.0 | 9,524 | 9.5% |
| 46 | Pryor Creek | 9,569.0 | 9,433 | 1.4% |
| 47 | The Village | 9,447.0 | 9,105 | 3.8% |
| 48 | Blanchard | 9,215.0 | 7,222 | 27.6% |
| 49 | Poteau | 8,959.0 | 8,419 | 6.4% |
| 50 | Collinsville | 8,878.0 | 5,516 | 60.9% |
| 51 | Sallisaw | 8,605.0 | 8,757 | -1.7% |
| 52 | Clinton | 8,388.0 | 8,876 | -5.5% |
| 53 | Cushing | 8,367.0 | 7,767 | 7.7% |
| 54 | Piedmont | 8,342.0 | 5,314 | 57.0% |
| 55 | Wagoner | 8,082.0 | 8,266 | -2.2% |
| 56 | Tuttle | 8,040.0 | 5,786 | 39.0% |
| 57 | Catoosa | 7,496.0 | 6,802 | 10.2% |
| 58 | Noble | 7,493.0 | 6,249 | 19.9% |
| 59 | Seminole | 7,194.0 | 7,335 | -1.9% |
| 60 | Grove | 7,176.0 | 6,427 | 11.7% |
| 61 | Idabel | 6,987.0 | 6,996 | -0.1% |
| 62 | Purcell | 6,803.0 | 5,805 | 17.2% |
| 63 | Harrah | 6,684.0 | 5,073 | 31.8% |
| 64 | Tecumseh | 6,332.0 | 6,391 | -0.9% |
| 65 | Pauls Valley | 6,062.0 | 6,174 | -1.8% |
| 66 | Blackwell | 6,042.0 | 7,131 | -15.3% |
| 67 | Holdenville | 5,902.0 | 5,490 | 7.5% |
| 68 | Verdigris | 5,637.0 | 3,811 | 47.9% |
| 69 | Henryetta | 5,608.0 | 5,966 | -6.0% |
| 70 | Anadarko | 5,572.0 | 6,647 | -16.2% |
| 71 | Vinita | 5,300.0 | 5,795 | -8.5% |
| 72 | Hugo | 5,182.0 | 5,352 | -3.2% |
| 73 | Lone Grove | 5,125.0 | 4,963 | 3.3% |
| 74 | Kingfisher | 5,026.0 | 4,558 | 10.3% |
| 75 | Alva | 4,982.0 | 4,855 | 2.6% |
| 76 | Hinton | 4,909.0 | 2,554 | 92.2% |
| 77 | Sulphur | 4,874.0 | 4,856 | 0.4% |
| 78 | Sayre | 4,796.0 | 4,377 | 9.6% |
| 79 | Perry | 4,452.0 | 5,130 | -13.2% |
| 80 | Marlow | 4,451.0 | 4,618 | -3.6% |
| 81 | Mcloud | 4,425.0 | 0 | nan% |
| 82 | Pocola | 4,423.0 | 4,027 | 9.8% |
| 83 | Bristow | 4,272.0 | 4,218 | 1.3% |
| 84 | Slaughterville | 4,251.0 | 4,036 | 5.3% |
| 85 | Broken Bow | 4,226.0 | 4,165 | 1.5% |
| 86 | Madill | 4,004.0 | 3,745 | 6.9% |
| 87 | Spencer | 3,928.0 | 3,852 | 2.0% |
| 88 | Nichols Hills | 3,843.0 | 3,745 | 2.6% |
| 89 | Fort Gibson | 3,808.0 | 4,097 | -7.1% |
| 90 | Stilwell | 3,755.0 | 3,874 | -3.1% |
| 91 | Roland | 3,687.0 | 3,151 | 17.0% |
| 92 | Elgin | 3,608.0 | 1,987 | 81.6% |
| 93 | Nowata | 3,542.0 | 3,819 | -7.3% |
| 94 | Frederick | 3,445.0 | 4,035 | -14.6% |
| 95 | Dewey | 3,412.0 | 3,411 | 0.0% |
| 96 | Hobart | 3,358.0 | 3,785 | -11.3% |
| 97 | Muldrow | 3,309.0 | 3,455 | -4.2% |
| 98 | Hominy | 3,303.0 | 3,644 | -9.4% |
| 99 | Mannford | 3,269.0 | 3,071 | 6.4% |
| 100 | Perkins | 3,262.0 | 2,761 | 18.1% |
| 101 | Park Hill | 3,237.0 | 3,382 | -4.3% |
| 102 | Cleveland | 3,225.0 | 3,282 | -1.7% |
| 103 | Bethel Acres | 3,165.0 | 2,866 | 10.4% |
| 104 | Wewoka | 3,091.0 | 3,443 | -10.2% |
| 105 | Goldsby | 3,085.0 | 2,191 | 40.8% |
| 106 | Tishomingo | 3,083.0 | 3,000 | 2.8% |
| 107 | Cache | 3,074.0 | 2,653 | 15.9% |
| 108 | Checotah | 3,064.0 | 3,335 | -8.1% |
| 109 | Okemah | 3,063.0 | 3,167 | -3.3% |
| 110 | Jones | 3,053.0 | 2,631 | 16.0% |
| 111 | Tonkawa | 3,014.0 | 3,219 | -6.4% |
| 112 | Heavener | 3,012.0 | 3,364 | -10.5% |
| 113 | Calera | 3,007.0 | 2,973 | 1.1% |
| 114 | Turley | 2,968.0 | 2,976 | -0.3% |
| 115 | Pawhuska | 2,930.0 | 3,630 | -19.3% |
| 116 | Chandler | 2,899.0 | 3,050 | -5.0% |
| 117 | Atoka | 2,894.0 | 3,113 | -7.0% |
| 118 | Lindsay | 2,884.0 | 2,838 | 1.6% |
| 119 | Marietta | 2,865.0 | 2,596 | 10.4% |
| 120 | Eufaula | 2,825.0 | 2,768 | 2.1% |
| 121 | Davis | 2,814.0 | 2,646 | 6.3% |
| 122 | Stroud | 2,793.0 | 2,705 | 3.3% |
| 123 | Mangum | 2,755.0 | 2,958 | -6.9% |
| 124 | New Cordell | 2,740.0 | 2,911 | -5.9% |
| 125 | Jay | 2,731.0 | 3,408 | -19.9% |
| 126 | Stigler | 2,729.0 | 2,726 | 0.1% |
| 127 | Longtown | 2,716.0 | 2,397 | 13.3% |
| 128 | Fairview | 2,687.0 | 2,588 | 3.8% |
| 129 | Kiefer | 2,639.0 | 1,379 | 91.4% |
| 130 | Watonga | 2,623.0 | 5,139 | -49.0% |
| 131 | Wilburton | 2,602.0 | 2,855 | -8.9% |
| 132 | Hennessey | 2,567.0 | 2,815 | -8.8% |
| 133 | Nicoma Park | 2,566.0 | 2,422 | 5.9% |
| 134 | Healdton | 2,495.0 | 2,776 | -10.1% |
| 135 | Texanna | 2,401.0 | 2,205 | 8.9% |
| 136 | Drumright | 2,361.0 | 3,061 | -22.9% |
| 137 | Antlers | 2,346.0 | 2,455 | -4.4% |
| 138 | Spiro | 2,269.0 | 2,470 | -8.1% |
| 139 | Commerce | 2,212.0 | 2,723 | -18.8% |
| 140 | Pink | 2,206.0 | 1,982 | 11.3% |
| 141 | Oakhurst | 2,175.0 | 2,452 | -11.3% |
| 142 | Prague | 2,155.0 | 2,703 | -20.3% |
| 143 | Chouteau | 2,129.0 | 2,268 | -6.1% |
| 144 | Krebs | 2,119.0 | 2,595 | -18.3% |
| 145 | Walters | 2,091.0 | 2,555 | -18.2% |
| 146 | Newkirk | 2,043.0 | 2,204 | -7.3% |
| 147 | Inola | 2,011.0 | 1,914 | 5.1% |
| 148 | Waurika | 2,004.0 | 2,131 | -6.0% |
| 149 | Arkoma | 1,976.0 | 2,339 | -15.5% |
| 150 | Lexington | 1,972.0 | 2,272 | -13.2% |
| 151 | Coalgate | 1,894.0 | 2,058 | -8.0% |
| 152 | Pawnee | 1,886.0 | 2,373 | -20.5% |
| 153 | Chelsea | 1,880.0 | 1,886 | -0.3% |
| 154 | Burns Flat | 1,857.0 | 2,556 | -27.3% |
| 155 | Hooker | 1,786.0 | 2,139 | -16.5% |
| 156 | Oologah | 1,774.0 | 1,094 | 62.2% |
| 157 | Wynnewood | 1,756.0 | 2,739 | -35.9% |
| 158 | Westville | 1,743.0 | 1,634 | 6.7% |
| 159 | Kingston | 1,742.0 | 2,123 | -17.9% |
| 160 | Wilson | 1,725.0 | 1,659 | 4.0% |
| 161 | Union City | 1,722.0 | 2,063 | -16.5% |
| 162 | Langston | 1,692.0 | 911 | 85.7% |
| 163 | Hollis | 1,664.0 | 2,033 | -18.2% |
| 164 | Granite | 1,650.0 | 2,207 | -25.2% |
| 165 | Hartshorne | 1,642.0 | 1,802 | -8.9% |
| 166 | Luther | 1,627.0 | 1,240 | 31.2% |
| 167 | Warner | 1,613.0 | 1,323 | 21.9% |
| 168 | Minco | 1,607.0 | 1,831 | -12.2% |
| 169 | Beaver | 1,586.0 | 1,575 | 0.7% |
| 170 | Helena | 1,557.0 | 1,607 | -3.1% |
| 171 | Morris | 1,555.0 | 1,151 | 35.1% |
| 172 | Mccord | 1,553.0 | 1,955 | -20.6% |
| 173 | Haskell | 1,549.0 | 1,885 | -17.8% |
| 174 | Comanche | 1,545.0 | 1,931 | -20.0% |
| 175 | Justice | 1,530.0 | 1,459 | 4.9% |
| 176 | Crescent | 1,527.0 | 1,504 | 1.5% |
| 177 | Carnegie | 1,521.0 | 1,786 | -14.8% |
| 178 | Cherokee | 1,509.0 | 1,494 | 1.0% |
| 179 | Central High | 1,489.0 | 1,026 | 45.1% |
| 180 | Cleora | 1,477.0 | 1,478 | -0.1% |
| 181 | Locust Grove | 1,453.0 | 1,554 | -6.5% |
| 182 | Vian | 1,435.0 | 1,785 | -19.6% |
| 183 | Panama | 1,415.0 | 1,518 | -6.8% |
| 184 | Copeland | 1,401.0 | 1,579 | -11.3% |
| 185 | Maysville | 1,399.0 | 1,047 | 33.6% |
| 186 | Stratford | 1,331.0 | 1,452 | -8.3% |
| 187 | Mooreland | 1,330.0 | 1,337 | -0.5% |
| 188 | Byng | 1,316.0 | 1,259 | 4.5% |
| 189 | Fletcher | 1,309.0 | 1,086 | 20.5% |
| 190 | Rush Springs | 1,299.0 | 1,600 | -18.8% |
| 191 | Snyder | 1,297.0 | 1,783 | -27.3% |
| 192 | Okarche | 1,293.0 | 1,098 | 17.8% |
| 193 | Bushyhead | 1,289.0 | 1,381 | -6.7% |
| 194 | West Siloam Springs | 1,286.0 | 910 | 41.3% |
| 195 | Kenwood | 1,284.0 | 901 | 42.5% |
| 196 | Colbert | 1,277.0 | 1,622 | -21.3% |
| 197 | Grandview | 1,251.0 | 408 | 206.6% |
| 198 | Wetumka | 1,234.0 | 979 | 26.0% |
| 199 | Dickson | 1,231.0 | 1,473 | -16.4% |
| 200 | Okeene | 1,212.0 | 1,337 | -9.3% |
| 201 | Shattuck | 1,212.0 | 1,232 | -1.6% |
| 202 | Boley | 1,209.0 | 1,163 | 4.0% |
| 203 | Fairland | 1,207.0 | 959 | 25.9% |
| 204 | Meeker | 1,172.0 | 1,237 | -5.3% |
| 205 | Thomas | 1,170.0 | 1,486 | -21.3% |
| 206 | Hydro | 1,157.0 | 1,059 | 9.3% |
| 207 | Geronimo | 1,155.0 | 1,506 | -23.3% |
| 208 | Salina | 1,148.0 | 1,505 | -23.7% |
| 209 | Cashion | 1,148.0 | 722 | 59.0% |
| 210 | Oakland | 1,142.0 | 834 | 36.9% |
| 211 | North Enid | 1,136.0 | 1,192 | -4.7% |
| 212 | Briggs | 1,131.0 | 210 | 438.6% |
| 213 | Boise City | 1,125.0 | 1,322 | -14.9% |
| 214 | Goodwell | 1,122.0 | 1,210 | -7.3% |
| 215 | Gore | 1,114.0 | 937 | 18.9% |
| 216 | Caddo | 1,109.0 | 1,307 | -15.1% |
| 217 | Wister | 1,105.0 | 1,024 | 7.9% |
| 218 | Buffalo | 1,092.0 | 1,230 | -11.2% |
| 219 | Tyrone | 1,082.0 | 573 | 88.8% |
| 220 | Waukomis | 1,076.0 | 1,168 | -7.9% |
| 221 | Fairfax | 1,076.0 | 1,710 | -37.1% |
| 222 | Konawa | 1,076.0 | 1,740 | -38.2% |
| 223 | Sperry | 1,066.0 | 1,136 | -6.2% |
| 224 | Mounds | 1,059.0 | 1,468 | -27.9% |
| 225 | Temple | 1,050.0 | 1,179 | -10.9% |
| 226 | Woodall | 1,050.0 | 918 | 14.4% |
| 227 | Kellyville | 1,047.0 | 1,386 | -24.5% |
| 228 | Dibble | 1,045.0 | 1,793 | -41.7% |
| 229 | Apache | 1,034.0 | 1,517 | -31.8% |
| 230 | Beggs | 1,024.0 | 1,379 | -25.7% |
| 231 | Medford | 1,016.0 | 1,056 | -3.8% |