Most Asian cities in Illinois research summary. We analyzed Illinois’s most recent Census data to determine the most Asian cities in Illinois based on the percentage of Asian residents.

32.7% Asian · #1 most Asian in Illinois
Oak Brook is an affluent village in DuPage County with a small portion in Cook County in Illinois. The population was 7,883 at the 2010 census. A suburb of Chicago, Oak Brook serves as home to the headquarters of several notable companies and organizations including McDonald’s, Ace Hardware, Blistex, Federal Signal, CenterPoint Properties, Sanford L.P., TreeHouse Foods, and Lions Clubs International.
Data | Crime | Cost of living | Movers
32.0% Asian · #2 most Asian in Illinois
Morton Grove is a village in Cook County, Illinois, United States. As of the 2010 census, the population was 23,270, for a growth rate of 3.6% since 2000.
Data | Crime | Cost of living | Movers
29.7% Asian · #3 most Asian in Illinois
Buffalo Grove is a village in Lake and Cook counties in the U.S. state of Illinois, within the northwest suburbs of Chicago.
As of the 2010 census, the village population was 41,496. Most of the village is located within the 10th Congressional District of Illinois, although the southern portion is represented in the 8th Congressional District.
Data | Crime | Cost of living | Movers
27.3% Asian · #4 most Asian in Illinois
Lincolnwood is a village in Cook County, Illinois, United States. The population was 12,590 at the 2010 census.
Data | Crime | Cost of living | Movers
25.5% Asian · #5 most Asian in Illinois
Glendale Heights is a village in DuPage County, Illinois, United States. The population was 34,208 at the 2010 census. It is best known nationally as the hometown of Smashing Pumpkins founder Billy Corgan, but known more locally for its ethnically diverse population. The town elected Dupage County’s first Asian mayor in 1995.
Data | Crime | Cost of living | Movers
25.4% Asian · #6 most Asian in Illinois
Skokie is a village in Cook County, Illinois, United States. Its name comes from a Potawatomi word for “marsh.” A Chicago suburb, for many years Skokie promoted itself as “The World’s Largest Village.” Its population, according to the 2010 census, was 64,784. Skokie’s streets, like that of many suburbs, are largely a continuation of the Chicago street grid, and the village is served by the Chicago Transit Authority, further cementing its connection to the city.
Data | Crime | Cost of living | Movers
25.1% Asian · #7 most Asian in Illinois
Hoffman Estates is a village in Illinois, United States. The village is located primarily in Cook County with a small section in Kane County. It is a suburb of Chicago. As of the 2010 census, the village population was 51,895. The village was incorporated in 1959.
Data | Crime | Cost of living | Movers
24.6% Asian · #8 most Asian in Illinois
Vernon Hills is a village in Lake County, Illinois, United States, and a northern suburb of Chicago. The population was 20,120 at the 2000 census, and 25,113 in 2010. Vernon Hills serves as a retail hub for its surrounding area.
Data | Crime | Cost of living | Movers
24.0% Asian · #9 most Asian in Illinois
Lincolnshire is a village in Vernon Township, Lake County, in the U.S. state of Illinois. The village is a northern suburb of Chicago. The population of Lincolnshire was 7,275 at the 2010 census. Lincolnshire was incorporated on August 5, 1957, from the unincorporated Half Day area when land was purchased to build a residential subdivision. The community underwent an aggressive era of expansion from 1983 to the 1990s. The Des Plaines River bisects the village, passing from north to south; Illinois Route 22 also divides the village into two parts, crossing the village from east to west.
Data | Crime | Cost of living | Movers
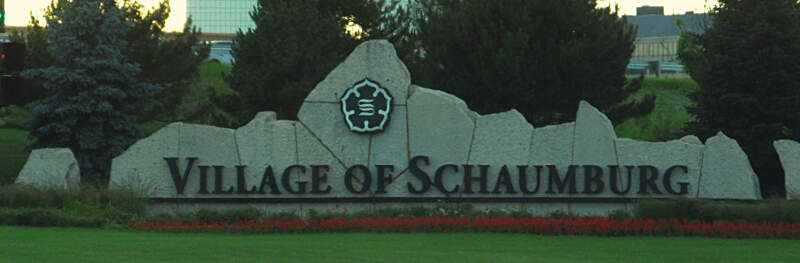
23.8% Asian · #10 most Asian in Illinois
Schaumburg is a village located in Cook County and DuPage County in northeastern Illinois, United States. The village is a northwestern suburb of Chicago and is part of the Golden Corridor. Schaumburg is located roughly 28 miles northwest of the Chicago Loop and approximately 10 miles northwest of O’Hare International Airport. As of the 2010 census, the village had a total population of 74,227.
Data | Crime | Cost of living | Movers
The receipts
Compare the top ten
Pick a metric. The bars rescale. The red line is Illinois’s statewide median.
On the map
Where Illinois’s Asian communities live
Saturday Night Science
Methodology: How We Determined The Cities In Illinois With The Largest Asian Population For 2026
We used Saturday Night Science to compare Census data on race across every place in Illinois.
The Census’s most recently available data comes from the 2020-2024 American Community Survey.
Specifically, we looked at table B03002: Hispanic OR LATINO ORIGIN BY RACE. Here are the category names as defined by the Census:
- Hispanic or Latino
- White alone*
- Black or African American alone*
- American Indian and Alaska Native alone*
- Asian alone*
- Native Hawaiian and Other Pacific Islander alone*
- Some other race alone*
- Two or more races*
Our particular column of interest here was the number of people who identified as Asian alone.
We limited our analysis to cities with a population greater than 5,000 people. That left us with 324 cities.
We then calculated the percentage of residents that are Asian. The percentages ranked from 32.7% to 0.0%.
Finally, we ranked each city based on the percentage of Asian population, with a higher percentage being more Asian. Oak Brook took the distinction of being the most Asian, while Du Quoin was the least Asian city.
We updated this article for 2026. This report reflects our eleventh time ranking the cities in Illinois with the largest Asian population.
The full plate
Cities In Illinois By Asian Population
Click any column to sort. Search by city name.
| Rank | City | Population | Asian Population | % Asian |
|---|---|---|---|---|
| 1 | Oak Brook | 8,056 | 2,637 | 32.7% |
| 2 | Morton Grove | 24,619 | 7,870 | 32.0% |
| 3 | Buffalo Grove | 42,891 | 12,755 | 29.7% |
| 4 | Lincolnwood | 13,112 | 3,582 | 27.3% |
| 5 | Glendale Heights | 32,808 | 8,378 | 25.5% |
| 6 | Skokie | 66,219 | 16,816 | 25.4% |
| 7 | Hoffman Estates | 51,175 | 12,856 | 25.1% |
| 8 | Vernon Hills | 26,876 | 6,618 | 24.6% |
| 9 | Lincolnshire | 7,980 | 1,915 | 24.0% |
| 10 | Schaumburg | 76,868 | 18,318 | 23.8% |
| 11 | Naperville | 150,692 | 33,649 | 22.3% |
| 12 | Niles | 30,064 | 6,111 | 20.3% |
| 13 | Savoy | 8,968 | 1,819 | 20.3% |
| 14 | Inverness | 7,275 | 1,458 | 20.0% |
| 15 | Bartlett | 40,501 | 7,979 | 19.7% |
| 16 | Carol Stream | 39,460 | 7,618 | 19.3% |
| 17 | Willowbrook | 9,131 | 1,729 | 18.9% |
| 18 | Hanover Park | 36,732 | 6,780 | 18.5% |
| 19 | Lisle | 23,407 | 4,081 | 17.4% |
| 20 | Glenview | 47,752 | 7,737 | 16.2% |
| 21 | Northbrook | 34,585 | 5,594 | 16.2% |
| 22 | Hawthorn Woods | 9,143 | 1,459 | 16.0% |
| 23 | Champaign | 89,996 | 14,204 | 15.8% |
| 24 | Mount Prospect | 55,472 | 8,554 | 15.4% |
| 25 | Wheeling | 38,433 | 5,895 | 15.3% |
| 26 | Des Plaines | 59,156 | 8,797 | 14.9% |
| 27 | Westmont | 23,724 | 3,466 | 14.6% |
| 28 | Burr Ridge | 11,141 | 1,615 | 14.5% |
| 29 | Streamwood | 39,001 | 5,640 | 14.5% |
| 30 | Bloomingdale | 22,457 | 3,236 | 14.4% |
| 31 | Rolling Meadows | 24,027 | 3,431 | 14.3% |
| 32 | Urbana | 39,341 | 5,588 | 14.2% |
| 33 | Bolingbrook | 74,096 | 10,475 | 14.1% |
| 34 | Hinsdale | 17,175 | 2,361 | 13.7% |
| 35 | Itasca | 9,355 | 1,247 | 13.3% |
| 36 | Gurnee | 30,510 | 3,930 | 12.9% |
| 37 | Palatine | 66,293 | 8,318 | 12.5% |
| 38 | Long Grove | 8,305 | 1,024 | 12.3% |
| 39 | Wilmette | 27,503 | 3,376 | 12.3% |
| 40 | Aurora | 179,898 | 21,890 | 12.2% |
| 41 | Woodridge | 33,941 | 4,099 | 12.1% |
| 42 | Round Lake | 18,628 | 2,247 | 12.1% |
| 43 | Elk Grove Village | 31,987 | 3,845 | 12.0% |
| 44 | Darien | 21,879 | 2,603 | 11.9% |
| 45 | Lakemoor | 6,467 | 709 | 11.0% |
| 46 | Glen Ellyn | 28,390 | 3,094 | 10.9% |
| 47 | South Elgin | 24,217 | 2,633 | 10.9% |
| 48 | Lombard | 43,619 | 4,659 | 10.7% |
| 49 | Plainfield | 46,708 | 4,903 | 10.5% |
| 50 | Arlington Heights | 76,005 | 7,920 | 10.4% |
| 51 | West Chicago | 25,395 | 2,628 | 10.3% |
| 52 | Harwood Heights | 8,821 | 912 | 10.3% |
| 53 | Mundelein | 31,915 | 3,228 | 10.1% |
| 54 | Clarendon Hills | 8,659 | 848 | 9.8% |
| 55 | Evanston | 76,340 | 7,173 | 9.4% |
| 56 | Roselle | 22,752 | 2,105 | 9.3% |
| 57 | Lindenhurst | 14,417 | 1,291 | 9.0% |
| 58 | Prospect Heights | 15,618 | 1,397 | 8.9% |
| 59 | Forest Park | 13,943 | 1,225 | 8.8% |
| 60 | Addison | 35,489 | 3,059 | 8.6% |
| 61 | Lake Zurich | 19,832 | 1,660 | 8.4% |
| 62 | Bloomington | 78,907 | 6,543 | 8.3% |
| 63 | Northfield | 5,487 | 445 | 8.1% |
| 64 | Barrington | 11,077 | 878 | 7.9% |
| 65 | Elmhurst | 45,671 | 3,546 | 7.8% |
| 66 | Lake Villa | 8,683 | 672 | 7.7% |
| 67 | Carbondale | 22,158 | 1,621 | 7.3% |
| 68 | Chicago | 2,711,226 | 196,435 | 7.2% |
| 69 | Beach Park | 14,115 | 1,013 | 7.2% |
| 70 | Lake in the Hills | 28,800 | 2,064 | 7.2% |
| 71 | Hampshire | 8,524 | 604 | 7.1% |
| 72 | Peoria | 112,169 | 7,398 | 6.6% |
| 73 | Elgin | 114,934 | 7,570 | 6.6% |
| 74 | Gilberts | 8,606 | 562 | 6.5% |
| 75 | Warrenville | 14,718 | 959 | 6.5% |
| 76 | Lake Bluff | 6,041 | 393 | 6.5% |
| 77 | Lake Forest | 19,416 | 1,248 | 6.4% |
| 78 | Park City | 7,827 | 495 | 6.3% |
| 79 | Park Ridge | 38,667 | 2,443 | 6.3% |
| 80 | Orland Park | 57,916 | 3,593 | 6.2% |
| 81 | Romeoville | 41,152 | 2,529 | 6.1% |
| 82 | North Chicago | 30,643 | 1,856 | 6.1% |
| 83 | West Dundee | 7,906 | 461 | 5.8% |
| 84 | Oak Forest | 26,805 | 1,561 | 5.8% |
| 85 | Wheaton | 53,557 | 3,094 | 5.8% |
| 86 | Mahomet | 10,049 | 579 | 5.8% |
| 87 | Deerfield | 19,518 | 1,102 | 5.6% |
| 88 | Downers Grove | 50,054 | 2,819 | 5.6% |
| 89 | Norridge | 15,439 | 859 | 5.6% |
| 90 | River Forest | 11,992 | 659 | 5.5% |
| 91 | Waukegan | 89,076 | 4,836 | 5.4% |
| 92 | Countryside | 6,267 | 340 | 5.4% |
| 93 | Hickory Hills | 14,526 | 786 | 5.4% |
| 94 | Algonquin | 30,067 | 1,581 | 5.3% |
| 95 | Wauconda | 14,027 | 722 | 5.1% |
| 96 | Justice | 12,324 | 632 | 5.1% |
| 97 | Wood Dale | 13,933 | 712 | 5.1% |
| 98 | Oak Park | 53,292 | 2,719 | 5.1% |
| 99 | Winfield | 10,095 | 513 | 5.1% |
| 100 | Grayslake | 20,929 | 1,063 | 5.1% |
Source: U.S. Census ACS 2020-2024. 324 cities with more than 5,000 residents.
Summary
Summary: Asian Populations Across Illinois
If you’re looking for a breakdown of Asian populations across Illinois according to the most recent data, this is an accurate list.
The most Asian cities in Illinois are Oak Brook, Morton Grove, Buffalo Grove, Lincolnwood, Glendale Heights, Skokie, Hoffman Estates, Vernon Hills, Lincolnshire, and Schaumburg.