Today, we’ll report on the most Hispanic states in America. Using the latest data on race by origin, we identified the states with the highest percentage of Hispanic/Latino residents in the United States.
The United States is known for its vast cultural diversity; several states have a large Hispanic/Latino population. These states have grown for various reasons, including immigration, long-standing communities, and proximity to the southern border.
We also looked at the total Hispanic population in each state, giving us a well-rounded approach to the data. Put differently, a state’s Hispanic identity is measured both by share and by sheer numbers.
The state with the highest percentage of Hispanic/Latino Americans is New Mexico. 48.4% of people in New Mexico are Hispanic. The state with the lowest percentage of Hispanic/Latino Americans is West Virginia. 2.1% of people in West Virginia are Hispanic.
The state with the most Hispanic/Latino Americans is California. 15,778,963 people in California are Hispanic. The state with the fewest Hispanic/Latino Americans is Vermont. 16,545 people in Vermont are Hispanic. The United States has 64,678,218 Hispanic Americans and is 19.4% Hispanic.
The states we’re about to mention are pretty Hispanic overall. We ended up with this list of the ten most Hispanic states.
On the map
The most Hispanic states in America, mapped
Source: HomeSnacks
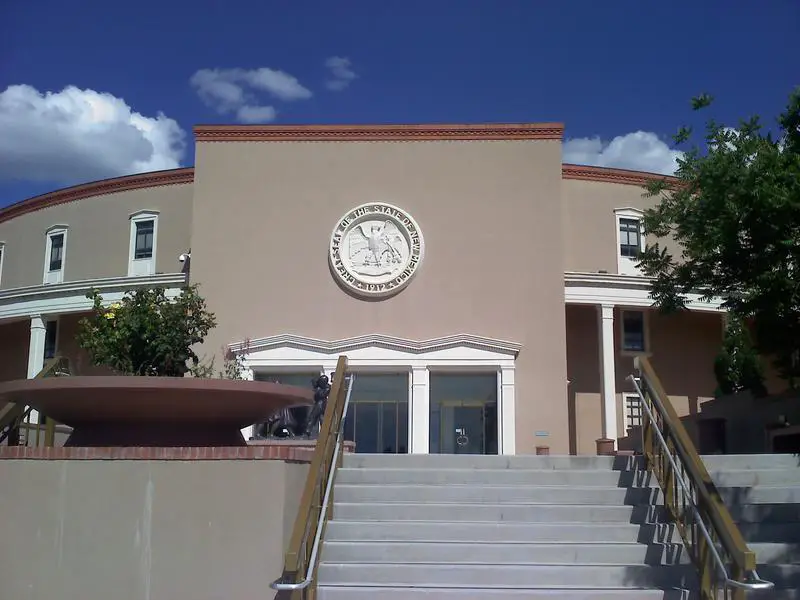
Where’s the most Hispanic state in the US for 2026? It’s New Mexico. New Mexico is 48.4% hispanic, which is a 12.33% increase since 2010. Albuquerque is 50% Hispanic. Every city with a population of over 5,000 residents is at least a quarter Hispanic here.
While California has by far the highest number of Hispanics in America, New Mexico has the nation’s largest percentage of Hispanic residents relative to its state’s total population. Nearly 1 in 3 residents of New Mexico speak Spanish at home.
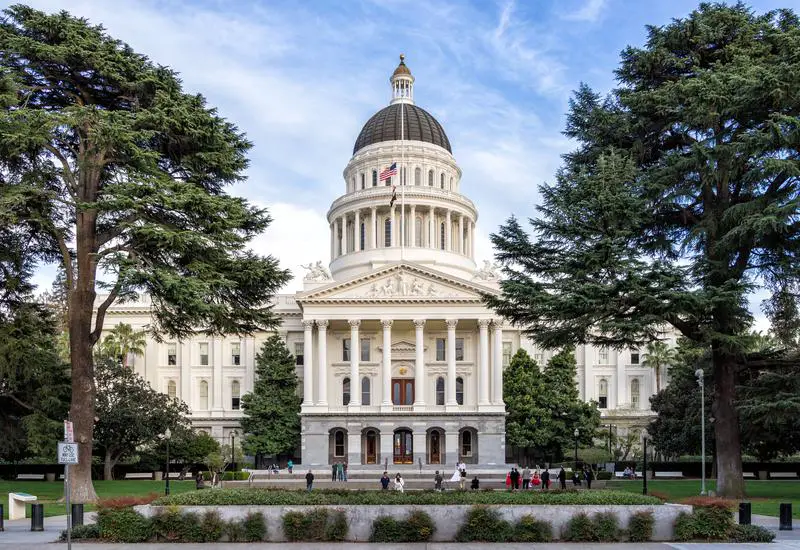
California is 40.2% hispanic. There are 14 cities in California with Hispanic populations greater than 95%, and five where the population is effectively 99% Hispanic. A large number of Hispanic residents in California live along the US-Mexico border, in Southern California in general, and along the central Valley, a 500-mile long agriculture-rich region stretching from Bakersfield to Redding.
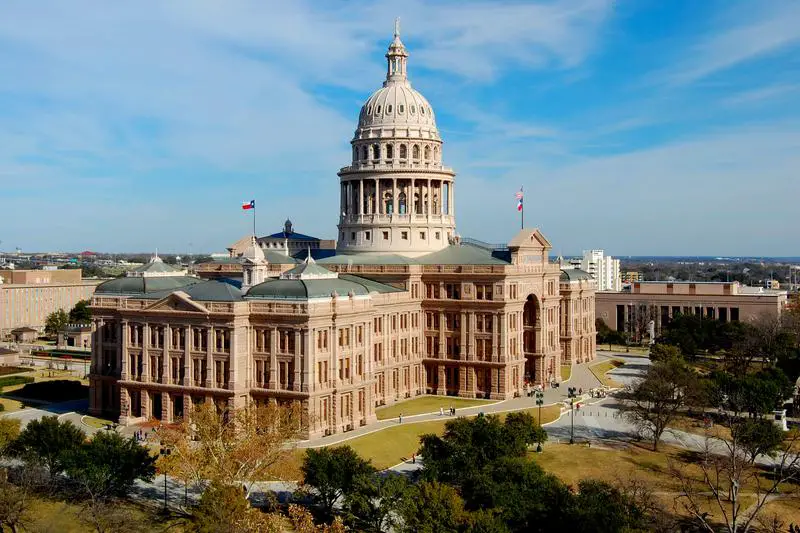
The state of Texas is 39.7% Hispanic, which is 34.47% more Hispanic than it was in 2010. There are six cities along the Texas/Mexico border where the Hispanic population is effectively 100%, including Hidalgo, Texas. Houston is 44% hispanic, Dallas is 42% hispanic, and El Paso is 80% hispanic. According to the census, in Texas, Hispanics accounted for nearly half of all births.
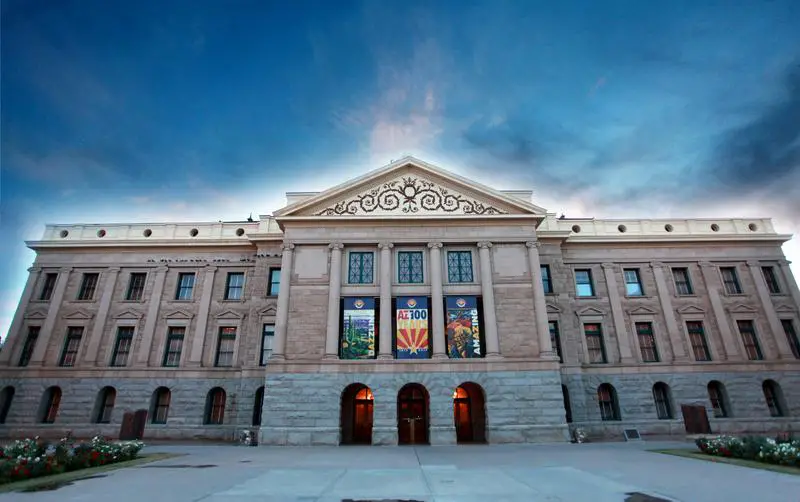
Arizona’s Hispanic population is 31.4%, which is a 27.51% increase since 2010. The most hispanic cities in Arizona include Somerton, San Luis, and Nogales which all have hispanic populations over 96%. Phoenix has a 43% hispanic population.
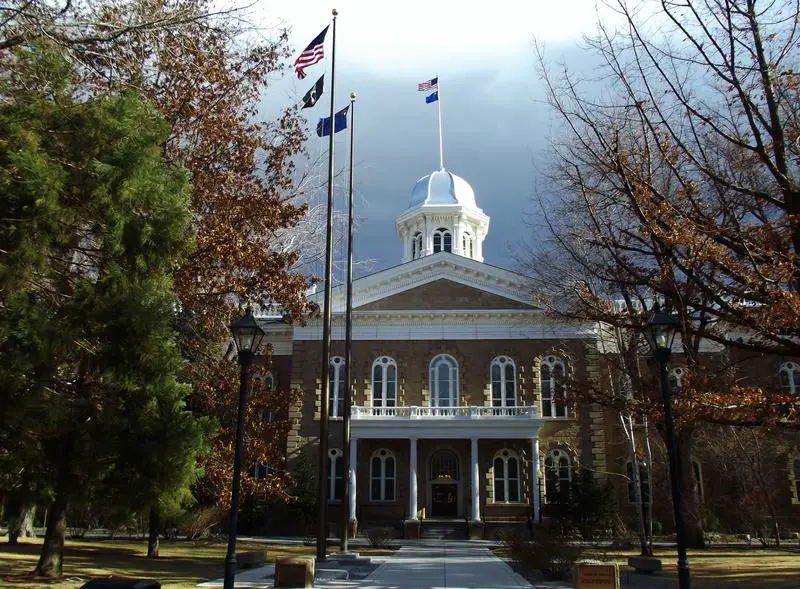
Moving on, we come to our fifth most Hispanic state in America, Nevada. In Nevada, the Hispanic population is nearly 4% higher than in Florida, at 29.6%. North Las Vegas is the most Hispanic city in Nevada, at 40%. In Las Vegas, 1 in 3 residents is Hispanic. Nevada’s Hispanic population has increased 40.02% since 2010.
According to the Nevada Bureau of Labor Statistics, most of Nevada jobs are in the greater Las Vegas region due to the city’s tourism industry. Hispanics occupy 22% of jobs in the tourism industry. Hispanics occupy 27% of all construction industry jobs, the largest percentage of all job categories. Hispanics occupy 23% of all agriculture jobs.
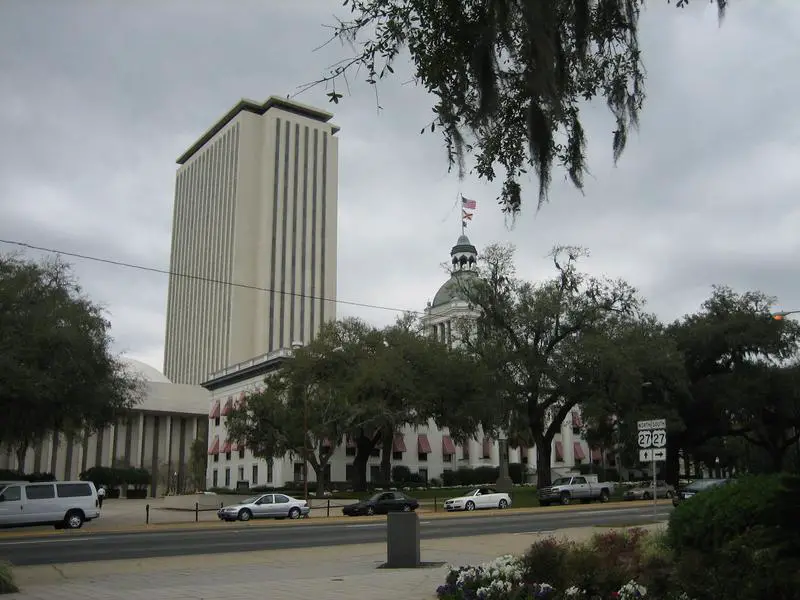
Our sixth most Hispanic state in America is Florida. In Florida, 27.4% of the population – or 1 in 4 residents, is Hispanic and growing. Florida is 53.83% more Hispanic than in 2010, making it the fastest-growing Hispanic state in the US. There are four cities in Miami Dade County with 90% or more Hispanic populations. Miami is 72% Hispanic.
In New York City, the majority of the Hispanic population is Puerto Rican, but that only comprises 10 percent of New York City’s total population. In Miami, 54% of the city is Cuban. About 13 percent of Miami-Dade’s Latinos are from Puerto Rico, the Dominican Republic, and Mexico, and 32 percent are from other Central and South American countries such as Guatemala, Colombia, El Salvador, Venezuela, Nicaragua, Honduras, and Brazil.
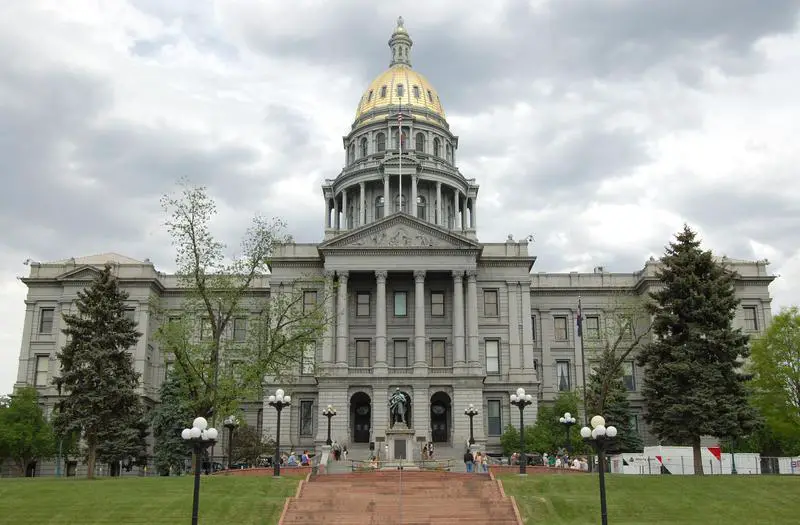
Our next most Hispanic state in America is Colorado. In Colorado, 22.5% of the population is Hispanic. Colorado is 34.33% more Hispanic as a state than it was in 2010.
North Denver suburb Federal Heights is the most Hispanic city in the state at 60%. Pueblo is 52% hispanic. 1 in 3 residents in Denver, Colorado’s largest city, is Hispanic. 40% of Colorado’s population under 25 isn’t white. According to an article in the Denver Post, the Hispanic population is changing Colorado’s entire culture and economy.
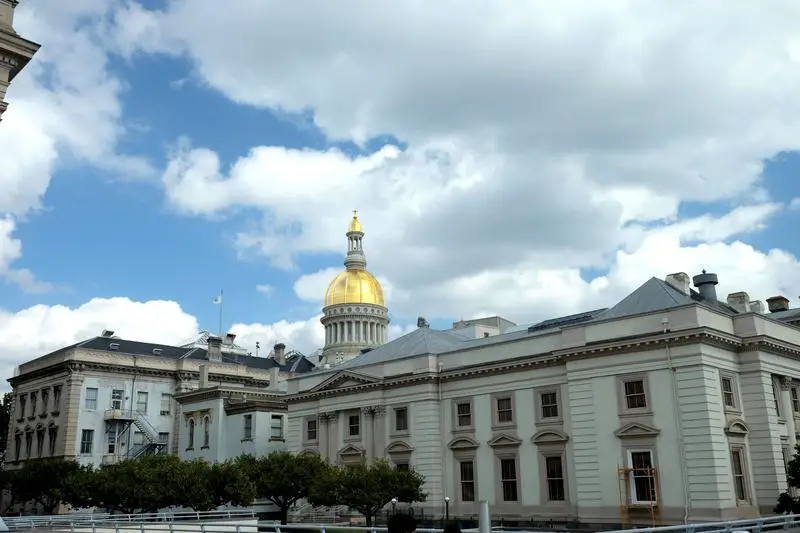
In New Jersey, 22.5%, or 1 in 5 residents, is Hispanic. New Jersey is 42.96% more Hispanic than in 2010, the second biggest gain of any other state on this list.
The city of Perth Amboy, about 20 miles south of Newark, has the most Hispanics in New Jersey, at 82%. Union City, just across the Lincoln Tunnel from Manhattan, is 80% Hispanic. Camden is 49% Hispanic, and Newark is 37% Hispanic.
The northern part of Hudson County is nicknamed “Havana on the Hudson” for the large number of Cuban exiles and émigrés living there. Paterson, which is 60% hispanic, is home to Little Lima, a Peruvian enclave in Downtown. Paterson is considered by many to be the capital of Peru outside of… Peru. There are also a large number of Bolivians in Paterson.
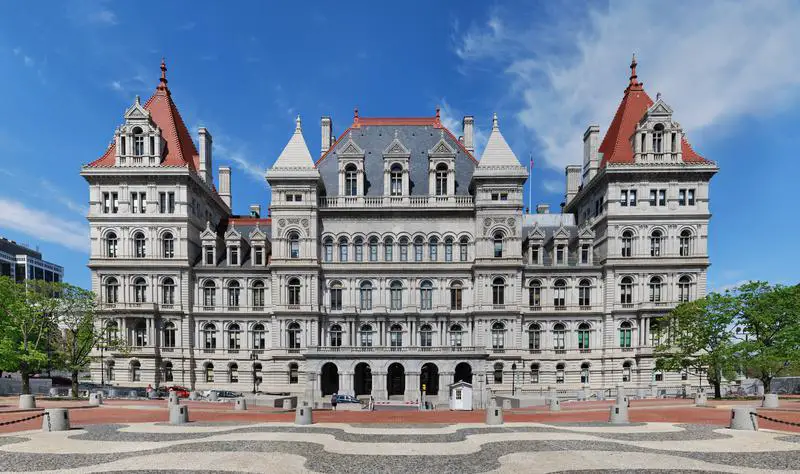
Moving on, we come to our next most Hispanic state in America, New York. In New York, there are 3,936,085 Hispanics, making up 19.8% of the New York population. New York state is 19.68% more Hispanic since 2010.
Haverstraw, a town 45 miles north of New York City, is the state’s most Hispanic, with a Hispanic population of 69%. New York City is 28% Hispanic.
In New York, in particular, Puerto Ricans and Dominicans make up a large percentage of the Hispanic population. The Puerto Rican population of New York City is the largest outside Puerto Rico. The Hispanic breakdown of New York City is 9.4% Puerto Rican, 3.6% Mexican, .5% Cuban, and all other Hispanic groups make up 14.0%.
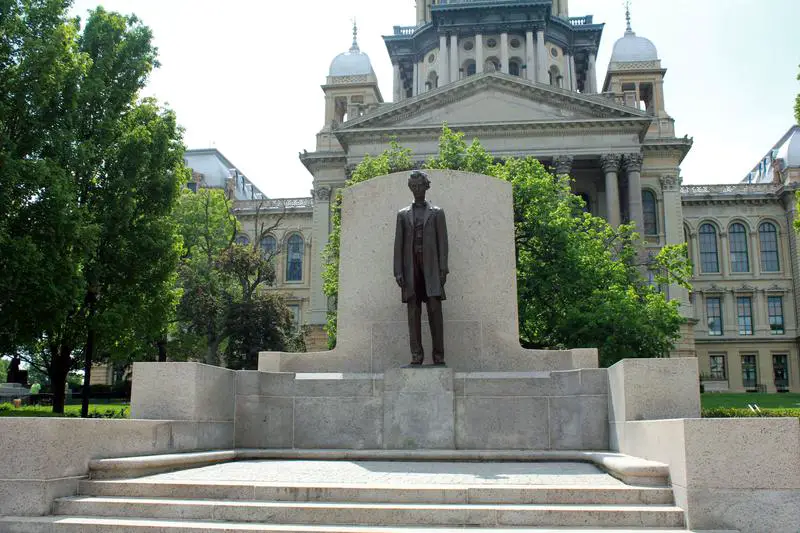
Here in Illinois, the Hispanic population is 18.8%, or one in every 6 Illinois residents. This statistic represents a 23.05% increase in the last ten years. For perspective, the least Hispanic state is West Virginia, where the Hispanic population is 1.4%. That means there are 12 times as many Hispanics in Illinois as in West Virginia.
Cicero, a west Chicago suburb of 83,000 residents, is 89% Hispanic – the largest Hispanic population in Illinois.
The verdict
So what’s the most Hispanic state in America for 2026?
What’s the most Hispanic state in America for 2026? It turns out New Mexico is the most Hispanic state in the country. We can’t measure culture, language, or community, but we can calculate what percentage of people are Hispanic. And in that category, New Mexico takes the cake.
Read below to see how we crunched the numbers and how your state ranked. Or check out more on the most diverse cities in America.
Saturday Night Science
How We Determined The Most Hispanic States In The US For 2026
The first thing that comes to most people’s minds when they think about determining the most Hispanic states is simply the share of residents who are Hispanic or Latino.
So we used Saturday Night Science to compare the percentage of Hispanic/Latino residents in each state from the newly released 2020-2024 American Community Survey, which breaks down race by origin:
- Percent Hispanic
We ranked each state from 1 to 50 based on the percentage of Hispanic/Latino residents, with one being the most Hispanic. We crowned the state with the highest share the ‘Most Hispanic State In The US For 2026.’ We updated this article for 2026. This list is our eleventh time ranking the most Hispanic states in the United States.
If you’d like to see the complete list of states, from most to least Hispanic, scroll to the bottom of this post to see the unabridged chart.
The full plate
All 50 states, ranked by Hispanic population
Click any column to sort. Search by state name.
| Rank | State | Population | Hispanic Population | % Hispanic |
|---|---|---|---|---|
| 1 | New Mexico | 2,120,246 | 1,026,614 | 48.4% |
| 2 | California | 39,287,377 | 15,778,963 | 40.2% |
| 3 | Texas | 30,188,424 | 11,991,467 | 39.7% |
| 4 | Arizona | 7,378,838 | 2,313,806 | 31.4% |
| 5 | Nevada | 3,184,612 | 943,569 | 29.6% |
| 6 | Florida | 22,416,077 | 6,146,161 | 27.4% |
| 7 | Colorado | 5,862,189 | 1,320,937 | 22.5% |
| 8 | New Jersey | 9,343,809 | 2,098,960 | 22.5% |
| 9 | New York | 19,852,366 | 3,936,085 | 19.8% |
| 10 | Illinois | 12,694,798 | 2,387,049 | 18.8% |
| 11 | Connecticut | 3,624,508 | 662,511 | 18.3% |
| 12 | Rhode Island | 1,101,801 | 194,915 | 17.7% |
| 13 | Utah | 3,392,331 | 539,620 | 15.9% |
| 14 | Oregon | 4,254,293 | 624,598 | 14.7% |
| 15 | Washington | 7,816,116 | 1,123,614 | 14.4% |
| 16 | Idaho | 1,934,262 | 263,935 | 13.6% |
| 17 | Kansas | 2,947,197 | 400,018 | 13.6% |
| 18 | Massachusetts | 7,044,056 | 936,853 | 13.3% |
| 19 | Nebraska | 1,978,707 | 252,023 | 12.7% |
| 20 | Oklahoma | 4,028,634 | 510,804 | 12.7% |
| 21 | Maryland | 6,206,011 | 774,946 | 12.5% |
| 22 | North Carolina | 10,730,404 | 1,213,850 | 11.3% |
| 23 | Delaware | 1,021,191 | 112,835 | 11.0% |
| 24 | Virginia | 8,705,170 | 959,089 | 11.0% |
| 25 | Georgia | 10,940,407 | 1,204,616 | 11.0% |
| 26 | Wyoming | 582,397 | 62,047 | 10.7% |
| 27 | Hawaii | 1,445,235 | 143,591 | 9.9% |
| 28 | Arkansas | 3,049,391 | 275,571 | 9.0% |
| 29 | Pennsylvania | 13,018,639 | 1,135,281 | 8.7% |
| 30 | Indiana | 6,851,073 | 590,348 | 8.6% |
| 31 | Wisconsin | 5,914,872 | 471,930 | 8.0% |
| 32 | Tennessee | 7,066,383 | 523,528 | 7.4% |
| 33 | South Carolina | 5,296,225 | 390,376 | 7.4% |
| 34 | Alaska | 735,706 | 53,803 | 7.3% |
| 35 | Iowa | 3,210,507 | 233,706 | 7.3% |
| 36 | Louisiana | 4,611,961 | 332,716 | 7.2% |
| 37 | Minnesota | 5,739,445 | 365,831 | 6.4% |
| 38 | Michigan | 10,077,761 | 592,045 | 5.9% |
| 39 | Alabama | 5,086,768 | 284,135 | 5.6% |
| 40 | Missouri | 6,191,814 | 324,379 | 5.2% |
| 41 | Kentucky | 4,534,824 | 226,744 | 5.0% |
| 42 | South Dakota | 907,428 | 43,777 | 4.8% |
| 43 | Ohio | 11,810,293 | 562,740 | 4.8% |
| 44 | New Hampshire | 1,394,868 | 65,383 | 4.7% |
| 45 | North Dakota | 784,841 | 36,575 | 4.7% |
| 46 | Montana | 1,116,875 | 50,932 | 4.6% |
| 47 | Mississippi | 2,946,779 | 109,956 | 3.7% |
| 48 | Vermont | 647,106 | 16,545 | 2.6% |
| 49 | Maine | 1,387,817 | 30,266 | 2.2% |
| 50 | West Virginia | 1,778,373 | 38,175 | 2.1% |
Source: U.S. Census ACS 2020-2024.
There You Have It — The Most Hispanic States In The Country
After measuring the Hispanic/Latino share of every state, the most Hispanic states are concentrated in the Southwest and along the southern border. If you live in one of the states mentioned above, you’re part of one of the fastest-growing communities in the country.
The most Hispanic states in the United States for 2026 are New Mexico, California, Texas, Arizona, Nevada, Florida, Colorado, New Jersey, New York, and Illinois.
The least Hispanic states in the United States are West Virginia, Maine, Vermont, Mississippi, Montana, North Dakota, New Hampshire, Ohio, South Dakota, and Kentucky.
Questions and answers
Most Hispanic States FAQs
What is the most Hispanic state in America?
New Mexico is the most Hispanic state in America for 2026, with Hispanic and Latino residents making up 48.4% of the population. California and Texas are next.
What are the top 10 Hispanic states in the US?
The states with the largest Hispanic population shares are New Mexico, California, Texas, Arizona, Nevada, Florida, Colorado, New Jersey, New York, and Illinois. We ranked all 50 states by the percentage of residents who are Hispanic or Latino.
What state has the most Hispanic residents overall?
California has the most Hispanic residents outright, with 15,778,963 people. That is the raw count; New Mexico leads on share of population.
What is the least Hispanic state?
West Virginia has the smallest Hispanic population share in the country, at 2.1%. It sits at the opposite end of the same ranking.
How many Hispanic residents live in the United States?
Across all 50 states there are 64,678,218 Hispanic and Latino residents, which works out to 19.4% of the population. The numbers come from the Census Bureau’s American Community Survey.