100 Biggest Cities In Kentucky For 2026
Using the latest Census data, we detail the 100 biggest cities in Kentucky. You can all see a comprehensive list of all 238 cities and places in Kentucky.

We all love the biggest cities that the Bluegrass State has to offer. You know the places like Louisville/Jefferson County Metro Government (Balance) and Lexington-Fayette Urban County which make all the headlines.
But there are a bunch of other great large cities in Kentucky that don't get as much love.
We're going to change that right now.
Using the most recent Census data, we can tell you about all the places in Kentucky with a focus on the biggest. We update the data each year and this is our fourth time doing this.
Table Of Contents: Top Ten | Methodology | Table
The Largest Cities In Kentucky For 2026:
- Louisville/Jefferson County metro government (balance)
- Lexington-Fayette urban county
- Bowling Green
- Owensboro
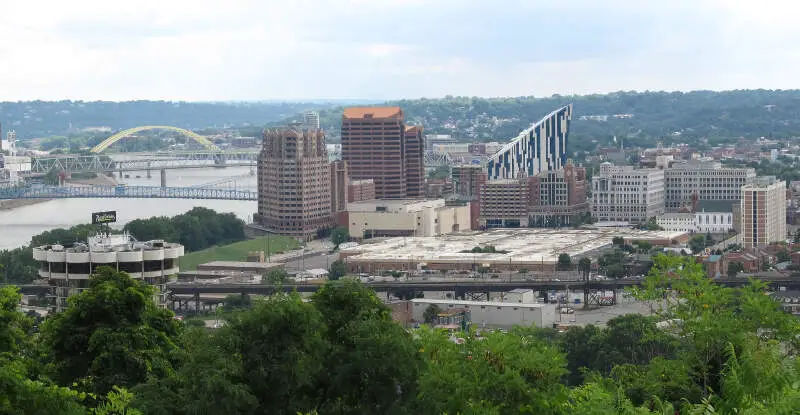
- Covington
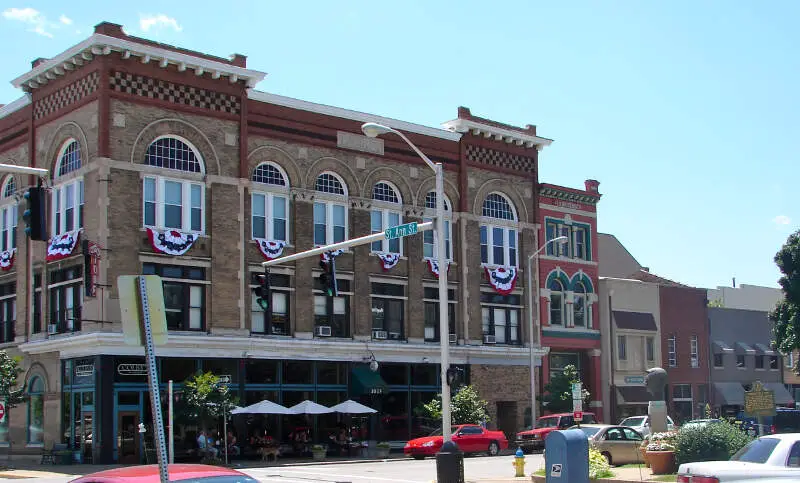
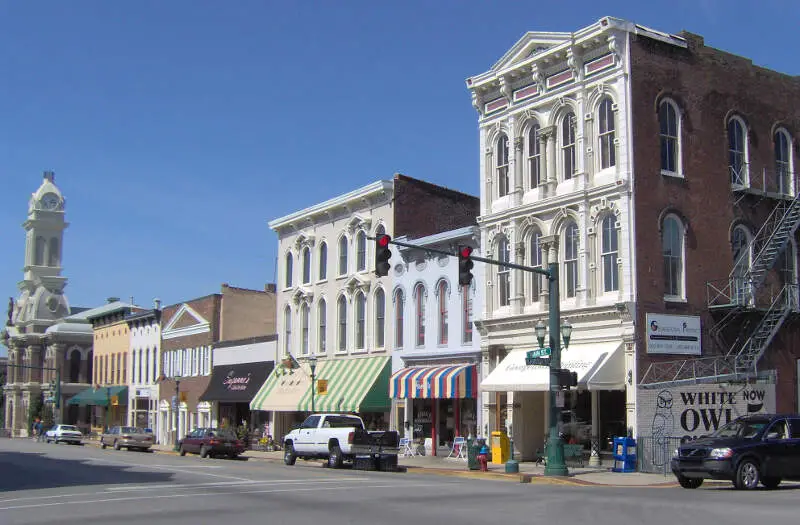
- Georgetown
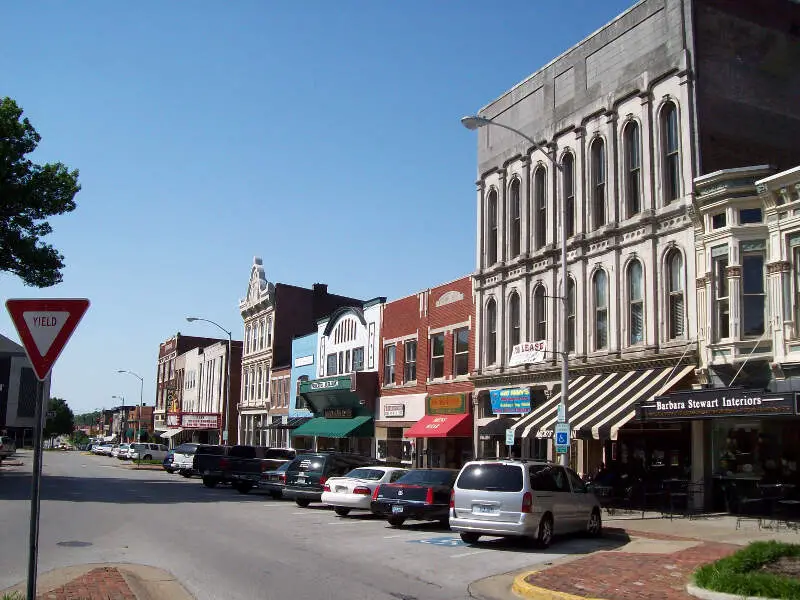
- Richmond
- Florence
- Elizabethtown
- Nicholasville
You can click here to see a full table of the full of the 100 biggest cities in Kentucky, along with every other place over 1,000 people big. It is sortable by clicking on the headers.
Read on below to see more on the biggest cities. Or for more reading on places to live in Kentucky, check out:
- Best Places To Live In Kentucky
- Cheapest Places To Live In Kentucky
- Most Dangerous Cities In Kentucky
The 10 Biggest Cities In Kentucky
1. Louisville/jefferson County Metro Government (Balance)

/10
Rank Last Year: 1 (No Change)
Population: 631,818.0
Population 2010: 586,994
Growth: 7.6%
More on Louisville/jefferson County Metro Government (Balance): Real Estate
2. Lexington-Fayette Urban County

/10
Rank Last Year: 2 (No Change)
Population: 323,725.0
Population 2010: 288,045
Growth: 12.4%
More on Lexington-Fayette Urban County: Real Estate

/10
Rank Last Year: 3 (No Change)
Population: 75,388.0
Population 2010: 56,407
Growth: 33.7%
More on Bowling Green: Data | Crime | Cost Of Living | Real Estate

/10
Rank Last Year: 4 (No Change)
Population: 60,302.0
Population 2010: 56,541
Growth: 6.7%
More on Owensboro: Data | Crime | Cost Of Living | Real Estate

/10
Rank Last Year: 5 (No Change)
Population: 41,110.0
Population 2010: 41,055
Growth: 0.1%
More on Covington: Data | Crime | Cost Of Living | Real Estate

/10
Rank Last Year: 6 (No Change)
Population: 39,117.0
Population 2010: 27,268
Growth: 43.5%
More on Georgetown: Data | Crime | Cost Of Living | Real Estate


/10
Rank Last Year: 7 (No Change)
Population: 37,111.0
Population 2010: 30,983
Growth: 19.8%
More on Richmond: Data | Crime | Cost Of Living | Real Estate

/10
Rank Last Year: 8 (No Change)
Population: 32,803.0
Population 2010: 29,242
Growth: 12.2%
More on Florence: Data | Crime | Cost Of Living | Real Estate

/10
Rank Last Year: 9 (No Change)
Population: 32,576.0
Population 2010: 26,822
Growth: 21.5%
More on Elizabethtown: Data | Crime | Cost Of Living | Real Estate

/10
Rank Last Year: 10 (No Change)
Population: 32,197.0
Population 2010: 26,861
Growth: 19.9%
More on Nicholasville: Data | Crime | Cost Of Living | Real Estate
How We Determined The Largest Cities In Kentucky
We've been ranking and dissecting cities in the Bluegrass State for over 4 years now -- making this actually the fourth time we've run the numbers. We always use the best data, the US Census. In this case, that means we are using the American Community Survey.
It what is probably the most simple analysis we run each year, we ranked every place in Kentucky from biggest to smallest. The biggest city this year? That would be Louisville/Jefferson County Metro Government (Balance).
The smallest? Silver Grove, although there are places smaller than 1,000 people not listed here, so keep that in mind as we take a look at the top ten.
Now on to numbers 11-100 Biggest in Kentucky
We hope that you find the big city, or really any city, that's right for you. Below is a list of the rest of the biggest cities along with every other place in Kentucky.
Have fun snacking around in the Bluegrass State!
For more reading on Kentucky, check out:
- Best Places To Raise A Family In Kentucky
- Best Places To Retire In Kentucky
- Richest Cities In Kentucky
- Safest Places In Kentucky
- Worst Places To Live In Kentucky
- Most Expensive Places To Live In Kentucky
Detailed List Of The Biggest Cities In Kentucky
| Rank | City | Current Population | 2010 | Growth | |||||
|---|---|---|---|---|---|---|---|---|---|
| 1 | Louisville/jefferson County Metro Government (Balance) | 631,818.0 | 586,994 | 7.6% | |||||
| 2 | Lexington-Fayette Urban County | 323,725.0 | 288,045 | 12.4% | |||||
| 3 | Bowling Green | 75,388.0 | 56,407 | 33.7% | |||||
| 4 | Owensboro | 60,302.0 | 56,541 | 6.7% | |||||
| 5 | Covington | 41,110.0 | 41,055 | 0.1% | |||||
| 6 | Georgetown | 39,117.0 | 27,268 | 43.5% | |||||
| 7 | Richmond | 37,111.0 | 30,983 | 19.8% | |||||
| 8 | Florence | 32,803.0 | 29,242 | 12.2% | |||||
| 9 | Elizabethtown | 32,576.0 | 26,822 | 21.5% | |||||
| 10 | Nicholasville | 32,197.0 | 26,861 | 19.9% | |||||
| 11 | Hopkinsville | 30,906.0 | 30,862 | 0.1% | |||||
| 12 | Independence | 29,392.0 | 22,975 | 27.9% | |||||
| 13 | Jeffersontown | 29,199.0 | 26,460 | 10.4% | |||||
| 14 | Frankfort | 28,503.0 | 25,682 | 11.0% | |||||
| 15 | Henderson | 27,852.0 | 28,464 | -2.2% | |||||
| 16 | Paducah | 26,845.0 | 25,114 | 6.9% | |||||
| 17 | Radcliff | 22,864.0 | 21,039 | 8.7% | |||||
| 18 | Ashland | 21,295.0 | 21,613 | -1.5% | |||||
| 19 | Erlanger | 19,875.0 | 17,797 | 11.7% | |||||
| 20 | Madisonville | 19,515.0 | 19,558 | -0.2% | |||||
| 21 | Winchester | 19,213.0 | 18,132 | 6.0% | |||||
| 22 | Mount Washington | 18,480.0 | 9,049 | 104.2% | |||||
| 23 | Murray | 18,080.0 | 17,366 | 4.1% | |||||
| 24 | Burlington | 18,008.0 | 15,702 | 14.7% | |||||
| 25 | Shelbyville | 17,668.0 | 13,403 | 31.8% | |||||
| 26 | St. Matthews | 17,577.0 | 17,365 | 1.2% | |||||
| 27 | Danville | 17,327.0 | 16,054 | 7.9% | |||||
| 28 | Fort Thomas | 17,169.0 | 16,182 | 6.1% | |||||
| 29 | Berea | 15,786.0 | 13,255 | 19.1% | |||||
| 30 | Shively | 15,638.0 | 15,142 | 3.3% | |||||
| 31 | Glasgow | 15,197.0 | 13,924 | 9.1% | |||||
| 32 | Shepherdsville | 14,533.0 | 10,813 | 34.4% | |||||
| 33 | Newport | 13,967.0 | 15,404 | -9.3% | |||||
| 34 | Bardstown | 13,804.0 | 11,552 | 19.5% | |||||
| 35 | Somerset | 12,216.0 | 11,172 | 9.3% | |||||
| 36 | Lawrenceburg | 11,943.0 | 10,207 | 17.0% | |||||
| 37 | Campbellsville | 11,622.0 | 9,376 | 24.0% | |||||
| 38 | Fort Campbell North | 11,356.0 | 13,170 | -13.8% | |||||
| 39 | Lyndon | 11,030.0 | 10,786 | 2.3% | |||||
| 40 | Francisville | 10,565.0 | 7,737 | 36.6% | |||||
| 41 | Alexandria | 10,562.0 | 8,376 | 26.1% | |||||
| 42 | Versailles | 10,492.0 | 8,438 | 24.3% | |||||
| 43 | Franklin | 10,360.0 | 8,368 | 23.8% | |||||
| 44 | La Grange | 10,311.0 | 7,761 | 32.9% | |||||
| 45 | Oakbrook | 10,211.0 | 8,838 | 15.5% | |||||
| 46 | Paris | 10,160.0 | 8,611 | 18.0% | |||||
| 47 | Mayfield | 9,868.0 | 10,033 | -1.6% | |||||
| 48 | Middletown | 9,763.0 | 6,953 | 40.4% | |||||
| 49 | Harrodsburg | 9,313.0 | 8,320 | 11.9% | |||||
| 50 | Elsmere | 9,205.0 | 8,412 | 9.4% | |||||
| 51 | Middlesborough | 9,123.0 | 10,405 | -12.3% | |||||
| 52 | Fort Knox | 8,836.0 | 11,933 | -26.0% | |||||
| 53 | Hillview | 8,797.0 | 8,062 | 9.1% | |||||
| 54 | Maysville | 8,737.0 | 9,004 | -3.0% | |||||
| 55 | Fort Mitchell | 8,713.0 | 8,177 | 6.6% | |||||
| 56 | Edgewood | 8,447.0 | 8,698 | -2.9% | |||||
| 57 | Corbin | 8,246.0 | 7,342 | 12.3% | |||||
| 58 | Oak Grove | 7,962.0 | 7,283 | 9.3% | |||||
| 59 | Union | 7,642.0 | 5,018 | 52.3% | |||||
| 60 | London | 7,561.0 | 7,929 | -4.6% | |||||
| 61 | Mount Sterling | 7,551.0 | 6,759 | 11.7% | |||||
| 62 | Pikeville | 7,490.0 | 6,824 | 9.8% | |||||
| 63 | Villa Hills | 7,480.0 | 7,565 | -1.1% | |||||
| 64 | Russellville | 7,316.0 | 7,015 | 4.3% | |||||
| 65 | Flatwoods | 7,269.0 | 7,420 | -2.0% | |||||
| 66 | Taylor Mill | 6,937.0 | 6,662 | 4.1% | |||||
| 67 | Morehead | 6,870.0 | 6,981 | -1.6% | |||||
| 68 | Vine Grove | 6,830.0 | 4,310 | 58.5% | |||||
| 69 | Leitchfield | 6,819.0 | 6,640 | 2.7% | |||||
| 70 | Cynthiana | 6,458.0 | 6,457 | 0.0% | |||||
| 71 | Highland Heights | 6,444.0 | 6,809 | -5.4% | |||||
| 72 | Lebanon | 6,430.0 | 5,546 | 15.9% | |||||
| 73 | Hebron | 6,407.0 | 5,812 | 10.2% | |||||
| 74 | Crestwood | 6,356.0 | 4,248 | 49.6% | |||||
| 75 | Cold Spring | 6,341.0 | 5,495 | 15.4% | |||||
| 76 | Princeton | 6,241.0 | 6,331 | -1.4% | |||||
| 77 | Wilmore | 6,057.0 | 3,740 | 62.0% | |||||
| 78 | Fort Wright | 5,887.0 | 5,704 | 3.2% | |||||
| 79 | Monticello | 5,753.0 | 6,176 | -6.8% | |||||
| 80 | Dayton | 5,743.0 | 5,390 | 6.5% | |||||
| 81 | Walton | 5,730.0 | 3,467 | 65.3% | |||||
| 82 | Central City | 5,707.0 | 5,984 | -4.6% | |||||
| 83 | Bellevue | 5,636.0 | 6,006 | -6.2% | |||||
| 84 | Douglass Hills | 5,474.0 | 5,463 | 0.2% | |||||
| 85 | Reidland | 5,277.0 | 4,379 | 20.5% | |||||
| 86 | Williamsburg | 5,270.0 | 5,268 | 0.0% | |||||
| 87 | Hazard | 5,008.0 | 4,534 | 10.5% | |||||
| 88 | Columbia | 4,808.0 | 4,466 | 7.7% | |||||
| 89 | Benton | 4,748.0 | 4,365 | 8.8% | |||||
| 90 | Hurstbourne | 4,702.0 | 4,130 | 13.8% | |||||
| 91 | Massac | 4,698.0 | 4,407 | 6.6% | |||||
| 92 | Prospect | 4,542.0 | 4,667 | -2.7% | |||||
| 93 | Hendron | 4,495.0 | 4,315 | 4.2% | |||||
| 94 | Crescent Springs | 4,486.0 | 3,807 | 17.8% | |||||
| 95 | Westwood | 4,473.0 | 4,596 | -2.7% | |||||
| 96 | Farley | 4,458.0 | 4,535 | -1.7% | |||||
| 97 | Scottsville | 4,427.0 | 4,251 | 4.1% | |||||
| 98 | Greenville | 4,410.0 | 4,314 | 2.2% | |||||
| 99 | Ludlow | 4,378.0 | 4,400 | -0.5% | |||||
| 100 | Paintsville | 4,203.0 | 3,474 | 21.0% | |||||
| 101 | Buckner | 4,119.0 | 5,119 | -19.5% | |||||
| 102 | Crittenden | 4,084.0 | 3,646 | 12.0% | |||||
| 103 | Lancaster | 4,013.0 | 3,521 | 14.0% | |||||
| 104 | Williamstown | 3,945.0 | 3,898 | 1.2% | |||||
| 105 | Carrollton | 3,915.0 | 3,918 | -0.1% | |||||
| 106 | Grayson | 3,778.0 | 4,216 | -10.4% | |||||
| 107 | Prestonsburg | 3,765.0 | 3,443 | 9.4% | |||||
| 108 | Southgate | 3,717.0 | 3,704 | 0.4% | |||||
| 109 | Russell | 3,676.0 | 3,414 | 7.7% | |||||
| 110 | Stanford | 3,643.0 | 3,555 | 2.5% | |||||
| 111 | Beaver Dam | 3,524.0 | 3,376 | 4.4% | |||||
| 112 | Hodgenville | 3,389.0 | 3,145 | 7.8% | |||||
| 113 | West Liberty | 3,295.0 | 3,447 | -4.4% | |||||
| 114 | Crestview Hills | 3,284.0 | 3,113 | 5.5% | |||||
| 115 | Claryville | 3,251.0 | 2,437 | 33.4% | |||||
| 116 | Stanton | 3,218.0 | 2,800 | 14.9% | |||||
| 117 | Morganfield | 3,185.0 | 3,313 | -3.9% | |||||
| 118 | Park Hills | 3,165.0 | 2,963 | 6.8% | |||||
| 119 | Barbourville | 3,146.0 | 3,343 | -5.9% | |||||
| 120 | Wilder | 3,135.0 | 2,925 | 7.2% | |||||
| 121 | Simpsonville | 3,062.0 | 2,466 | 24.2% | |||||
| 122 | Flemingsburg | 2,965.0 | 2,714 | 9.2% | |||||
| 123 | Brandenburg | 2,937.0 | 2,572 | 14.2% | |||||
| 124 | Springfield | 2,899.0 | 2,538 | 14.2% | |||||
| 125 | Eddyville | 2,897.0 | 2,540 | 14.1% | |||||
| 126 | Indian Hills | 2,897.0 | 2,871 | 0.9% | |||||
| 127 | Masonville | 2,887.0 | 1,041 | 177.3% | |||||
| 128 | Marion | 2,886.0 | 3,056 | -5.6% | |||||
| 129 | Providence | 2,857.0 | 3,281 | -12.9% | |||||
| 130 | Lakeside Park | 2,828.0 | 2,691 | 5.1% | |||||
| 131 | Graymoor-Devondale | 2,802.0 | 2,879 | -2.7% | |||||
| 132 | Russell Springs | 2,773.0 | 1,864 | 48.8% | |||||
| 133 | Cave City | 2,730.0 | 2,131 | 28.1% | |||||
| 134 | Eminence | 2,724.0 | 2,202 | 23.7% | |||||
| 135 | Irvine | 2,723.0 | 2,730 | -0.3% | |||||
| 136 | Pioneer Village | 2,723.0 | 1,926 | 41.4% | |||||
| 137 | Cadiz | 2,677.0 | 2,542 | 5.3% | |||||
| 138 | Hartford | 2,649.0 | 2,671 | -0.8% | |||||
| 139 | Junction City | 2,643.0 | 2,908 | -9.1% | |||||
| 140 | Tompkinsville | 2,613.0 | 2,554 | 2.3% | |||||
| 141 | Louisa | 2,580.0 | 2,907 | -11.2% | |||||
| 142 | Calvert City | 2,526.0 | 2,604 | -3.0% | |||||
| 143 | Anchorage | 2,506.0 | 2,534 | -1.1% | |||||
| 144 | Morgantown | 2,479.0 | 2,438 | 1.7% | |||||
| 145 | Falmouth | 2,449.0 | 2,441 | 0.3% | |||||
| 146 | Dry Ridge | 2,441.0 | 2,177 | 12.1% | |||||
| 147 | Mount Vernon | 2,398.0 | 3,322 | -27.8% | |||||
| 148 | Fulton | 2,378.0 | 3,134 | -24.1% | |||||
| 149 | Edmonton | 2,330.0 | 1,571 | 48.3% | |||||
| 150 | Hardinsburg | 2,327.0 | 2,763 | -15.8% | |||||
| 151 | Lebanon Junction | 2,327.0 | 1,641 | 41.8% | |||||
| 152 | Raceland | 2,265.0 | 2,563 | -11.6% | |||||
| 153 | Carlisle | 2,214.0 | 2,039 | 8.6% | |||||
| 154 | Elk Creek | 2,207.0 | 1,687 | 30.8% | |||||
| 155 | North Corbin | 2,190.0 | 1,709 | 28.1% | |||||
| 156 | Harlan | 2,160.0 | 2,049 | 5.4% | |||||
| 157 | Horse Cave | 2,143.0 | 2,565 | -16.5% | |||||
| 158 | Hickman | 2,115.0 | 2,062 | 2.6% | |||||
| 159 | Greensburg | 2,106.0 | 2,388 | -11.8% | |||||
| 160 | Beattyville | 2,095.0 | 1,285 | 63.0% | |||||
| 161 | Windy Hills | 2,081.0 | 2,235 | -6.9% | |||||
| 162 | Warsaw | 2,072.0 | 1,891 | 9.6% | |||||
| 163 | Brooks | 2,069.0 | 3,018 | -31.4% | |||||
| 164 | Pineville | 2,064.0 | 2,560 | -19.4% | |||||
| 165 | Lewisport | 2,057.0 | 1,820 | 13.0% | |||||
| 166 | Cumberland | 2,037.0 | 1,896 | 7.4% | |||||
| 167 | Jackson | 2,015.0 | 2,148 | -6.2% | |||||
| 168 | Hurstbourne Acres | 1,972.0 | 1,683 | 17.2% | |||||
| 169 | Worthington Hills | 1,957.0 | 1,490 | 31.3% | |||||
| 170 | Dawson Springs | 1,951.0 | 2,810 | -30.6% | |||||
| 171 | Elkton | 1,924.0 | 2,430 | -20.8% | |||||
| 172 | Orchard Grass Hills | 1,912.0 | 1,633 | 17.1% | |||||
| 173 | Albany | 1,896.0 | 2,156 | -12.1% | |||||
| 174 | Munfordville | 1,893.0 | 1,417 | 33.6% | |||||
| 175 | Sturgis | 1,864.0 | 2,169 | -14.1% | |||||
| 176 | Sebree | 1,825.0 | 1,538 | 18.7% | |||||
| 177 | Auburn | 1,794.0 | 1,229 | 46.0% | |||||
| 178 | Ledbetter | 1,785.0 | 1,522 | 17.3% | |||||
| 179 | St. Regis Park | 1,783.0 | 1,520 | 17.3% | |||||
| 180 | Midway | 1,776.0 | 1,802 | -1.4% | |||||
| 181 | Doe Valley | 1,776.0 | 1,540 | 15.3% | |||||
| 182 | Whitesburg | 1,761.0 | 1,789 | -1.6% | |||||
| 183 | Worthington | 1,759.0 | 1,559 | 12.8% | |||||
| 184 | Jamestown | 1,739.0 | 1,485 | 17.1% | |||||
| 185 | Coal Run Village | 1,724.0 | 1,417 | 21.7% | |||||
| 186 | Salyersville | 1,708.0 | 1,793 | -4.7% | |||||
| 187 | Audubon Park | 1,707.0 | 1,529 | 11.6% | |||||
| 188 | Liberty | 1,672.0 | 1,618 | 3.3% | |||||
| 189 | Jeffersonville | 1,651.0 | 1,832 | -9.9% | |||||
| 190 | South Shore | 1,642.0 | 1,314 | 25.0% | |||||
| 191 | Olive Hill | 1,636.0 | 1,859 | -12.0% | |||||
| 192 | Owingsville | 1,621.0 | 1,941 | -16.5% | |||||
| 193 | West Buechel | 1,599.0 | 1,117 | 43.2% | |||||
| 194 | Guthrie | 1,559.0 | 1,611 | -3.2% | |||||
| 195 | Catlettsburg | 1,557.0 | 2,011 | -22.6% | |||||
| 196 | Manchester | 1,541.0 | 1,401 | 10.0% | |||||
| 197 | Owenton | 1,511.0 | 1,928 | -21.6% | |||||
| 198 | Augusta | 1,510.0 | 1,338 | 12.9% | |||||
| 199 | Taylorsville | 1,496.0 | 986 | 51.7% | |||||
| 200 | Pewee Valley | 1,483.0 | 1,271 | 16.7% | |||||
| 201 | Vanceburg | 1,482.0 | 1,997 | -25.8% | |||||
| 202 | Breckinridge Center | 1,467.0 | 1,533 | -4.3% | |||||
| 203 | Burkesville | 1,454.0 | 1,981 | -26.6% | |||||
| 204 | Brodhead | 1,423.0 | 1,288 | 10.5% | |||||
| 205 | Bellefonte | 1,419.0 | 757 | 87.5% | |||||
| 206 | Jenkins | 1,406.0 | 2,459 | -42.8% | |||||
| 207 | Verona | 1,394.0 | 1,527 | -8.7% | |||||
| 208 | Coldstream | 1,331.0 | 1,263 | 5.4% | |||||
| 209 | Irvington | 1,327.0 | 1,453 | -8.7% | |||||
| 210 | Beechwood Village | 1,292.0 | 1,287 | 0.4% | |||||
| 211 | Plano | 1,290.0 | 1,128 | 14.4% | |||||
| 212 | Heritage Creek | 1,283.0 | 1,046 | 22.7% | |||||
| 213 | Hebron Estates | 1,276.0 | 1,018 | 25.3% | |||||
| 214 | Stearns | 1,271.0 | 1,381 | -8.0% | |||||
| 215 | Northfield | 1,250.0 | 1,201 | 4.1% | |||||
| 216 | Barbourmeade | 1,247.0 | 1,323 | -5.7% | |||||
| 217 | Livermore | 1,223.0 | 1,304 | -6.2% | |||||
| 218 | Clay City | 1,204.0 | 1,233 | -2.4% | |||||
| 219 | Hawesville | 1,188.0 | 1,064 | 11.7% | |||||
| 220 | Clinton | 1,165.0 | 1,558 | -25.2% | |||||
| 221 | Wurtland | 1,154.0 | 1,079 | 7.0% | |||||
| 222 | Cloverport | 1,133.0 | 1,180 | -4.0% | |||||
| 223 | Cannonsburg | 1,129.0 | 765 | 47.6% | |||||
| 224 | Muldraugh | 1,127.0 | 1,315 | -14.3% | |||||
| 225 | Bloomfield | 1,124.0 | 978 | 14.9% | |||||
| 226 | Pleasureville | 1,123.0 | 1,011 | 11.1% | |||||
| 227 | Earlington | 1,084.0 | 1,437 | -24.6% | |||||
| 228 | Brownsville | 1,068.0 | 1,207 | -11.5% | |||||
| 229 | Annville | 1,063.0 | 1,800 | -40.9% | |||||
| 230 | New Castle | 1,052.0 | 1,253 | -16.0% | |||||
| 231 | Pine Knot | 1,051.0 | 1,465 | -28.3% | |||||
| 232 | Lewisburg | 1,043.0 | 940 | 11.0% | |||||
| 233 | Dixon | 1,036.0 | 631 | 64.2% | |||||
| 234 | West Point | 1,025.0 | 655 | 56.5% | |||||
| 235 | White Plains | 1,021.0 | 614 | 66.3% | |||||
| 236 | Campbellsburg | 1,016.0 | 746 | 36.2% | |||||
| 237 | Plantation | 1,013.0 | 857 | 18.2% | |||||
| 238 | Silver Grove | 1,008.0 | 1,071 | -5.9% | |||||