
Most Asian cities in Ohio research summary. We analyzed Ohio’s most recent Census data to determine the most Asian cities in Ohio based on the percentage of Asian residents. Here are the results of our analysis:
-
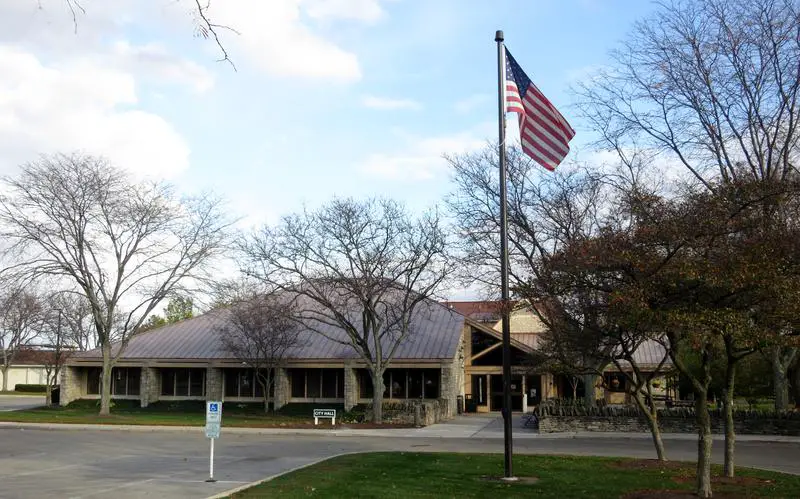
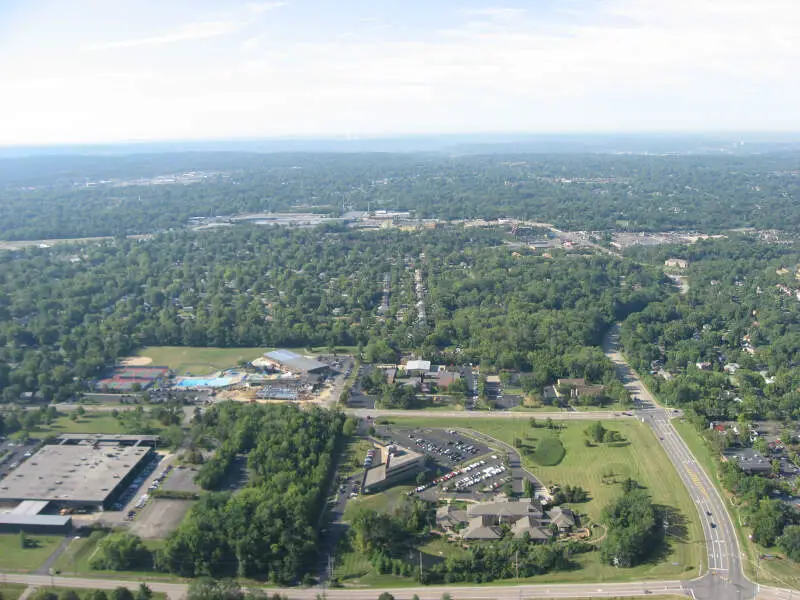
The most Asian city in Ohio is Dublin based on the most recent Census data.
-
Dublin is 18.92% Asian.
-
The least Asian city in Ohio is Girard.
-
Girard is 0.0% Asian.
-
Ohio is 2.5% Asian.
-
Ohio is the 30th most Asian state in the United States.
Table Of Contents: Top Ten | Methodology | Summary | Table
Here are the cities in Ohio with the largest Asian population in 2026:
Which city in Ohio had the largest Asian population? Dublin took the number one overall spot for the largest Asian in Ohio for 2026. 18.92% of Dublin identify as Asian.
Read below to see how we crunched the numbers and how your town ranked.
To see where Ohio ranked as a state on diversity, we have a ranking of the most diverse states in America.
And if you already knew these places were Asian, check out the best places to live in Ohio or the most diverse places in Ohio.
The 10 Most Asian Cities In Ohio For 2026

/10
Population: 49,294
% Asian: 18.92%
# Of Asian Residents: 9,326
More on Dublin: Data | Crime | Cost Of Living | Movers

/10
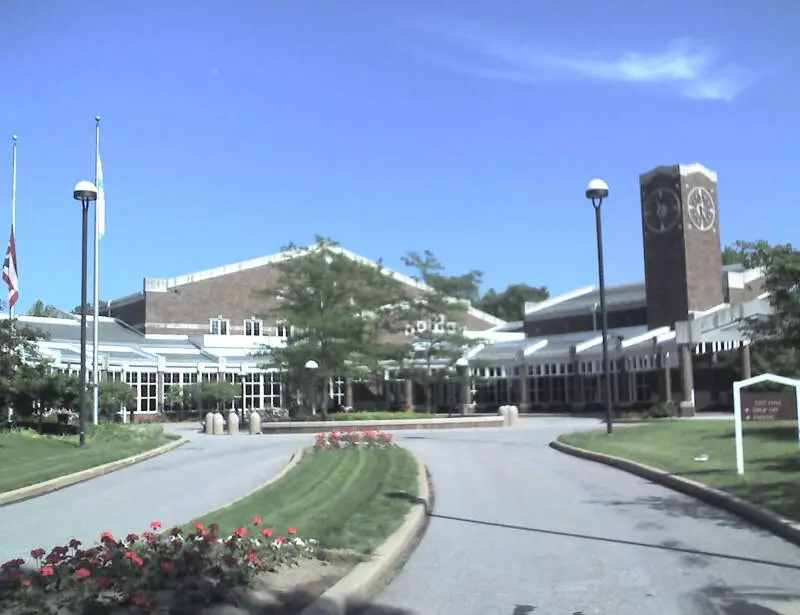
Population: 23,943
% Asian: 15.79%
# Of Asian Residents: 3,780
More on Solon: Data | Crime | Cost Of Living | Movers

/10
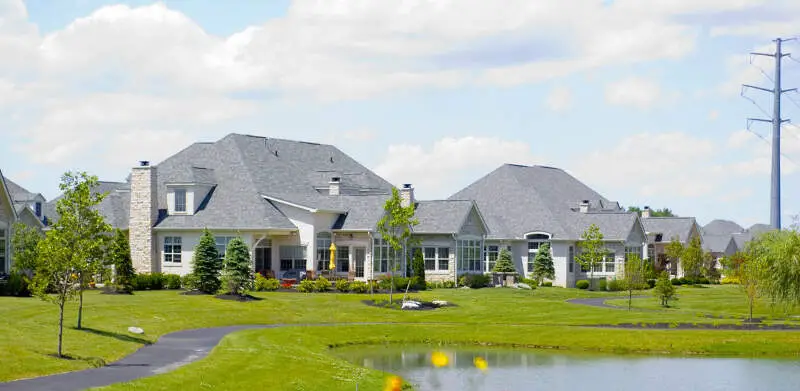
Population: 14,451
% Asian: 14.73%
# Of Asian Residents: 2,128
More on Powell: Data | Crime | Cost Of Living | Movers

/10
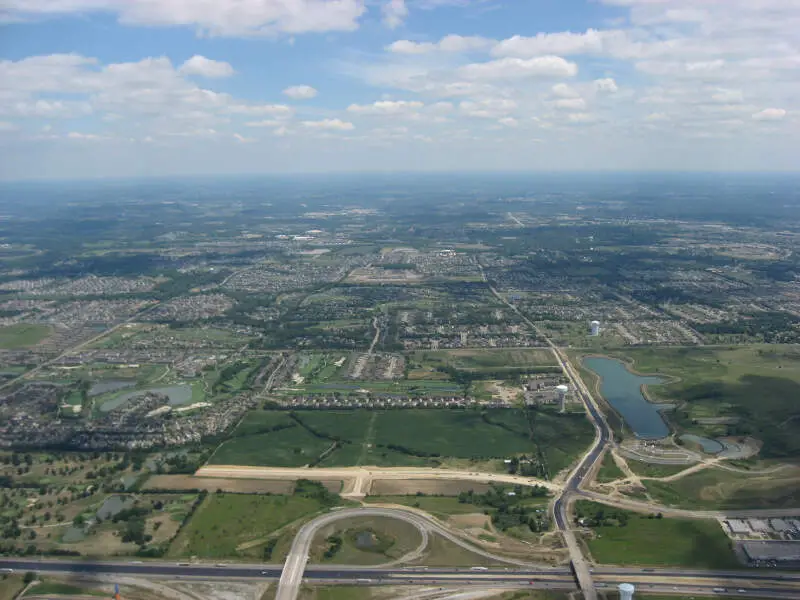
Population: 35,509
% Asian: 13.97%
# Of Asian Residents: 4,961
More on Mason: Data | Crime | Cost Of Living | Movers

/10
Population: 13,455
% Asian: 13.03%
# Of Asian Residents: 1,753
More on Blue Ash: Data | Crime | Cost Of Living | Movers

/10
Population: 18,223
% Asian: 12.17%
# Of Asian Residents: 2,217
More on Pataskala: Data | Cost Of Living | Movers

/10
Population: 6,840
% Asian: 11.35%
# Of Asian Residents: 776
More on Pepper Pike: Data | Crime | Cost Of Living | Movers

/10
Population: 13,865
% Asian: 9.33%
# Of Asian Residents: 1,294
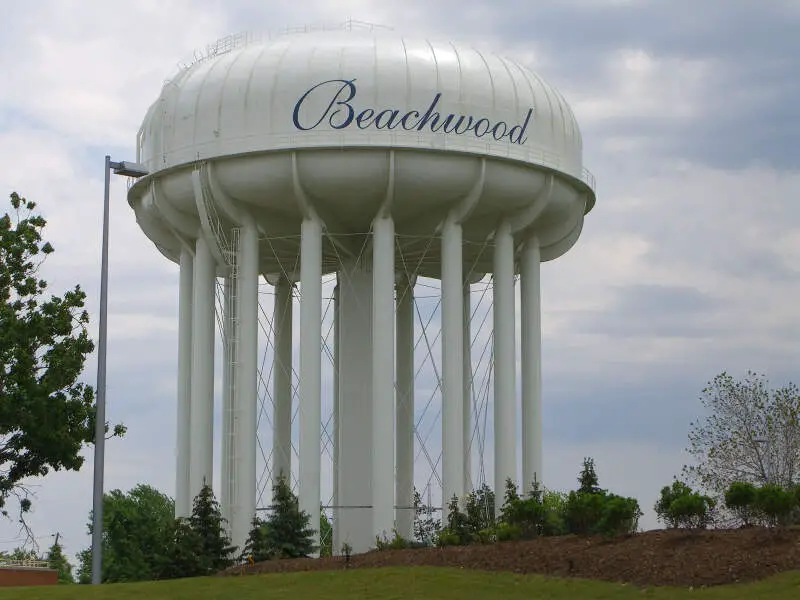
More on Beachwood: Data | Crime | Cost Of Living | Movers

/10
Population: 15,786
% Asian: 8.39%
# Of Asian Residents: 1,324
More on Middleburg Heights: Data | Cost Of Living | Movers

/10
Population: 18,335
% Asian: 8.26%
# Of Asian Residents: 1,515
More on Tallmadge: Data | Crime | Cost Of Living | Movers
Methodology: How We Determined The Cities In Ohio With The Largest Asian Population For 2026
We used Saturday Night Science to compare Census data on race across every place in Ohio.
The Census’s most recently available data comes from the 2020-2024 American Community Survey.
Specifically, we looked at table B03002: Hispanic OR LATINO ORIGIN BY RACE. Here are the category names as defined by the Census:
- Hispanic or Latino
- White alone*
- Black or African American alone*
- American Indian and Alaska Native alone*
- Asian alone*
- Native Hawaiian and Other Pacific Islander alone*
- Some other race alone*
- Two or more races*
Our particular column of interest here was the number of people who identified as Asian alone.
We limited our analysis to cities with a population greater than 5,000 people. That left us with 243 cities.
We then calculated the percentage of residents that are Asian. The percentages ranked from 18.9% to 0.0%.
Finally, we ranked each city based on the percentage of Asian population, with a higher score being more Asian than a lower score. Dublin took the distinction of being the most Asian, while Girard was the least Asian city.
We updated this article for 2026. This report reflects our eleventh time ranking the cities in Ohio with the largest Asian population.
Read on for more information on how the cities in Ohio ranked by population of Asian residents or, for a more general take on diversity in America, head over to our ranking of the most diverse cities in America.
Summary: Asian Populations Across Ohio
If you’re looking for a breakdown of Asian populations across Ohio according to the most recent data, this is an accurate list.
The most Asian cities in Ohio are Dublin, Solon, Powell, Mason, Blue Ash, Pataskala, Pepper Pike, Beachwood, Middleburg Heights, and Tallmadge.
If you’re curious enough, here are the least Asian places in Ohio:
- Girard
- Port Clinton
- Eaton
For more Ohio reading, check out:
Table: Asian Population By City In Ohio
| Rank | City | Population | Asian Population | % Asian |
|---|---|---|---|---|
| 1 | Dublin | 49,294 | 9,326 | 18.92% |
| 2 | Solon | 23,943 | 3,780 | 15.79% |
| 3 | Powell | 14,451 | 2,128 | 14.73% |
| 4 | Mason | 35,509 | 4,961 | 13.97% |
| 5 | Blue Ash | 13,455 | 1,753 | 13.03% |
| 6 | Pataskala | 18,223 | 2,217 | 12.17% |
| 7 | Pepper Pike | 6,840 | 776 | 11.35% |
| 8 | Beachwood | 13,865 | 1,294 | 9.33% |
| 9 | Middleburg Heights | 15,786 | 1,324 | 8.39% |
| 10 | Tallmadge | 18,335 | 1,515 | 8.26% |
| 11 | Twinsburg | 19,410 | 1,558 | 8.03% |
| 12 | Oxford | 21,753 | 1,723 | 7.92% |
| 13 | Granville | 5,999 | 466 | 7.77% |
| 14 | Mayfield Heights | 20,022 | 1,547 | 7.73% |
| 15 | Macedonia | 12,152 | 928 | 7.64% |
| 16 | Fairfield | 44,828 | 3,301 | 7.36% |
| 17 | Munroe Falls | 5,000 | 353 | 7.06% |
| 18 | Hilliard | 38,033 | 2,665 | 7.01% |
| 19 | Pickerington | 24,477 | 1,653 | 6.75% |
| 20 | Highland Heights | 8,623 | 578 | 6.7% |
| 21 | Brooklyn | 11,158 | 744 | 6.67% |
| 22 | Upper Arlington | 36,293 | 2,413 | 6.65% |
| 23 | Strongsville | 45,983 | 2,823 | 6.14% |
| 24 | Westlake | 34,104 | 2,086 | 6.12% |
| 25 | Cleveland Heights | 44,497 | 2,675 | 6.01% |
| 26 | Columbus | 914,802 | 54,326 | 5.94% |
| 27 | Delaware | 44,589 | 2,612 | 5.86% |
| 28 | Reynoldsburg | 41,224 | 2,350 | 5.7% |
| 29 | Springdale | 11,033 | 610 | 5.53% |
| 30 | The Village Of Indian Hill | 6,052 | 334 | 5.52% |
| 31 | Seven Hills | 11,603 | 627 | 5.4% |
| 32 | Beavercreek | 47,126 | 2,363 | 5.01% |
| 33 | Brookville | 5,779 | 282 | 4.88% |
| 34 | Akron | 189,247 | 9,203 | 4.86% |
| 35 | Cuyahoga Falls | 50,909 | 2,333 | 4.58% |
| 36 | Avon | 25,317 | 1,150 | 4.54% |
| 37 | Perrysburg | 25,181 | 1,137 | 4.52% |
| 38 | Fairlawn | 7,711 | 346 | 4.49% |
| 39 | Streetsboro | 17,661 | 778 | 4.41% |
| 40 | Stow | 34,240 | 1,459 | 4.26% |
| 41 | Sharonville | 14,030 | 597 | 4.26% |
| 42 | Willoughby Hills | 9,975 | 423 | 4.24% |
| 43 | Broadview Heights | 19,771 | 818 | 4.14% |
| 44 | Loveland | 13,197 | 539 | 4.08% |
| 45 | Bellbrook | 7,394 | 296 | 4.0% |
| 46 | Troy | 26,842 | 1,073 | 4.0% |
| 47 | Oberlin | 8,329 | 328 | 3.94% |
| 48 | North Royalton | 30,972 | 1,179 | 3.81% |
| 49 | Monroe | 15,401 | 583 | 3.79% |
| 50 | Shaker Heights | 28,922 | 1,090 | 3.77% |
| 51 | Franklin | 11,712 | 432 | 3.69% |
| 52 | Madeira | 9,484 | 343 | 3.62% |
| 53 | Hudson | 23,039 | 832 | 3.61% |
| 54 | Forest Park | 20,025 | 722 | 3.61% |
| 55 | Montgomery | 10,855 | 391 | 3.6% |
| 56 | Kent | 27,116 | 967 | 3.57% |
| 57 | Aurora | 17,581 | 624 | 3.55% |
| 58 | Huber Heights | 43,455 | 1,538 | 3.54% |
| 59 | Norton | 11,524 | 400 | 3.47% |
| 60 | Brecksville | 13,692 | 471 | 3.44% |
| 61 | Mentor | 47,171 | 1,611 | 3.42% |
| 62 | Green | 27,393 | 897 | 3.27% |
| 63 | Athens | 23,396 | 759 | 3.24% |
| 64 | Gahanna | 35,486 | 1,134 | 3.2% |
| 65 | Parma Heights | 20,581 | 650 | 3.16% |
| 66 | Canal Fulton | 5,337 | 167 | 3.13% |
| 67 | Lakewood | 50,007 | 1,561 | 3.12% |
| 68 | Sylvania | 19,055 | 593 | 3.11% |
| 69 | Martins Ferry | 6,140 | 184 | 3.0% |
| 70 | Parma | 79,870 | 2,380 | 2.98% |
| 71 | Whitehall | 20,019 | 583 | 2.91% |
| 72 | Miamisburg | 19,948 | 576 | 2.89% |
| 73 | Springboro | 19,980 | 574 | 2.87% |
| 74 | Wyoming | 8,723 | 248 | 2.84% |
| 75 | Riverside | 24,435 | 694 | 2.84% |
| 76 | Westerville | 38,645 | 1,071 | 2.77% |
| 77 | Jackson | 6,231 | 171 | 2.74% |
| 78 | Grandview Heights | 8,647 | 235 | 2.72% |
| 79 | Cincinnati | 311,224 | 8,154 | 2.62% |
| 80 | Cleveland | 366,097 | 9,547 | 2.61% |
| 81 | Moraine | 6,536 | 159 | 2.43% |
| 82 | Tipp City | 10,439 | 243 | 2.33% |
| 83 | Northwood | 5,193 | 119 | 2.29% |
| 84 | Vandalia | 15,053 | 341 | 2.27% |
| 85 | Columbiana | 6,903 | 155 | 2.25% |
| 86 | Findlay | 40,287 | 904 | 2.24% |
| 87 | Wooster | 26,971 | 602 | 2.23% |
| 88 | Centerville | 25,205 | 554 | 2.2% |
| 89 | Ontario | 6,667 | 146 | 2.19% |
| 90 | Rocky River | 21,490 | 460 | 2.14% |
| 91 | Amherst | 12,906 | 274 | 2.12% |
| 92 | South Euclid | 21,534 | 447 | 2.08% |
| 93 | Worthington | 14,938 | 305 | 2.04% |
| 94 | Oakwood | 9,458 | 191 | 2.02% |
| 95 | London | 10,484 | 207 | 1.97% |
| 96 | North Olmsted | 31,924 | 618 | 1.94% |
| 97 | Bowling Green | 29,983 | 576 | 1.92% |
| 98 | University Heights | 13,394 | 257 | 1.92% |
| 99 | Grove City | 42,517 | 794 | 1.87% |
| 100 | Bucyrus | 11,594 | 210 | 1.81% |
| 101 | Sandusky | 24,606 | 440 | 1.79% |
| 102 | Richmond Heights | 10,626 | 189 | 1.78% |
| 103 | Avon Lake | 25,752 | 457 | 1.77% |
| 104 | Lyndhurst | 13,801 | 242 | 1.75% |
| 105 | Kettering | 57,206 | 954 | 1.67% |
| 106 | Painesville | 20,548 | 339 | 1.65% |
| 107 | Shelby | 8,865 | 144 | 1.62% |
| 108 | Bexley | 13,114 | 206 | 1.57% |
| 109 | Clayton | 13,277 | 202 | 1.52% |
| 110 | North Ridgeville | 36,627 | 543 | 1.48% |
| 111 | Wickliffe | 12,659 | 182 | 1.44% |
| 112 | Independence | 7,534 | 108 | 1.43% |
| 113 | Ravenna | 11,274 | 158 | 1.4% |
| 114 | Fairborn | 34,534 | 472 | 1.37% |
| 115 | Elyria | 53,035 | 719 | 1.36% |
| 116 | Englewood | 13,356 | 181 | 1.36% |
| 117 | Brook Park | 18,284 | 245 | 1.34% |
| 118 | Dayton | 136,579 | 1,822 | 1.33% |
| 119 | Portsmouth | 17,728 | 232 | 1.31% |
| 120 | Zanesville | 24,740 | 321 | 1.3% |
| 121 | Olmsted Falls | 8,639 | 112 | 1.3% |
| 122 | Berea | 18,218 | 234 | 1.28% |
| 123 | Orrville | 8,343 | 107 | 1.28% |
| 124 | Toledo | 267,463 | 3,363 | 1.26% |
| 125 | Washington Court House | 14,439 | 180 | 1.25% |
| 126 | Struthers | 9,923 | 123 | 1.24% |
| 127 | Greenville | 12,741 | 157 | 1.23% |
| 128 | Marysville | 27,518 | 338 | 1.23% |
| 129 | Mentor-On-The-Lake | 7,111 | 87 | 1.22% |
| 130 | Fairview Park | 17,018 | 206 | 1.21% |
| 131 | Mount Vernon | 17,052 | 206 | 1.21% |
| 132 | West Carrollton | 12,976 | 155 | 1.19% |
| 133 | Oregon | 19,799 | 234 | 1.18% |
| 134 | Wadsworth | 24,492 | 284 | 1.16% |
| 135 | Hubbard | 7,598 | 87 | 1.15% |
| 136 | Lebanon | 21,501 | 245 | 1.14% |
| 137 | Trotwood | 23,041 | 256 | 1.11% |
| 138 | Logan | 6,993 | 75 | 1.07% |
| 139 | Heath | 10,644 | 114 | 1.07% |
| 140 | Xenia | 25,689 | 274 | 1.07% |
| 141 | Newark | 50,783 | 519 | 1.02% |
| 142 | Tiffin | 17,818 | 182 | 1.02% |
| 143 | Bellefontaine | 13,807 | 138 | 1.0% |
| 144 | Urbana | 11,204 | 110 | 0.98% |
| 145 | New Philadelphia | 17,520 | 167 | 0.95% |
| 146 | East Cleveland | 13,534 | 128 | 0.95% |
| 147 | St. Clairsville | 5,003 | 47 | 0.94% |
| 148 | Deer Park | 5,384 | 50 | 0.93% |
| 149 | Middletown | 51,617 | 478 | 0.93% |
| 150 | Willard | 6,164 | 57 | 0.92% |
| 151 | Sidney | 20,501 | 188 | 0.92% |
| 152 | Bay Village | 15,984 | 145 | 0.91% |
| 153 | Mansfield | 47,663 | 430 | 0.9% |
| 154 | Reading | 10,502 | 94 | 0.9% |
| 155 | Lima | 35,010 | 309 | 0.88% |
| 156 | Brunswick | 35,246 | 307 | 0.87% |
| 157 | Rittman | 6,044 | 52 | 0.86% |
| 158 | Willoughby | 24,046 | 199 | 0.83% |
| 159 | Hamilton | 63,468 | 524 | 0.83% |
| 160 | Bryan | 8,631 | 71 | 0.82% |
| 161 | Ashland | 18,911 | 155 | 0.82% |
| 162 | Fostoria | 12,344 | 100 | 0.81% |
| 163 | Maple Heights | 23,258 | 187 | 0.8% |
| 164 | Marietta | 13,203 | 106 | 0.8% |
| 165 | North Canton | 17,727 | 140 | 0.79% |
| 166 | Steubenville | 18,124 | 142 | 0.78% |
| 167 | Warren | 38,912 | 300 | 0.77% |
| 168 | Wilmington | 12,620 | 92 | 0.73% |
| 169 | Niles | 18,287 | 132 | 0.72% |
| 170 | Canfield | 7,649 | 55 | 0.72% |
| 171 | Toronto | 5,293 | 38 | 0.72% |
| 172 | Bellevue | 8,187 | 55 | 0.67% |
| 173 | Youngstown | 59,331 | 387 | 0.65% |
| 174 | Vermilion | 10,343 | 66 | 0.64% |
| 175 | Lancaster | 41,249 | 258 | 0.63% |
| 176 | Massillon | 32,338 | 201 | 0.62% |
| 177 | Norwood | 19,114 | 116 | 0.61% |
| 178 | Canton | 69,755 | 409 | 0.59% |
| 179 | Wapakoneta | 9,894 | 57 | 0.58% |
| 180 | Euclid | 48,823 | 269 | 0.55% |
| 181 | Piqua | 20,646 | 110 | 0.53% |
| 182 | Ashtabula | 17,856 | 95 | 0.53% |
| 183 | Chillicothe | 21,902 | 113 | 0.52% |
| 184 | Marion | 35,669 | 181 | 0.51% |
| 185 | Milford | 6,497 | 32 | 0.49% |
| 186 | Galion | 10,339 | 49 | 0.47% |
| 187 | Kirtland | 6,911 | 32 | 0.46% |
| 188 | Uhrichsville | 5,189 | 23 | 0.44% |
| 189 | Belpre | 6,654 | 29 | 0.44% |
| 190 | Springfield | 58,190 | 249 | 0.43% |
| 191 | Sheffield Lake | 8,966 | 35 | 0.39% |
| 192 | Van Wert | 10,790 | 42 | 0.39% |
| 193 | Eastlake | 17,493 | 66 | 0.38% |
| 194 | Mount Healthy | 6,919 | 26 | 0.38% |
| 195 | Lorain | 65,395 | 244 | 0.37% |
| 196 | Alliance | 21,478 | 80 | 0.37% |
| 197 | Maumee | 13,715 | 51 | 0.37% |
| 198 | Conneaut | 12,357 | 43 | 0.35% |
| 199 | Medina | 25,950 | 82 | 0.32% |
| 200 | Fremont | 15,835 | 48 | 0.3% |
| 201 | Rossford | 6,323 | 18 | 0.28% |
| 202 | New Franklin | 13,843 | 38 | 0.27% |
| 203 | Dover | 13,053 | 35 | 0.27% |
| 204 | Coshocton | 11,068 | 26 | 0.23% |
| 205 | Wauseon | 7,505 | 16 | 0.21% |
| 206 | Defiance | 17,276 | 36 | 0.21% |
| 207 | Harrison | 13,084 | 26 | 0.2% |
| 208 | Cambridge | 10,060 | 19 | 0.19% |
| 209 | Willowick | 14,162 | 23 | 0.16% |
| 210 | Union | 7,037 | 11 | 0.16% |
| 211 | Celina | 10,903 | 15 | 0.14% |
| 212 | Geneva | 5,886 | 8 | 0.14% |
| 213 | St. Marys | 8,301 | 11 | 0.13% |
| 214 | Kenton | 7,663 | 10 | 0.13% |
| 215 | Circleville | 14,142 | 16 | 0.11% |
| 216 | Trenton | 13,583 | 15 | 0.11% |
| 217 | Huron | 6,757 | 6 | 0.09% |
| 218 | Garfield Heights | 29,269 | 20 | 0.07% |
| 219 | Barberton | 24,844 | 6 | 0.02% |
| 220 | Warrensville Heights | 13,545 | 2 | 0.01% |
| 221 | Louisville | 9,602 | 0 | 0.0% |
| 222 | Clyde | 6,331 | 0 | 0.0% |
| 223 | Cortland | 7,080 | 0 | 0.0% |
| 224 | Salem | 11,758 | 0 | 0.0% |
| 225 | Delphos | 7,143 | 0 | 0.0% |
| 226 | Napoleon | 8,802 | 0 | 0.0% |
| 227 | New Carlisle | 5,544 | 0 | 0.0% |
| 228 | Bedford Heights | 10,847 | 0 | 0.0% |
| 229 | Bedford | 12,931 | 0 | 0.0% |
| 230 | Campbell | 7,784 | 0 | 0.0% |
| 231 | North College Hill | 9,555 | 0 | 0.0% |
| 232 | Cheviot | 8,660 | 0 | 0.0% |
| 233 | Wellston | 5,452 | 0 | 0.0% |
| 234 | Chardon | 5,249 | 0 | 0.0% |
| 235 | Ironton | 10,768 | 0 | 0.0% |
| 236 | Norwalk | 17,095 | 0 | 0.0% |
| 237 | Hillsboro | 6,527 | 0 | 0.0% |
| 238 | East Liverpool | 9,783 | 0 | 0.0% |
| 239 | Upper Sandusky | 6,558 | 0 | 0.0% |
| 240 | Grafton | 5,657 | 0 | 0.0% |
| 241 | Eaton | 8,339 | 0 | 0.0% |
| 242 | Port Clinton | 5,970 | 0 | 0.0% |
| 243 | Girard | 9,505 | 0 | 0.0% |