
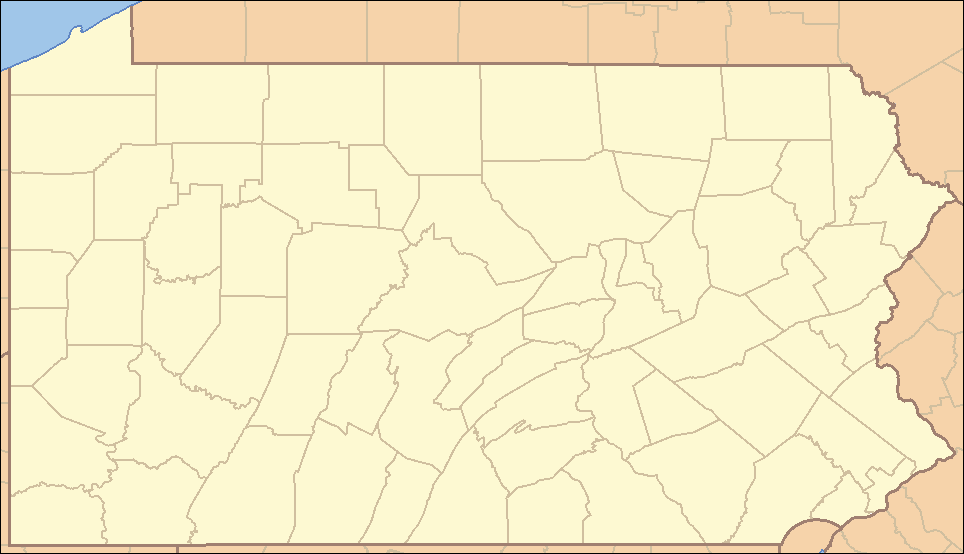
Most Asian cities in Pennsylvania research summary. We analyzed Pennsylvania’s most recent Census data to determine the most Asian cities in Pennsylvania based on the percentage of Asian residents. Here are the results of our analysis:
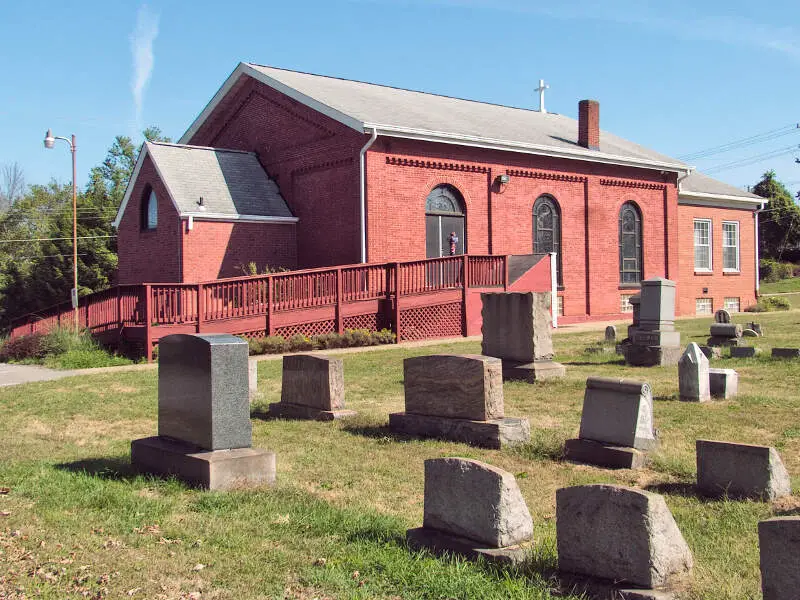
The most Asian city in Pennsylvania is Downin based on the most recent Census data.
Downin is 15.3% Asian.
The least Asian city in Pennsylvania is Franklin.
Franklin is 0.0% Asian.
Pennsylvania is 3.8% Asian.
Pennsylvania is the 18th most Asian state in the United States.
Table Of Contents: Top Ten | Methodology | Summary | Table
Here are the cities in Pennsylvania with the largest Asian population in 2026:
Which city in Pennsylvania had the largest Asian population? Downin took the number one overall spot for the largest Asian in Pennsylvania for 2026. 15.3% of Downin identify as Asian.
Read below to see how we crunched the numbers and how your town ranked.
To see where Pennsylvania ranked as a state on diversity, we have a ranking of the most diverse states in America.
And if you already knew these places were Asian, check out the best places to live in Pennsylvania or the most diverse places in Pennsylvania.
The 10 Most Asian Cities In Pennsylvania For 2026

/10
Population: 8,255
% Asian: 15.3%
# Of Asian Residents: 1,263
More on Downin: Data | Movers

/10
Population: 19,011
% Asian: 15.29%
# Of Asian Residents: 2,906
More on Lansdale: Data | Crime | Cost Of Living | Movers

/10
Population: 14,811
% Asian: 14.38%
# Of Asian Residents: 2,130
More on Whitehall: Data | Cost Of Living | Movers

/10
Population: 15,235
% Asian: 13.59%
# Of Asian Residents: 2,071
More on Franklin Park: Data | Cost Of Living | Movers

/10
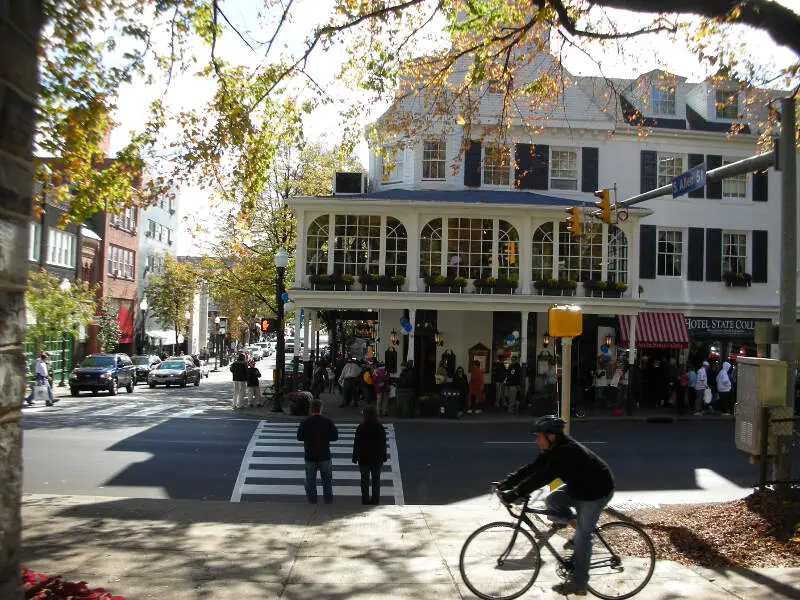
Population: 41,050
% Asian: 9.36%
# Of Asian Residents: 3,841
More on State College: Data | Crime | Cost Of Living | Movers

/10
Population: 21,057
% Asian: 8.42%
# Of Asian Residents: 1,773
More on Baldwin: Data | Cost Of Living | Movers

/10
Population: 1,579,706
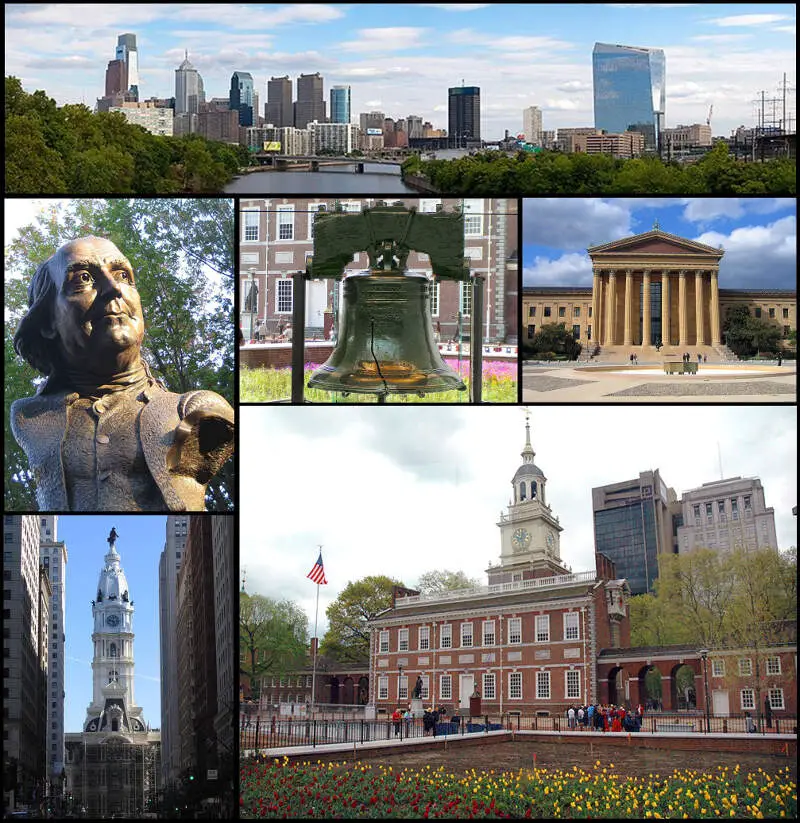
% Asian: 7.91%
# Of Asian Residents: 124,921
More on Philadelphia: Data | Cost Of Living | Movers
/10
Population: 5,247
% Asian: 6.82%
# Of Asian Residents: 358
More on Collegeville: Data | Crime | Cost Of Living | Movers

/10
Population: 8,254
% Asian: 6.8%
# Of Asian Residents: 561
More on Gettysburg: Data | Cost Of Living | Movers

/10
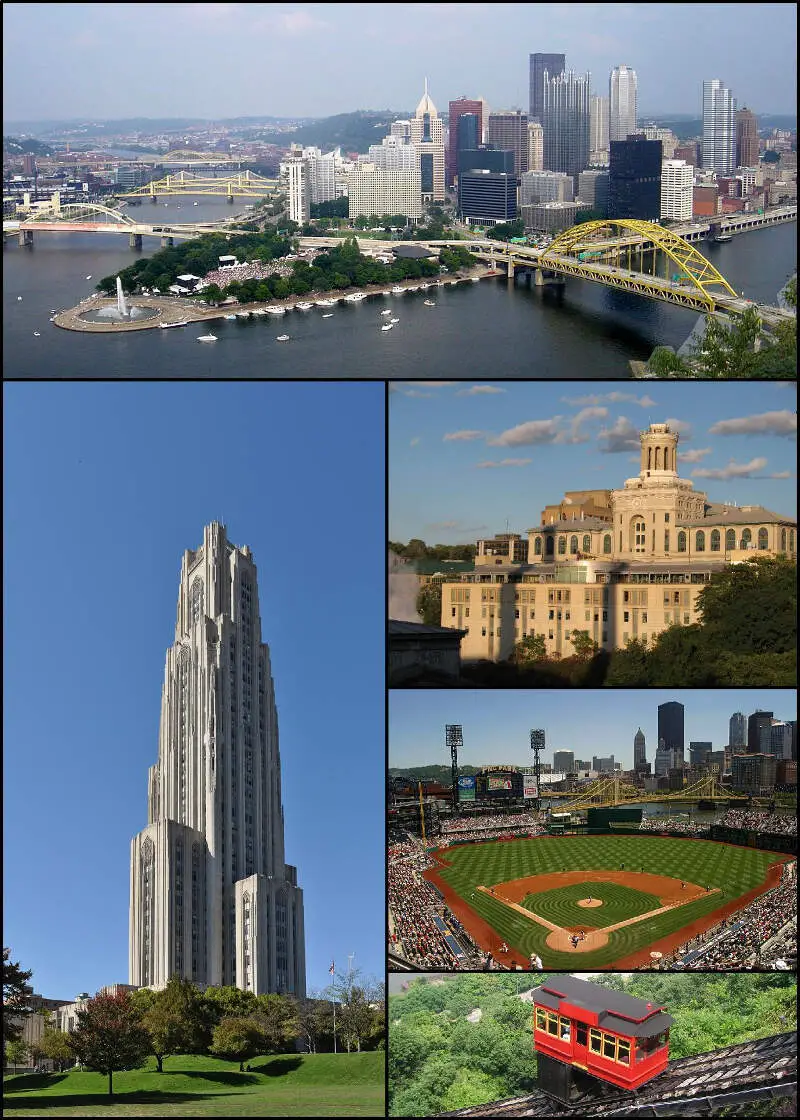
Population: 304,759
% Asian: 6.11%
# Of Asian Residents: 18,635
More on Pittsburgh: Data | Cost Of Living | Movers
Methodology: How We Determined The Cities In Pennsylvania With The Largest Asian Population For 2026
We used Saturday Night Science to compare Census data on race across every place in Pennsylvania.
The Census’s most recently available data comes from the 2020-2024 American Community Survey.
Specifically, we looked at table B03002: Hispanic OR LATINO ORIGIN BY RACE. Here are the category names as defined by the Census:
- Hispanic or Latino
- White alone*
- Black or African American alone*
- American Indian and Alaska Native alone*
- Asian alone*
- Native Hawaiian and Other Pacific Islander alone*
- Some other race alone*
- Two or more races*
Our particular column of interest here was the number of people who identified as Asian alone.
We limited our analysis to cities with a population greater than 5,000 people. That left us with 184 cities.
We then calculated the percentage of residents that are Asian. The percentages ranked from 15.3% to 0.0%.
Finally, we ranked each city based on the percentage of Asian population, with a higher score being more Asian than a lower score. Downin took the distinction of being the most Asian, while Franklin was the least Asian city.
We updated this article for 2026. This report reflects our eleventh time ranking the cities in Pennsylvania with the largest Asian population.
Read on for more information on how the cities in Pennsylvania ranked by population of Asian residents or, for a more general take on diversity in America, head over to our ranking of the most diverse cities in America.
Summary: Asian Populations Across Pennsylvania
If you’re looking for a breakdown of Asian populations across Pennsylvania according to the most recent data, this is an accurate list.
The most Asian cities in Pennsylvania are Downin, Lansdale, Whitehall, Franklin Park, State College, Baldwin, Philadelphia, Collegeville, Gettysburg, and Pittsburgh.
If you’re curious enough, here are the least Asian places in Pennsylvania:
- Franklin
- Columbia
- Schuylkill Haven
For more Pennsylvania reading, check out:
- Best Places To Retire In Pennsylvania
- Richest Cities In Pennsylvania
- Best Places To Raise A Family In Pennsylvania
Table: Asian Population By City In Pennsylvania
| Rank | City | Population | Asian Population | % Asian |
|---|---|---|---|---|
| 1 | Downin | 8,255 | 1,263 | 15.3% |
| 2 | Lansdale | 19,011 | 2,906 | 15.29% |
| 3 | Whitehall | 14,811 | 2,130 | 14.38% |
| 4 | Franklin Park | 15,235 | 2,071 | 13.59% |
| 5 | State College | 41,050 | 3,841 | 9.36% |
| 6 | Baldwin | 21,057 | 1,773 | 8.42% |
| 7 | Philadelphia | 1,579,706 | 124,921 | 7.91% |
| 8 | Collegeville | 5,247 | 358 | 6.82% |
| 9 | Gettysburg | 8,254 | 561 | 6.8% |
| 10 | Pittsburgh | 304,759 | 18,635 | 6.11% |
| 11 | Swarthmore | 6,550 | 392 | 5.98% |
| 12 | Canonsburg | 9,675 | 533 | 5.51% |
| 13 | Scranton | 76,033 | 3,999 | 5.26% |
| 14 | Norwood | 5,934 | 306 | 5.16% |
| 15 | Fox Chapel | 5,246 | 262 | 4.99% |
| 16 | Media | 5,870 | 290 | 4.94% |
| 17 | Hatboro | 8,283 | 394 | 4.76% |
| 18 | Morrisville | 9,752 | 460 | 4.72% |
| 19 | Souderton | 7,181 | 331 | 4.61% |
| 20 | New Holland | 5,780 | 261 | 4.52% |
| 21 | Quake | 9,319 | 418 | 4.49% |
| 22 | Exeter | 5,541 | 241 | 4.35% |
| 23 | Collingdale | 8,897 | 385 | 4.33% |
| 24 | Camp Hill | 8,169 | 353 | 4.32% |
| 25 | Jefferson Hills | 12,317 | 511 | 4.15% |
| 26 | Red Lion | 6,516 | 270 | 4.14% |
| 27 | Millersville | 8,982 | 370 | 4.12% |
| 28 | Phoenixville | 19,452 | 799 | 4.11% |
| 29 | Wilson | 8,183 | 329 | 4.02% |
| 30 | Lewisburg | 5,257 | 199 | 3.79% |
| 31 | Middl | 9,632 | 341 | 3.54% |
| 32 | Swissvale | 8,418 | 290 | 3.44% |
| 33 | Pott | 23,476 | 785 | 3.34% |
| 34 | Castle Shannon | 8,209 | 245 | 2.98% |
| 35 | Emmaus | 11,889 | 352 | 2.96% |
| 36 | Lancaster | 57,719 | 1,697 | 2.94% |
| 37 | Crafton | 5,961 | 174 | 2.92% |
| 38 | New Cumberland | 7,580 | 218 | 2.88% |
| 39 | Moosic | 5,973 | 171 | 2.86% |
| 40 | Milton | 6,534 | 187 | 2.86% |
| 41 | Taylor | 6,265 | 179 | 2.86% |
| 42 | Prospect Park | 6,417 | 183 | 2.85% |
| 43 | Bethlehem | 77,956 | 2,177 | 2.79% |
| 44 | Pleasant Hills | 8,399 | 233 | 2.77% |
| 45 | Dickson City | 6,023 | 166 | 2.76% |
| 46 | Erie | 93,850 | 2,586 | 2.76% |
| 47 | Carnegie | 7,978 | 218 | 2.73% |
| 48 | Carlisle | 21,852 | 579 | 2.65% |
| 49 | Doyle | 8,341 | 219 | 2.63% |
| 50 | East Stroudsburg | 9,319 | 239 | 2.56% |
| 51 | Ambler | 6,847 | 173 | 2.53% |
| 52 | South Williamsport | 6,211 | 154 | 2.48% |
| 53 | Lititz | 9,619 | 235 | 2.44% |
| 54 | Dunmore | 14,181 | 334 | 2.36% |
| 55 | Wilkinsburg | 14,027 | 322 | 2.3% |
| 56 | Mechanicsburg | 9,720 | 222 | 2.28% |
| 57 | Clifton Heights | 6,832 | 154 | 2.25% |
| 58 | Harrisburg | 50,287 | 1,110 | 2.21% |
| 59 | Norri | 35,893 | 753 | 2.1% |
| 60 | West Chester | 20,666 | 432 | 2.09% |
| 61 | Brentwood | 9,866 | 204 | 2.07% |
| 62 | Bradford | 7,683 | 158 | 2.06% |
| 63 | Wyomissing | 11,172 | 225 | 2.01% |
| 64 | Palmyra | 7,755 | 153 | 1.97% |
| 65 | Nazareth | 6,043 | 119 | 1.97% |
| 66 | Bellefonte | 6,009 | 118 | 1.96% |
| 67 | Allentown | 125,976 | 2,419 | 1.92% |
| 68 | Washington | 13,368 | 247 | 1.85% |
| 69 | Conshohocken | 9,282 | 168 | 1.81% |
| 70 | Grove City | 7,830 | 140 | 1.79% |
| 71 | Selinsgrove | 5,593 | 98 | 1.75% |
| 72 | Old Forge | 8,573 | 149 | 1.74% |
| 73 | Elizabet | 11,925 | 199 | 1.67% |
| 74 | Folcroft | 6,772 | 113 | 1.67% |
| 75 | Easton | 29,739 | 477 | 1.6% |
| 76 | Wilkes-Barre | 44,423 | 712 | 1.6% |
| 77 | Lansdowne | 11,122 | 177 | 1.59% |
| 78 | Kingston | 13,397 | 210 | 1.57% |
| 79 | Clearfield | 5,873 | 92 | 1.57% |
| 80 | Meadville | 12,577 | 194 | 1.54% |
| 81 | Turtle Creek | 5,007 | 76 | 1.52% |
| 82 | Ephrata | 13,772 | 204 | 1.48% |
| 83 | Hanover | 16,584 | 244 | 1.47% |
| 84 | Edinboro | 5,440 | 80 | 1.47% |
| 85 | Huntingdon | 6,897 | 100 | 1.45% |
| 86 | Williamsport | 27,612 | 392 | 1.42% |
| 87 | Plum | 26,723 | 359 | 1.34% |
| 88 | Glenolden | 7,220 | 96 | 1.33% |
| 89 | Bristol | 9,902 | 131 | 1.32% |
| 90 | Pittston | 7,626 | 100 | 1.31% |
| 91 | Beaver Falls | 8,850 | 111 | 1.25% |
| 92 | Lehighton | 5,268 | 65 | 1.23% |
| 93 | Waynesboro | 11,047 | 134 | 1.21% |
| 94 | Connellsville | 6,849 | 83 | 1.21% |
| 95 | Lebanon | 26,536 | 316 | 1.19% |
| 96 | Hollidaysburg | 5,558 | 64 | 1.15% |
| 97 | Mount Joy | 8,344 | 94 | 1.13% |
| 98 | Greensburg | 14,741 | 166 | 1.13% |
| 99 | Lewi | 8,479 | 89 | 1.05% |
| 100 | Jeannette | 8,657 | 90 | 1.04% |
| 101 | Somerset | 5,944 | 61 | 1.03% |
| 102 | Ridley Park | 7,261 | 74 | 1.02% |
| 103 | Johnstown | 18,087 | 181 | 1.0% |
| 104 | Bloomsburg | 13,024 | 130 | 1.0% |
| 105 | York | 44,938 | 428 | 0.95% |
| 106 | Lock Haven | 8,447 | 79 | 0.94% |
| 107 | Northampton | 10,400 | 96 | 0.92% |
| 108 | West Mifflin | 19,190 | 176 | 0.92% |
| 109 | Indiana | 14,212 | 125 | 0.88% |
| 110 | Hermitage | 16,041 | 141 | 0.88% |
| 111 | Oil City | 9,468 | 83 | 0.88% |
| 112 | Bellevue | 8,128 | 70 | 0.86% |
| 113 | Chambersburg | 22,319 | 187 | 0.84% |
| 114 | Altoona | 43,196 | 351 | 0.81% |
| 115 | Chester | 33,619 | 266 | 0.79% |
| 116 | Uniontown | 9,742 | 76 | 0.78% |
| 117 | Titusville | 5,189 | 40 | 0.77% |
| 118 | Mckees Rocks | 5,786 | 44 | 0.76% |
| 119 | Mckeesport | 17,380 | 115 | 0.66% |
| 120 | Forest Hills | 6,286 | 41 | 0.65% |
| 121 | Coatesville | 13,353 | 85 | 0.64% |
| 122 | Sayre | 5,431 | 34 | 0.63% |
| 123 | Corry | 6,116 | 38 | 0.62% |
| 124 | Aliquippa | 9,079 | 55 | 0.61% |
| 125 | Steelton | 6,296 | 36 | 0.57% |
| 126 | Stroudsburg | 5,894 | 33 | 0.56% |
| 127 | Lower Burrell | 11,633 | 62 | 0.53% |
| 128 | Butler | 13,212 | 70 | 0.53% |
| 129 | Coraopolis | 5,417 | 26 | 0.48% |
| 130 | Reading | 95,242 | 437 | 0.46% |
| 131 | West View | 6,533 | 29 | 0.44% |
| 132 | Warren | 9,240 | 39 | 0.42% |
| 133 | Archbald | 7,404 | 29 | 0.39% |
| 134 | Monessen | 6,780 | 26 | 0.38% |
| 135 | Ellwood City | 7,532 | 27 | 0.36% |
| 136 | Helle | 6,118 | 20 | 0.33% |
| 137 | Brookhaven | 8,331 | 27 | 0.32% |
| 138 | Clarks Summit | 5,073 | 16 | 0.32% |
| 139 | Munhall | 10,548 | 33 | 0.31% |
| 140 | Shillington | 5,492 | 17 | 0.31% |
| 141 | Darby | 10,687 | 33 | 0.31% |
| 142 | Dormont | 8,063 | 24 | 0.3% |
| 143 | Monaca | 5,519 | 16 | 0.29% |
| 144 | Sharon | 12,936 | 36 | 0.28% |
| 145 | Hazleton | 30,111 | 83 | 0.28% |
| 146 | Olyphant | 5,381 | 14 | 0.26% |
| 147 | Pottsville | 13,364 | 33 | 0.25% |
| 148 | Yeadon | 12,181 | 27 | 0.22% |
| 149 | Dubois | 7,402 | 16 | 0.22% |
| 150 | Kennett Square | 6,243 | 13 | 0.21% |
| 151 | Bangor | 5,163 | 10 | 0.19% |
| 152 | Oakmont | 6,702 | 11 | 0.16% |
| 153 | St. Marys | 12,529 | 20 | 0.16% |
| 154 | Berwick | 10,317 | 15 | 0.15% |
| 155 | Mount Carmel | 5,677 | 7 | 0.12% |
| 156 | Perkasie | 9,216 | 11 | 0.12% |
| 157 | Tyrone | 5,377 | 6 | 0.11% |
| 158 | White Oak | 7,468 | 8 | 0.11% |
| 159 | Blakely | 6,662 | 6 | 0.09% |
| 160 | Economy | 9,005 | 8 | 0.09% |
| 161 | New Kensington | 12,011 | 10 | 0.08% |
| 162 | New Brighton | 5,567 | 4 | 0.07% |
| 163 | Vandergrift | 5,011 | 1 | 0.02% |
| 164 | Birdsboro | 5,116 | 0 | 0.0% |
| 165 | Nanticoke | 10,653 | 0 | 0.0% |
| 166 | Duquesne | 5,149 | 0 | 0.0% |
| 167 | Plymouth | 5,770 | 0 | 0.0% |
| 168 | Ambridge | 6,890 | 0 | 0.0% |
| 169 | Shamokin | 6,853 | 0 | 0.0% |
| 170 | New Castle | 21,579 | 0 | 0.0% |
| 171 | Sharon Hill | 6,002 | 0 | 0.0% |
| 172 | Carbondale | 8,789 | 0 | 0.0% |
| 173 | Tamaqua | 6,924 | 0 | 0.0% |
| 174 | Swoyersville | 5,048 | 0 | 0.0% |
| 175 | Catasauqua | 6,541 | 0 | 0.0% |
| 176 | Sunbury | 9,617 | 0 | 0.0% |
| 177 | Greenville | 5,523 | 0 | 0.0% |
| 178 | Palmerton | 5,622 | 0 | 0.0% |
| 179 | Clairton | 6,044 | 0 | 0.0% |
| 180 | Punxsutawney | 5,665 | 0 | 0.0% |
| 181 | Shippensburg | 5,620 | 0 | 0.0% |
| 182 | Schuylkill Haven | 5,253 | 0 | 0.0% |
| 183 | Columbia | 10,278 | 0 | 0.0% |
| 184 | Franklin | 5,984 | 0 | 0.0% |