Most Asian cities in Ohio research summary. We analyzed Ohio’s most recent Census data to determine the most Asian cities in Ohio based on the percentage of Asian residents.
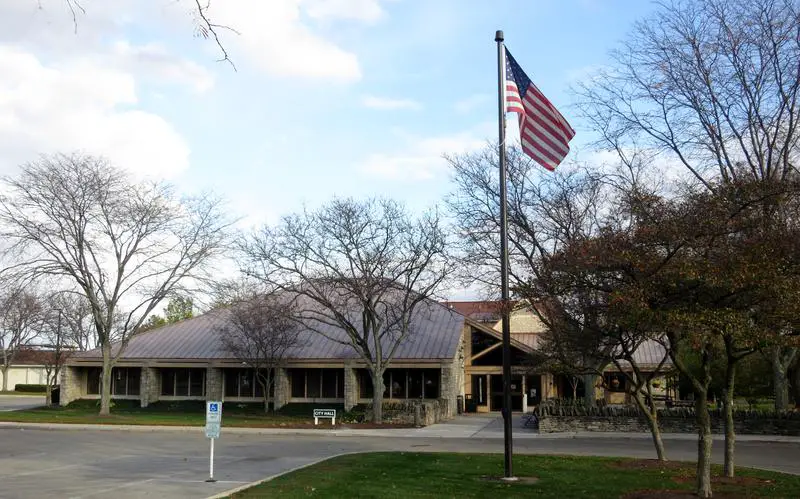
18.9% Asian · #1 most Asian in Ohio
Dublin is an affluent city in Franklin, Delaware, and Union counties in the U.S. state of Ohio. The population was 41,751 at the 2010 census. Dublin is a suburb of Columbus, Ohio.
Data | Crime | Cost of living | Movers
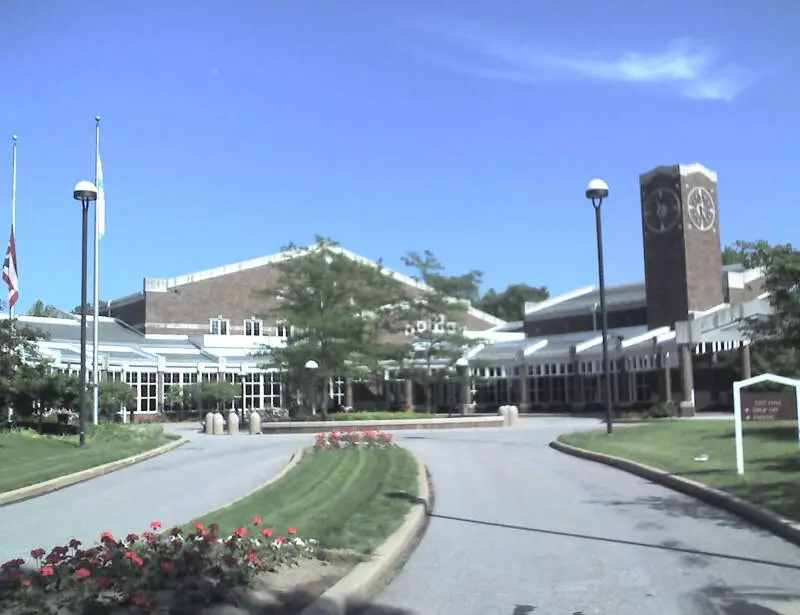
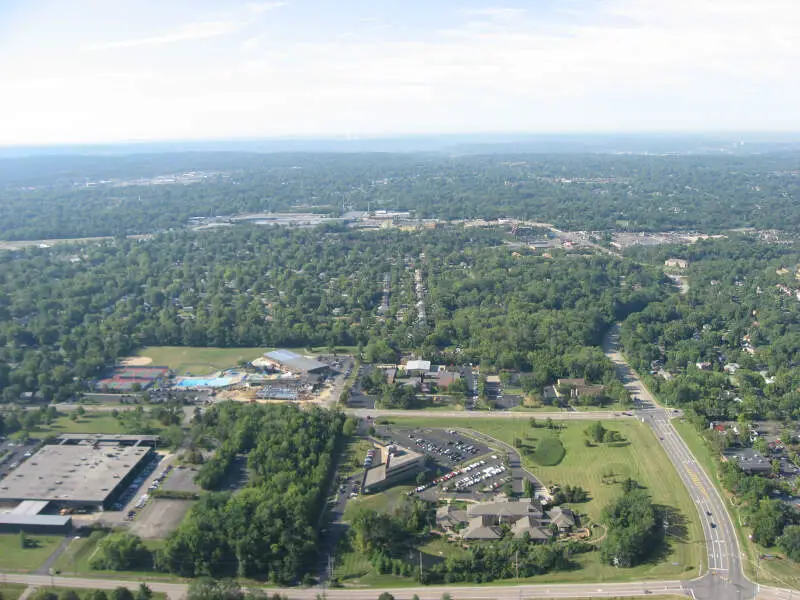
15.8% Asian · #2 most Asian in Ohio
Solon is a city in Cuyahoga County, Ohio, United States, and is a suburb of Cleveland. It is part of Northeast Ohio’s combined Cleveland-Akron-Canton metropolitan area, the 15th-largest Combined Statistical Area in the country. According to the United States Census Bureau, in 2012, the city population was estimated at 23,160.
Data | Crime | Cost of living | Movers
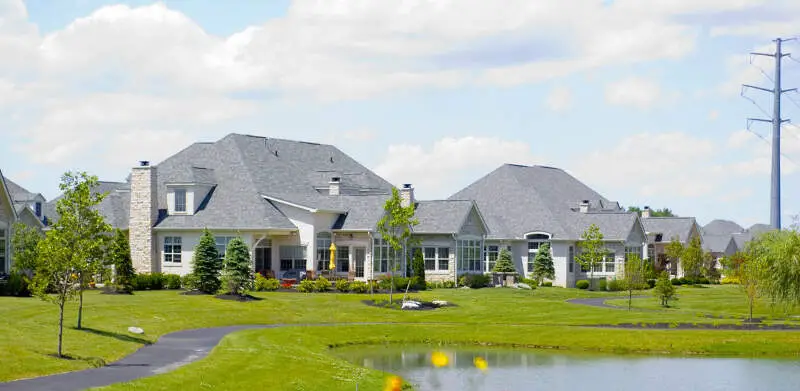
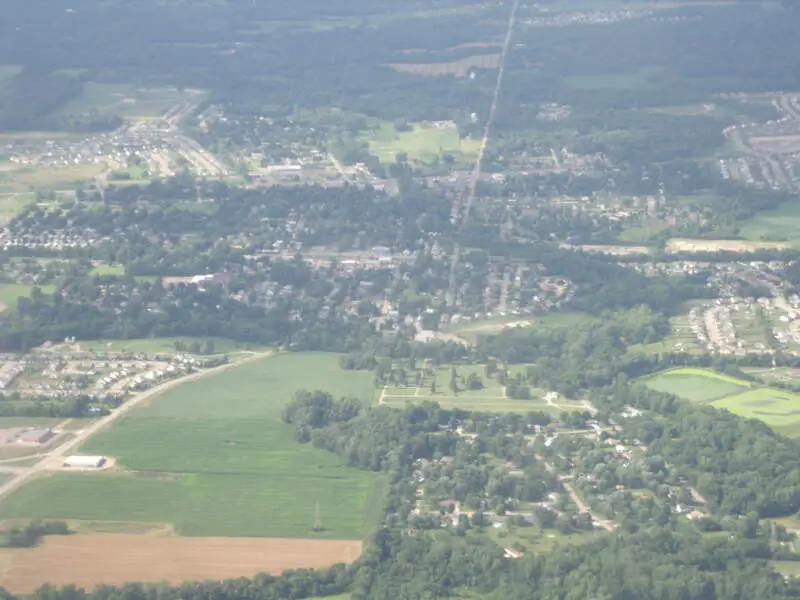
14.7% Asian · #3 most Asian in Ohio
owell is an affluent city in Delaware County, Ohio, United States. The population was 11,500 at the 2010 census.
The community was first settled around 1801, two years before Ohio became a state. It was named “Middlebury” at the time, because the first settlers came from the Middlebury, Connecticut area. In 1857, Judge Thomas Powell established the first post office in the community, and the residents decided to adopt his name. The town of Powell had its start in the building of the railroad through that territory. Powell was finally incorporated as a municipality in 1947. The population remained small until the late 1980s, when residential development expanding from the northern Columbus metropolitan area reached Powell. In twenty years, the population rose from less than 400 to over 6,000.
Data | Crime | Cost of living | Movers
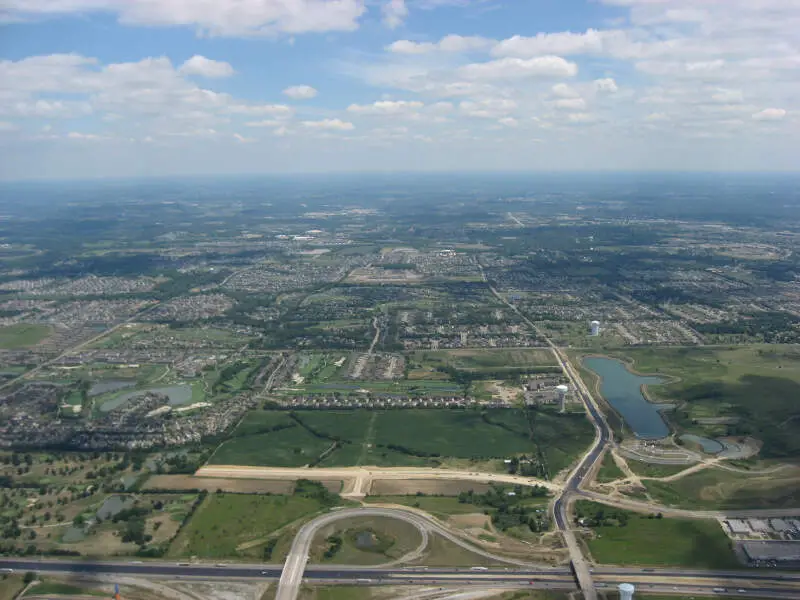
14.0% Asian · #4 most Asian in Ohio
Mason is a city in southwestern Warren County, Ohio, United States, approximately 22 miles from downtown Cincinnati. As of the 2010 census, Mason’s population was 30,712.
Data | Crime | Cost of living | Movers
13.0% Asian · #5 most Asian in Ohio
Blue Ash is a city in Hamilton County, Ohio, United States, and an inner suburb of Cincinnati, which is located to the south. The population was 12,114 at the 2010 census.
Data | Crime | Cost of living | Movers
12.2% Asian · #6 most Asian in Ohio
Pataskala is a city in Licking County, Ohio, United States. The population was 14,962 at the 2010 census. Pataskala was a small community until 1996, when what was then the village of Pataskala merged with Lima Township, vastly increasing its population and geographic area.
Data | Crime | Cost of living | Movers
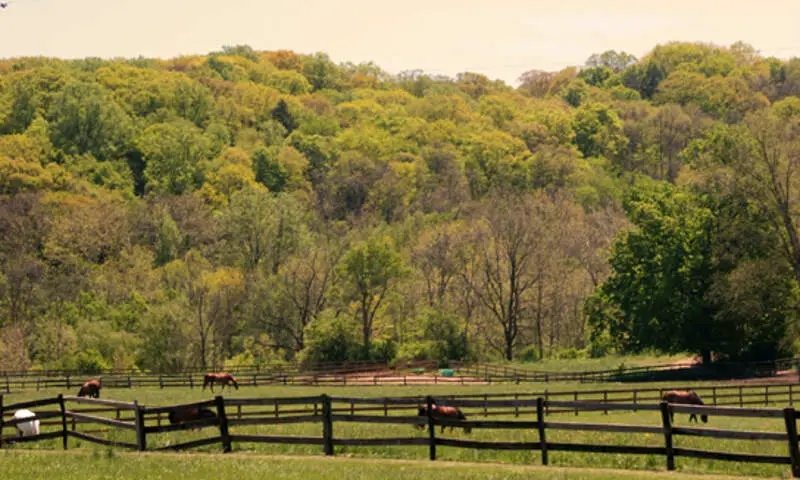
11.3% Asian · #7 most Asian in Ohio
Pepper Pike is an affluent eastern suburb of the Greater Cleveland area in the US state of Ohio. The population was 5,979 at the 2010 census.
Data | Crime | Cost of living | Movers
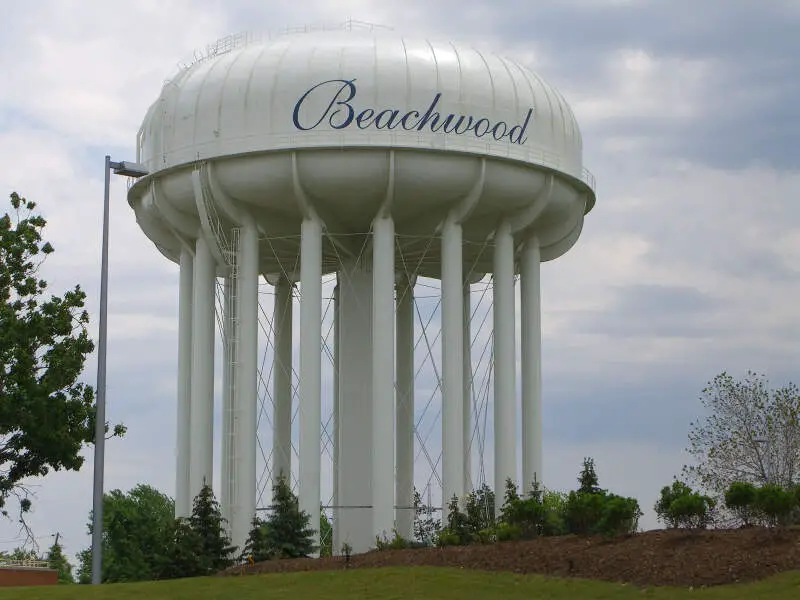
9.3% Asian · #8 most Asian in Ohio
Beachwood is a city in Cuyahoga County, Ohio, United States, and a suburb of Cleveland. As of the 2010 census the city’s population was 11,953.
Data | Crime | Cost of living | Movers
8.4% Asian · #9 most Asian in Ohio
Middleburg Heights is a city in Cuyahoga County, Ohio, United States. The population was 15,946 at the 2010 census.
Data | Crime | Cost of living | Movers
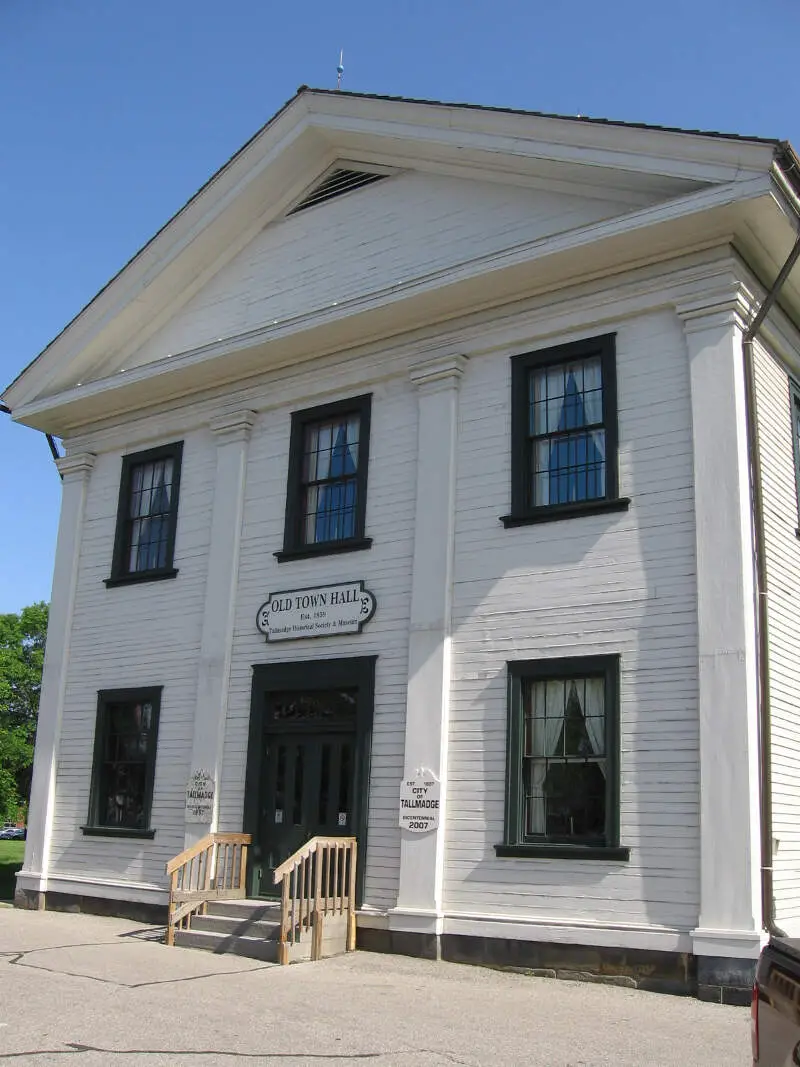
8.3% Asian · #10 most Asian in Ohio
Tallmadge is a city in Summit and Portage counties in Ohio, United States. It is a suburb of Akron and part of the Akron Metropolitan Statistical Area. The population was 17,537 at the 2010 census. Tallmadge was founded in 1807 and is the second-oldest city in Summit County, following Hudson, which was founded in 1799.
Data | Crime | Cost of living | Movers
The receipts
Compare the top ten
Pick a metric. The bars rescale. The red line is Ohio’s statewide median.
On the map
Where Ohio’s Asian communities live
Saturday Night Science
Methodology: How We Determined The Cities In Ohio With The Largest Asian Population For 2026
We used Saturday Night Science to compare Census data on race across every place in Ohio.
The Census’s most recently available data comes from the 2020-2024 American Community Survey.
Specifically, we looked at table B03002: Hispanic OR LATINO ORIGIN BY RACE. Here are the category names as defined by the Census:
- Hispanic or Latino
- White alone*
- Black or African American alone*
- American Indian and Alaska Native alone*
- Asian alone*
- Native Hawaiian and Other Pacific Islander alone*
- Some other race alone*
- Two or more races*
Our particular column of interest here was the number of people who identified as Asian alone.
We limited our analysis to cities with a population greater than 5,000 people. That left us with 243 cities.
We then calculated the percentage of residents that are Asian. The percentages ranked from 18.9% to 0.0%.
Finally, we ranked each city based on the percentage of Asian population, with a higher percentage being more Asian. Dublin took the distinction of being the most Asian, while Girard was the least Asian city.
We updated this article for 2026. This report reflects our eleventh time ranking the cities in Ohio with the largest Asian population.
The full plate
Cities In Ohio By Asian Population
Click any column to sort. Search by city name.
| Rank | City | Population | Asian Population | % Asian |
|---|---|---|---|---|
| 1 | Dublin | 49,294 | 9,326 | 18.9% |
| 2 | Solon | 23,943 | 3,780 | 15.8% |
| 3 | Powell | 14,451 | 2,128 | 14.7% |
| 4 | Mason | 35,509 | 4,961 | 14.0% |
| 5 | Blue Ash | 13,455 | 1,753 | 13.0% |
| 6 | Pataskala | 18,223 | 2,217 | 12.2% |
| 7 | Pepper Pike | 6,840 | 776 | 11.3% |
| 8 | Beachwood | 13,865 | 1,294 | 9.3% |
| 9 | Middleburg Heights | 15,786 | 1,324 | 8.4% |
| 10 | Tallmadge | 18,335 | 1,515 | 8.3% |
| 11 | Twinsburg | 19,410 | 1,558 | 8.0% |
| 12 | Oxford | 21,753 | 1,723 | 7.9% |
| 13 | Granville | 5,999 | 466 | 7.8% |
| 14 | Mayfield Heights | 20,022 | 1,547 | 7.7% |
| 15 | Macedonia | 12,152 | 928 | 7.6% |
| 16 | Fairfield | 44,828 | 3,301 | 7.4% |
| 17 | Munroe Falls | 5,000 | 353 | 7.1% |
| 18 | Hilliard | 38,033 | 2,665 | 7.0% |
| 19 | Pickerington | 24,477 | 1,653 | 6.8% |
| 20 | Highland Heights | 8,623 | 578 | 6.7% |
| 21 | Brooklyn | 11,158 | 744 | 6.7% |
| 22 | Upper Arlington | 36,293 | 2,413 | 6.6% |
| 23 | Strongsville | 45,983 | 2,823 | 6.1% |
| 24 | Westlake | 34,104 | 2,086 | 6.1% |
| 25 | Cleveland Heights | 44,497 | 2,675 | 6.0% |
| 26 | Columbus | 914,802 | 54,326 | 5.9% |
| 27 | Delaware | 44,589 | 2,612 | 5.9% |
| 28 | Reynoldsburg | 41,224 | 2,350 | 5.7% |
| 29 | Springdale | 11,033 | 610 | 5.5% |
| 30 | The Village of Indian Hill | 6,052 | 334 | 5.5% |
| 31 | Seven Hills | 11,603 | 627 | 5.4% |
| 32 | Beavercreek | 47,126 | 2,363 | 5.0% |
| 33 | Brookville | 5,779 | 282 | 4.9% |
| 34 | Akron | 189,247 | 9,203 | 4.9% |
| 35 | Cuyahoga Falls | 50,909 | 2,333 | 4.6% |
| 36 | Avon | 25,317 | 1,150 | 4.5% |
| 37 | Perrysburg | 25,181 | 1,137 | 4.5% |
| 38 | Fairlawn | 7,711 | 346 | 4.5% |
| 39 | Streetsboro | 17,661 | 778 | 4.4% |
| 40 | Stow | 34,240 | 1,459 | 4.3% |
| 41 | Sharonville | 14,030 | 597 | 4.3% |
| 42 | Willoughby Hills | 9,975 | 423 | 4.2% |
| 43 | Broadview Heights | 19,771 | 818 | 4.1% |
| 44 | Loveland | 13,197 | 539 | 4.1% |
| 45 | Bellbrook | 7,394 | 296 | 4.0% |
| 46 | Troy | 26,842 | 1,073 | 4.0% |
| 47 | Oberlin | 8,329 | 328 | 3.9% |
| 48 | North Royalton | 30,972 | 1,179 | 3.8% |
| 49 | Monroe | 15,401 | 583 | 3.8% |
| 50 | Shaker Heights | 28,922 | 1,090 | 3.8% |
| 51 | Franklin | 11,712 | 432 | 3.7% |
| 52 | Madeira | 9,484 | 343 | 3.6% |
| 53 | Hudson | 23,039 | 832 | 3.6% |
| 54 | Forest Park | 20,025 | 722 | 3.6% |
| 55 | Montgomery | 10,855 | 391 | 3.6% |
| 56 | Kent | 27,116 | 967 | 3.6% |
| 57 | Aurora | 17,581 | 624 | 3.5% |
| 58 | Huber Heights | 43,455 | 1,538 | 3.5% |
| 59 | Norton | 11,524 | 400 | 3.5% |
| 60 | Brecksville | 13,692 | 471 | 3.4% |
| 61 | Mentor | 47,171 | 1,611 | 3.4% |
| 62 | Green | 27,393 | 897 | 3.3% |
| 63 | Athens | 23,396 | 759 | 3.2% |
| 64 | Gahanna | 35,486 | 1,134 | 3.2% |
| 65 | Parma Heights | 20,581 | 650 | 3.2% |
| 66 | Canal Fulton | 5,337 | 167 | 3.1% |
| 67 | Lakewood | 50,007 | 1,561 | 3.1% |
| 68 | Sylvania | 19,055 | 593 | 3.1% |
| 69 | Martins Ferry | 6,140 | 184 | 3.0% |
| 70 | Parma | 79,870 | 2,380 | 3.0% |
| 71 | Whitehall | 20,019 | 583 | 2.9% |
| 72 | Miamisburg | 19,948 | 576 | 2.9% |
| 73 | Springboro | 19,980 | 574 | 2.9% |
| 74 | Wyoming | 8,723 | 248 | 2.8% |
| 75 | Riverside | 24,435 | 694 | 2.8% |
| 76 | Westerville | 38,645 | 1,071 | 2.8% |
| 77 | Jackson | 6,231 | 171 | 2.7% |
| 78 | Grandview Heights | 8,647 | 235 | 2.7% |
| 79 | Cincinnati | 311,224 | 8,154 | 2.6% |
| 80 | Cleveland | 366,097 | 9,547 | 2.6% |
| 81 | Moraine | 6,536 | 159 | 2.4% |
| 82 | Tipp City | 10,439 | 243 | 2.3% |
| 83 | Northwood | 5,193 | 119 | 2.3% |
| 84 | Vandalia | 15,053 | 341 | 2.3% |
| 85 | Columbiana | 6,903 | 155 | 2.2% |
| 86 | Findlay | 40,287 | 904 | 2.2% |
| 87 | Wooster | 26,971 | 602 | 2.2% |
| 88 | Centerville | 25,205 | 554 | 2.2% |
| 89 | Ontario | 6,667 | 146 | 2.2% |
| 90 | Rocky River | 21,490 | 460 | 2.1% |
| 91 | Amherst | 12,906 | 274 | 2.1% |
| 92 | South Euclid | 21,534 | 447 | 2.1% |
| 93 | Worthington | 14,938 | 305 | 2.0% |
| 94 | Oakwood | 9,458 | 191 | 2.0% |
| 95 | London | 10,484 | 207 | 2.0% |
| 96 | North Olmsted | 31,924 | 618 | 1.9% |
| 97 | Bowling Green | 29,983 | 576 | 1.9% |
| 98 | University Heights | 13,394 | 257 | 1.9% |
| 99 | Grove City | 42,517 | 794 | 1.9% |
| 100 | Bucyrus | 11,594 | 210 | 1.8% |
Source: U.S. Census ACS 2020-2024. 243 cities with more than 5,000 residents.
Summary
Summary: Asian Populations Across Ohio
If you’re looking for a breakdown of Asian populations across Ohio according to the most recent data, this is an accurate list.
The most Asian cities in Ohio are Dublin, Solon, Powell, Mason, Blue Ash, Pataskala, Pepper Pike, Beachwood, Middleburg Heights, and Tallmadge.


