We all love the biggest cities that the Magnolia State has to offer. You know the places like Jackson and Gulfport which make all the headlines.
But there are a bunch of other great large cities in Mississippi that don't get as much love.
We're going to change that right now.
Using the most recent Census data, we can tell you about all the places in Mississippi with a focus on the biggest. We update the data each year and this is our fourth time doing this.
The Largest Cities In Mississippi For 2026:
You can click here to see a full table of the 100 biggest cities in Mississippi, along with every other place over 1,000 people big. It is sortable by clicking on the headers.
Read on below to see more on the biggest cities. Or for more reading on places to live in Mississippi, check out:
- Best Places To Live In Mississippi
- Cheapest Places To Live In Mississippi
- Most Dangerous Cities In Mississippi
The 10 Biggest Cities In Mississippi

/10
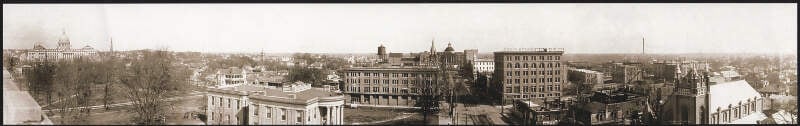
Rank Last Year: 1 (No Change)
Population: 146,631.0
Population 2010: 175,489
Growth: -16.4%
More on Jackson: Data | Crime | Cost Of Living | Real Estate

/10
Rank Last Year: 2 (No Change)
Population: 73,003.0
Population 2010: 66,286
Growth: 10.1%
More on Gulfport: Data | Crime | Cost Of Living | Real Estate

/10
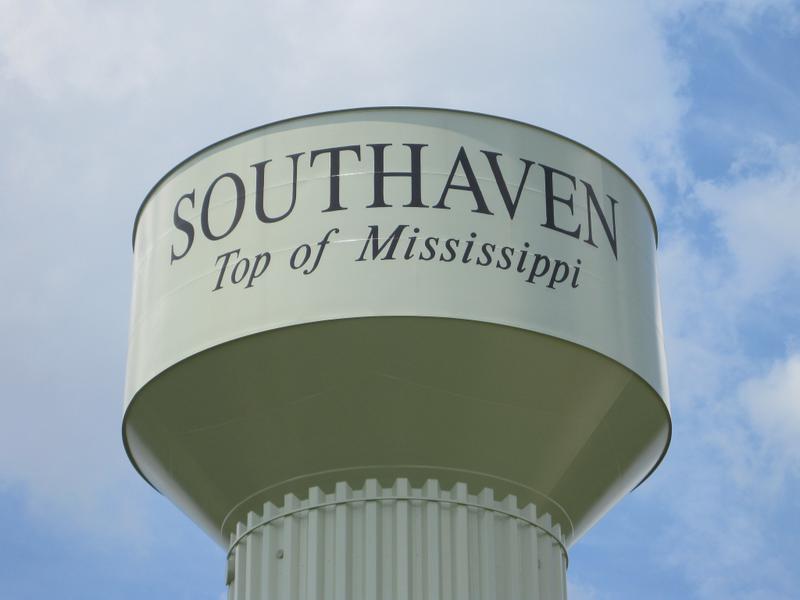
Rank Last Year: 3 (No Change)
Population: 56,226.0
Population 2010: 46,743
Growth: 20.3%
More on Southaven: Data | Crime | Cost Of Living | Real Estate

/10
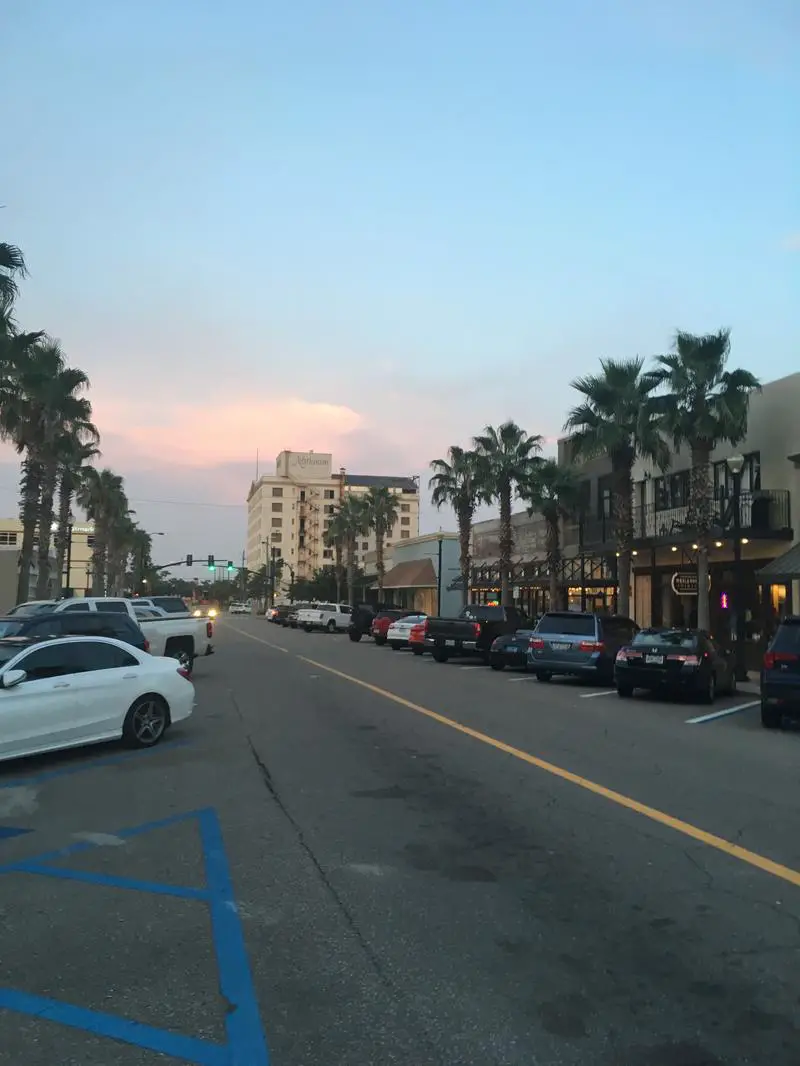
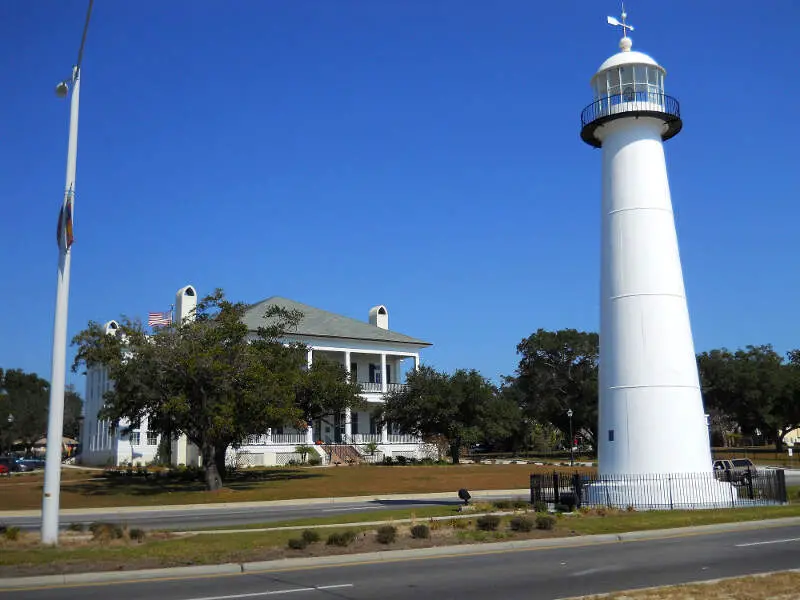
Rank Last Year: 4 (No Change)
Population: 48,861.0
Population 2010: 43,921
Growth: 11.2%
More on Biloxi: Data | Crime | Cost Of Living | Real Estate

/10
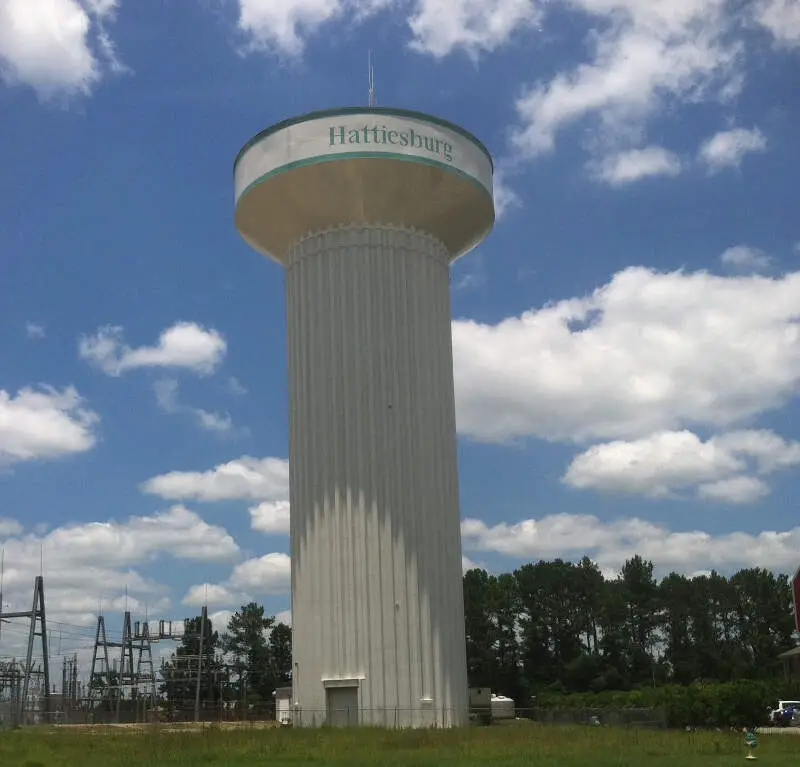
Rank Last Year: 5 (No Change)
Population: 48,619.0
Population 2010: 45,713
Growth: 6.4%
More on Hattiesburg: Data | Crime | Cost Of Living | Real Estate

/10
Rank Last Year: 6 (No Change)
Population: 47,019.0
Population 2010: 31,910
Growth: 47.3%
More on Olive Branch: Data | Crime | Cost Of Living | Real Estate

/10
Rank Last Year: 7 (No Change)
Population: 37,791.0
Population 2010: 34,363
Growth: 10.0%
More on Tupelo: Data | Cost Of Living | Real Estate

/10
Rank Last Year: 8 (No Change)
Population: 34,137.0
Population 2010: 40,927
Growth: -16.6%
More on Meridian: Data | Crime | Cost Of Living | Real Estate

/10
Rank Last Year: 9 (No Change)
Population: 28,166.0
Population 2010: 35,141
Growth: -19.8%
More on Greenville: Data | Cost Of Living | Real Estate

/10
Rank Last Year: 10 (No Change)
Population: 27,946.0
Population 2010: 23,294
Growth: 20.0%
More on Madison: Data | Crime | Cost Of Living | Real Estate
How We Determined The Largest Cities In Mississippi
We've been ranking and dissecting cities in the Magnolia State for over 4 years now -- making this actually the fourth time we've run the numbers. We always use the best data, the US Census. In this case, that means we are using the American Community Survey.
It what is probably the most simple analysis we run each year, we ranked every place in Mississippi from biggest to smallest. The biggest city this year? That would be Jackson.
The smallest? Saucier, although there are places smaller than 1,000 people not listed here, so keep that in mind as we take a look at the top ten.
Now on to numbers 11-100 Biggest in Mississippi
We hope that you find the big city, or really any city, that's right for you. Below is a list of the rest of the biggest cities along with every other place in Mississippi.
Have fun snacking around in the Magnolia State!
For more reading on Mississippi, check out:
- Best Places To Raise A Family In Mississippi
- Best Places To Retire In Mississippi
- Richest Cities In Mississippi
- Safest Places In Mississippi
- Worst Places To Live In Mississippi
- Most Expensive Places To Live In Mississippi
Detailed List Of The Biggest Cities In Mississippi
| Rank | City | Current Population | 2010 | Growth |
|---|---|---|---|---|
| 1 | Jackson | 146,631.0 | 175,489 | -16.4% |
| 2 | Gulfport | 73,003.0 | 66,286 | 10.1% |
| 3 | Southaven | 56,226.0 | 46,743 | 20.3% |
| 4 | Biloxi | 48,861.0 | 43,921 | 11.2% |
| 5 | Hattiesburg | 48,619.0 | 45,713 | 6.4% |
| 6 | Olive Branch | 47,019.0 | 31,910 | 47.3% |
| 7 | Tupelo | 37,791.0 | 34,363 | 10.0% |
| 8 | Meridian | 34,137.0 | 40,927 | -16.6% |
| 9 | Greenville | 28,166.0 | 35,141 | -19.8% |
| 10 | Madison | 27,946.0 | 23,294 | 20.0% |
| 11 | Pearl | 27,737.0 | 25,058 | 10.7% |
| 12 | Clinton | 27,195.0 | 25,142 | 8.2% |
| 13 | Horn Lake | 26,647.0 | 25,495 | 4.5% |
| 14 | Oxford | 26,411.0 | 17,990 | 46.8% |
| 15 | Starkville | 25,721.0 | 23,436 | 9.7% |
| 16 | Brandon | 25,542.0 | 21,072 | 21.2% |
| 17 | Ridgeland | 24,587.0 | 23,499 | 4.6% |
| 18 | Columbus | 23,348.0 | 23,768 | -1.8% |
| 19 | Pascagoula | 21,710.0 | 22,947 | -5.4% |
| 20 | Vicksburg | 20,589.0 | 24,189 | -14.9% |
| 21 | Gautier | 19,046.0 | 18,088 | 5.3% |
| 22 | Ocean Springs | 18,646.0 | 17,258 | 8.0% |
| 23 | Hernando | 17,949.0 | 13,253 | 35.4% |
| 24 | Laurel | 17,679.0 | 18,506 | -4.5% |
| 25 | Long Beach | 17,009.0 | 14,769 | 15.2% |
| 26 | Corinth | 14,323.0 | 14,550 | -1.6% |
| 27 | Clarksdale | 14,231.0 | 18,276 | -22.1% |
| 28 | Natchez | 14,192.0 | 16,279 | -12.8% |
| 29 | Greenwood | 14,086.0 | 15,870 | -11.2% |
| 30 | D'iberville | 13,203.0 | 8,905 | 48.3% |
| 31 | Byram | 12,799.0 | 10,511 | 21.8% |
| 32 | Grenada | 12,375.0 | 13,415 | -7.8% |
| 33 | Mccomb | 12,049.0 | 12,932 | -6.8% |
| 34 | Moss Point | 11,957.0 | 13,963 | -14.4% |
| 35 | Picayune | 11,900.0 | 11,087 | 7.3% |
| 36 | Brookhaven | 11,650.0 | 12,618 | -7.7% |
| 37 | Petal | 11,294.0 | 10,301 | 9.6% |
| 38 | Canton | 10,811.0 | 13,077 | -17.3% |
| 39 | Cleveland | 10,623.0 | 12,536 | -15.3% |
| 40 | Flowood | 10,587.0 | 7,586 | 39.6% |
| 41 | Yazoo City | 10,219.0 | 11,645 | -12.2% |
| 42 | Bay St. Louis | 10,188.0 | 9,349 | 9.0% |
| 43 | West Point | 9,900.0 | 11,467 | -13.7% |
| 44 | Diamondhead | 9,338.0 | 0 | nan% |
| 45 | Booneville | 9,246.0 | 8,755 | 5.6% |
| 46 | Indianola | 9,062.0 | 10,884 | -16.7% |
| 47 | Gulf Hills | 8,451.0 | 7,883 | 7.2% |
| 48 | Senatobia | 8,380.0 | 7,958 | 5.3% |
| 49 | St. Martin | 8,139.0 | 6,675 | 21.9% |
| 50 | New Albany | 7,663.0 | 7,999 | -4.2% |
| 51 | Batesville | 7,387.0 | 7,486 | -1.3% |
| 52 | Richland | 7,346.0 | 6,835 | 7.5% |
| 53 | Waveland | 7,062.0 | 6,490 | 8.8% |
| 54 | Philadelphia | 6,996.0 | 7,482 | -6.5% |
| 55 | Kosciusko | 6,933.0 | 7,355 | -5.7% |
| 56 | Latimer | 6,756.0 | 6,177 | 9.4% |
| 57 | West Hattiesburg | 6,715.0 | 6,516 | 3.1% |
| 58 | Holly Springs | 6,704.0 | 7,827 | -14.3% |
| 59 | Columbia | 6,632.0 | 6,573 | 0.9% |
| 60 | Amory | 6,500.0 | 7,390 | -12.0% |
| 61 | Gulf Park Estates | 6,264.0 | 5,547 | 12.9% |
| 62 | Pass Christian | 6,097.0 | 4,809 | 26.8% |
| 63 | Louisville | 5,983.0 | 6,701 | -10.7% |
| 64 | Pontotoc | 5,806.0 | 5,617 | 3.4% |
| 65 | Ripley | 5,377.0 | 5,409 | -0.6% |
| 66 | Forest | 5,357.0 | 5,711 | -6.2% |
| 67 | University | 5,315.0 | 4,363 | 21.8% |
| 68 | Vancleave | 5,078.0 | 5,385 | -5.7% |
| 69 | Leakesville | 4,959.0 | 975 | 408.6% |
| 70 | Saltillo | 4,952.0 | 4,486 | 10.4% |
| 71 | Aberdeen | 4,890.0 | 5,774 | -15.3% |
| 72 | Carthage | 4,866.0 | 5,068 | -4.0% |
| 73 | Crystal Springs | 4,752.0 | 5,174 | -8.2% |
| 74 | Florence | 4,696.0 | 0 | nan% |
| 75 | Mississippi State | 4,655.0 | 3,500 | 33.0% |
| 76 | Fulton | 4,576.0 | 3,969 | 15.3% |
| 77 | Ellisville | 4,521.0 | 4,444 | 1.7% |
| 78 | Waynesboro | 4,518.0 | 5,208 | -13.2% |
| 79 | Wiggins | 4,293.0 | 4,281 | 0.3% |
| 80 | Winona | 4,183.0 | 5,105 | -18.1% |
| 81 | Beechwood | 4,168.0 | 3,157 | 32.0% |
| 82 | Pearl River | 4,047.0 | 4,303 | -5.9% |
| 83 | New Hope | 3,952.0 | 3,002 | 31.6% |
| 84 | Magee | 3,943.0 | 4,384 | -10.1% |
| 85 | Leland | 3,777.0 | 4,591 | -17.7% |
| 86 | Houston | 3,741.0 | 3,678 | 1.7% |
| 87 | Morton | 3,656.0 | 3,452 | 5.9% |
| 88 | Hazlehurst | 3,520.0 | 4,045 | -13.0% |
| 89 | Escatawpa | 3,494.0 | 3,693 | -5.4% |
| 90 | Water Valley | 3,376.0 | 3,485 | -3.1% |
| 91 | Macon | 3,333.0 | 2,867 | 16.3% |
| 92 | Bridgetown | 3,195.0 | 1,859 | 71.9% |
| 93 | Nicholson | 3,146.0 | 3,306 | -4.8% |
| 94 | Baldwyn | 3,138.0 | 3,483 | -9.9% |
| 95 | Newton | 3,116.0 | 3,447 | -9.6% |
| 96 | Iuka | 3,110.0 | 3,043 | 2.2% |
| 97 | Magnolia | 3,059.0 | 2,607 | 17.3% |
| 98 | Lucedale | 2,995.0 | 2,934 | 2.1% |
| 99 | Poplarville | 2,847.0 | 3,016 | -5.6% |
| 100 | Verona | 2,748.0 | 3,050 | -9.9% |
| 101 | Ruleville | 2,632.0 | 3,058 | -13.9% |
| 102 | Gu | 2,594.0 | 1,925 | 34.8% |
| 103 | Hide-A-Way Lake | 2,569.0 | 1,554 | 65.3% |
| 104 | Collins | 2,455.0 | 2,602 | -5.6% |
| 105 | Summit | 2,451.0 | 1,631 | 50.3% |
| 106 | Sardis | 2,445.0 | 1,485 | 64.6% |
| 107 | Okolona | 2,430.0 | 2,748 | -11.6% |
| 108 | Hollandale | 2,378.0 | 2,800 | -15.1% |
| 109 | Flora | 2,331.0 | 1,550 | 50.4% |
| 110 | Farmington | 2,312.0 | 2,573 | -10.1% |
| 111 | Lyman | 2,298.0 | 1,804 | 27.4% |
| 112 | Cleary | 2,295.0 | 1,381 | 66.2% |
| 113 | Tunica Resorts | 2,281.0 | 1,472 | 55.0% |
| 114 | Centreville | 2,263.0 | 1,559 | 45.2% |
| 115 | Wesson | 2,250.0 | 2,068 | 8.8% |
| 116 | Eupora | 2,250.0 | 2,529 | -11.0% |
| 117 | Quitman | 2,161.0 | 2,188 | -1.2% |
| 118 | Lynchburg | 2,161.0 | 2,095 | 3.2% |
| 119 | Mooreville | 2,154.0 | 0 | nan% |
| 120 | Drew | 2,132.0 | 1,918 | 11.2% |
| 121 | Durant | 2,103.0 | 2,708 | -22.3% |
| 122 | Mendenhall | 2,103.0 | 2,532 | -16.9% |
| 123 | Union | 2,090.0 | 2,241 | -6.7% |
| 124 | Tutwiler | 2,073.0 | 3,161 | -34.4% |
| 125 | Rolling Fork | 2,038.0 | 2,173 | -6.2% |
| 126 | Marion | 2,030.0 | 1,336 | 51.9% |
| 127 | Belmont | 2,028.0 | 2,092 | -3.1% |
| 128 | Tyle | 2,024.0 | 2,083 | -2.8% |
| 129 | Kiln | 2,016.0 | 1,822 | 10.6% |
| 130 | Charleston | 1,979.0 | 2,065 | -4.2% |
| 131 | Itta Bena | 1,967.0 | 2,410 | -18.4% |
| 132 | Mantachie | 1,950.0 | 1,116 | 74.7% |
| 133 | Decatur | 1,929.0 | 2,130 | -9.4% |
| 134 | Purvis | 1,914.0 | 1,816 | 5.4% |
| 135 | Sharon | 1,910.0 | 1,498 | 27.5% |
| 136 | Delisle | 1,906.0 | 1,110 | 71.7% |
| 137 | Arnold Line | 1,859.0 | 1,578 | 17.8% |
| 138 | Bay Springs | 1,855.0 | 2,436 | -23.9% |
| 139 | Nettleton | 1,853.0 | 2,315 | -20.0% |
| 140 | Tchula | 1,802.0 | 2,214 | -18.6% |
| 141 | Ackerman | 1,792.0 | 1,792 | 0.0% |
| 142 | Calhoun City | 1,745.0 | 1,708 | 2.2% |
| 143 | Collinsville | 1,725.0 | 1,720 | 0.3% |
| 144 | Rosedale | 1,703.0 | 2,204 | -22.7% |
| 145 | Shelby | 1,700.0 | 2,207 | -23.0% |
| 146 | Fayette | 1,691.0 | 1,500 | 12.7% |
| 147 | Sumrall | 1,674.0 | 1,209 | 38.5% |
| 148 | Raymond | 1,663.0 | 2,420 | -31.3% |
| 149 | Taylorsville | 1,650.0 | 1,343 | 22.9% |
| 150 | Terry | 1,620.0 | 798 | 103.0% |
| 151 | Byhalia | 1,588.0 | 1,313 | 20.9% |
| 152 | Ecru | 1,550.0 | 994 | 55.9% |
| 153 | Shaw | 1,508.0 | 1,932 | -21.9% |
| 154 | Rawls Springs | 1,499.0 | 1,355 | 10.6% |
| 155 | Bruce | 1,483.0 | 1,658 | -10.6% |
| 156 | Mound Bayou | 1,449.0 | 1,573 | -7.9% |
| 157 | Moorhead | 1,439.0 | 2,204 | -34.7% |
| 158 | Walls | 1,426.0 | 584 | 144.2% |
| 159 | Pelahatchie | 1,423.0 | 1,577 | -9.8% |
| 160 | Caledonia | 1,414.0 | 1,104 | 28.1% |
| 161 | Shannon | 1,383.0 | 1,831 | -24.5% |
| 162 | Marks | 1,377.0 | 2,325 | -40.8% |
| 163 | Monticello | 1,351.0 | 1,837 | -26.5% |
| 164 | Lexington | 1,350.0 | 1,795 | -24.8% |
| 165 | Lumberton | 1,320.0 | 1,938 | -31.9% |
| 166 | Belzoni | 1,306.0 | 2,132 | -38.7% |
| 167 | Hurley | 1,305.0 | 1,668 | -21.8% |
| 168 | Robinhood | 1,298.0 | 1,431 | -9.3% |
| 169 | Columbus Afb | 1,293.0 | 1,645 | -21.4% |
| 170 | Pearlington | 1,278.0 | 1,075 | 18.9% |
| 171 | Port Gibson | 1,261.0 | 2,185 | -42.3% |
| 172 | Como | 1,258.0 | 1,309 | -3.9% |
| 173 | Glendale | 1,257.0 | 1,540 | -18.4% |
| 174 | Blue Mountain | 1,232.0 | 854 | 44.3% |
| 175 | Maben | 1,231.0 | 744 | 65.5% |
| 176 | Richton | 1,220.0 | 977 | 24.9% |
| 177 | Courtland | 1,205.0 | 495 | 143.4% |
| 178 | Nellieburg | 1,197.0 | 1,984 | -39.7% |
| 179 | Wade | 1,183.0 | 770 | 53.6% |
| 180 | Goodman | 1,177.0 | 1,254 | -6.1% |
| 181 | Conehatta | 1,166.0 | 1,274 | -8.5% |
| 182 | Vaiden | 1,158.0 | 1,176 | -1.5% |
| 183 | Coldwater | 1,156.0 | 1,735 | -33.4% |
| 184 | Raleigh | 1,118.0 | 1,608 | -30.5% |
| 185 | Mount Olive | 1,110.0 | 1,176 | -5.6% |
| 186 | Vardaman | 1,100.0 | 1,459 | -24.6% |
| 187 | Metcalfe | 1,068.0 | 761 | 40.3% |
| 188 | Morgantown | 1,038.0 | 1,755 | -40.9% |
| 189 | Woodville | 1,037.0 | 1,129 | -8.1% |
| 190 | State Line | 1,016.0 | 471 | 115.7% |
| 191 | Saucier | 1,014.0 | 660 | 53.6% |