We all love the biggest cities that the Beaver State has to offer. You know the places like Portland and Eugene which make all the headlines.
But there are a bunch of other great large cities in Oregon that don't get as much love.
We're going to change that right now.
Using the most recent Census data, we can tell you about all the places in Oregon with a focus on the biggest. We update the data each year and this is our fourth time doing this.
The Largest Cities In Oregon For 2026:
You can click here to see a full table of the 100 biggest cities in Oregon, along with every other place over 1,000 people big. It is sortable by clicking on the headers.
Read on below to see more on the biggest cities. Or for more reading on places to live in Oregon, check out:
The 10 Biggest Cities In Oregon

/10
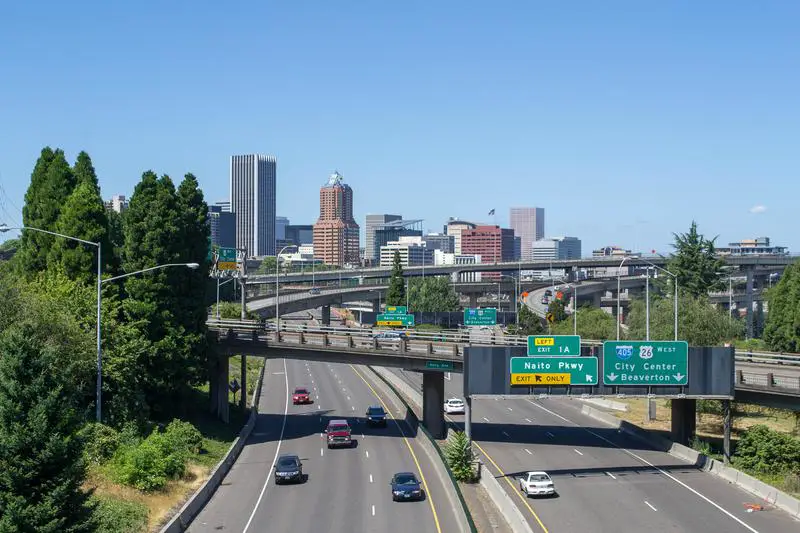
Rank Last Year: 1 (No Change)
Population: 641,165.0
Population 2010: 566,686
Growth: 13.1%
More on Portland: Data | Crime | Cost Of Living | Real Estate

/10
Rank Last Year: 2 (No Change)
Population: 179,591.0
Population 2010: 153,288
Growth: 17.2%
More on Eugene: Data | Crime | Cost Of Living | Real Estate


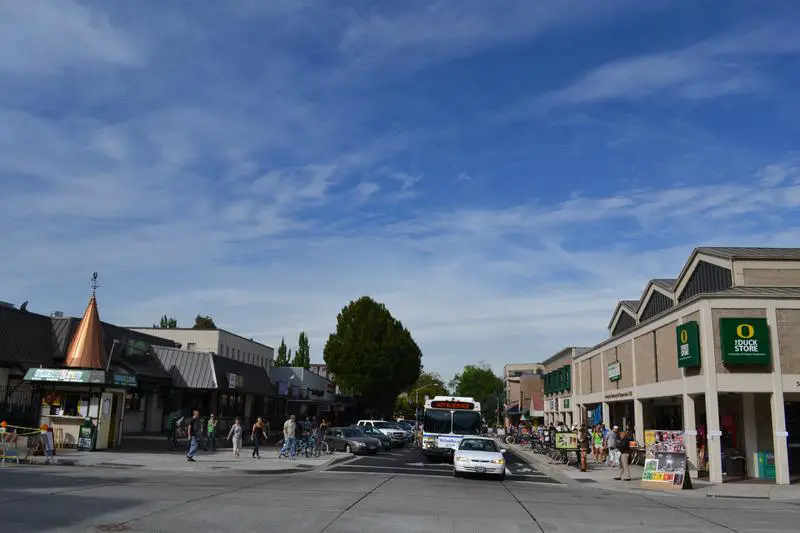
/10
Rank Last Year: 3 (No Change)
Population: 178,865.0
Population 2010: 151,809
Growth: 17.8%
More on Salem: Data | Crime | Cost Of Living | Real Estate

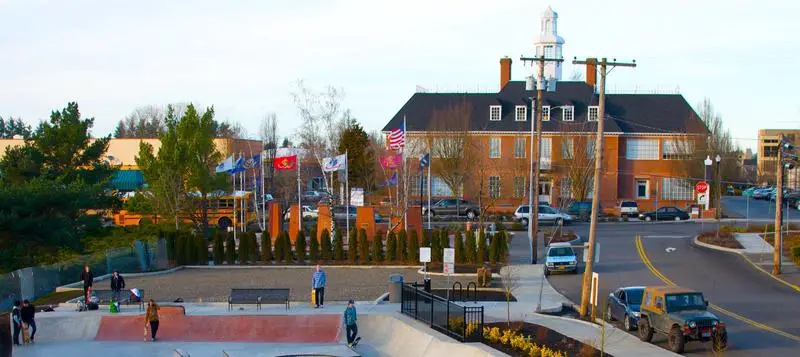
/10
Rank Last Year: 4 (No Change)
Population: 112,378.0
Population 2010: 101,450
Growth: 10.8%
More on Gresham: Data | Crime | Cost Of Living | Real Estate

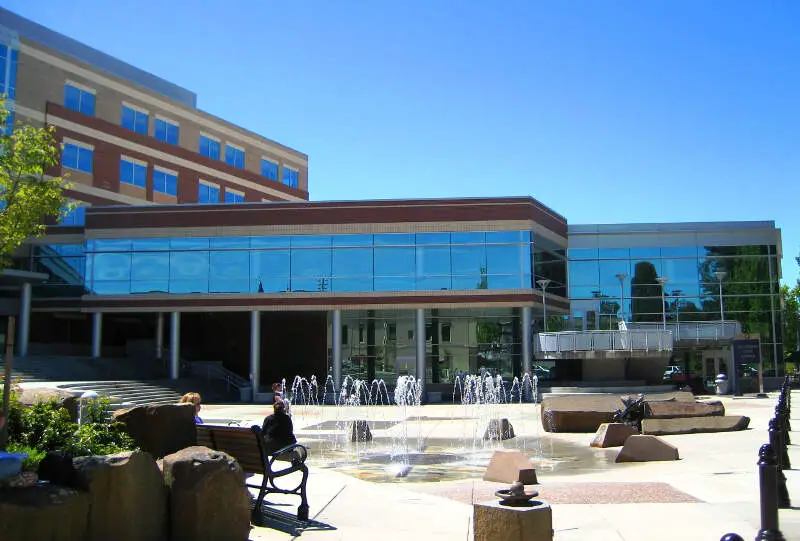
/10
Rank Last Year: 5 (No Change)
Population: 108,231.0
Population 2010: 88,125
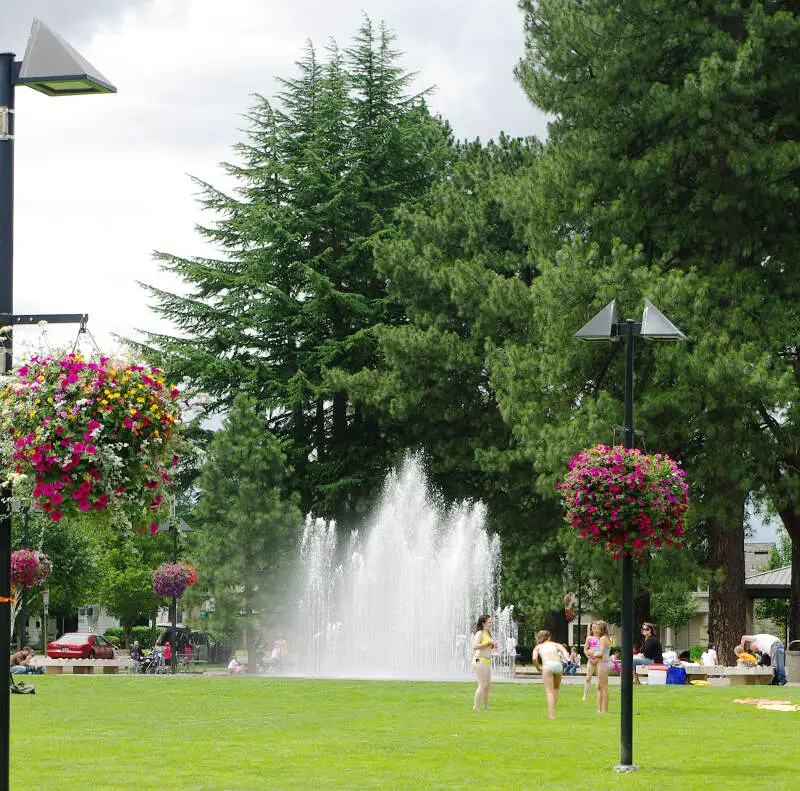
Growth: 22.8%
More on Hillsboro: Data | Crime | Cost Of Living | Real Estate

/10
Rank Last Year: 6 (No Change)
Population: 103,390.0
Population 2010: 74,327
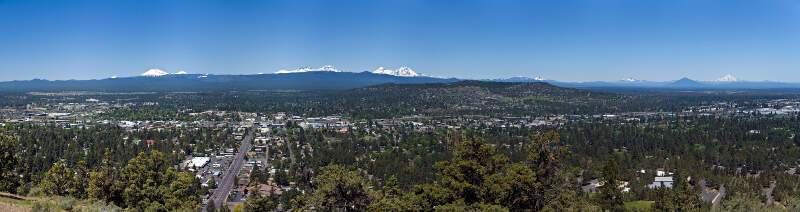
Growth: 39.1%
More on Bend: Data | Crime | Cost Of Living | Real Estate

/10
Rank Last Year: 7 (No Change)
Population: 97,812.0
Population 2010: 88,035
Growth: 11.1%
More on Beaverton: Data | Crime | Cost Of Living | Real Estate

/10
Rank Last Year: 8 (No Change)
Population: 86,315.0
Population 2010: 73,821
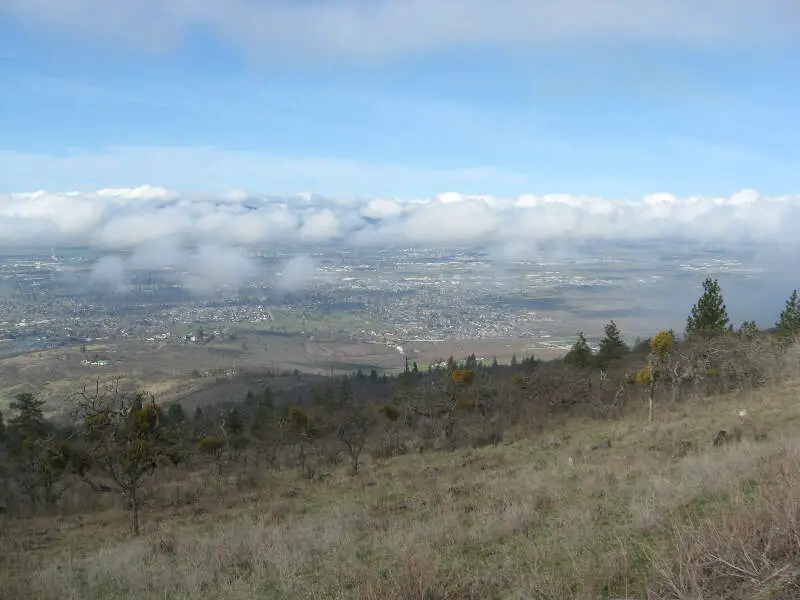
Growth: 16.9%
More on Medford: Data | Crime | Cost Of Living | Real Estate

/10
Rank Last Year: 9 (No Change)
Population: 61,499.0
Population 2010: 58,409
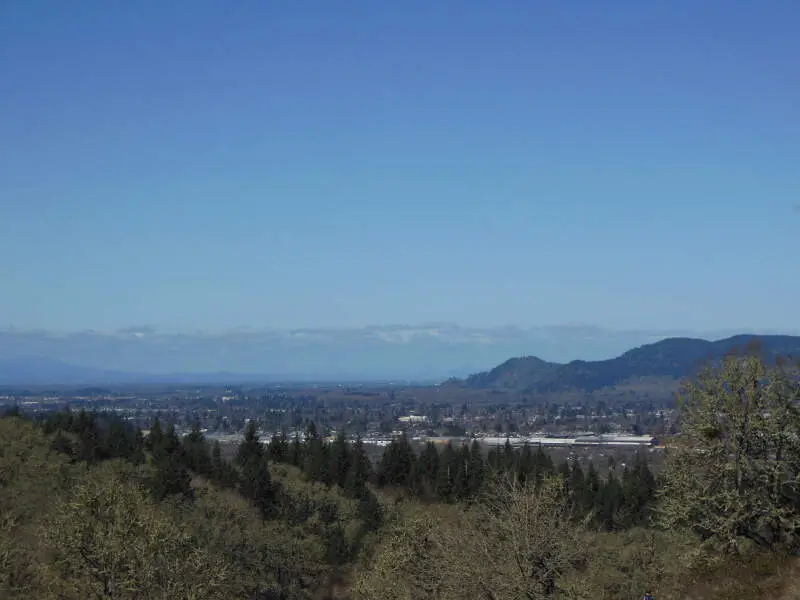
Growth: 5.3%
More on Springfield: Data | Crime | Cost Of Living | Real Estate

/10
Rank Last Year: 10 (No Change)
Population: 59,960.0
Population 2010: 53,435
Growth: 12.2%
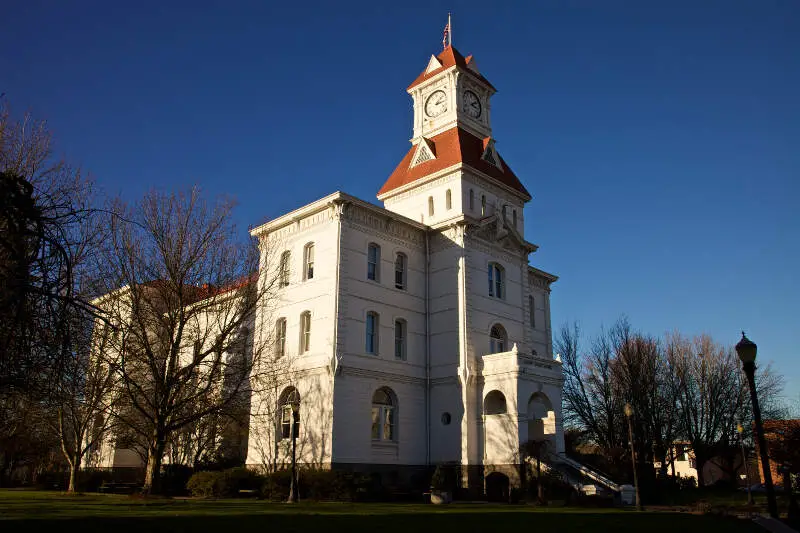
More on Corvallis: Data | Crime | Cost Of Living | Real Estate
How We Determined The Largest Cities In Oregon
We've been ranking and dissecting cities in the Beaver State for over 4 years now -- making this actually the fourth time we've run the numbers. We always use the best data, the US Census. In this case, that means we are using the American Community Survey.
It what is probably the most simple analysis we run each year, we ranked every place in Oregon from biggest to smallest. The biggest city this year? That would be Portland.
The smallest? Netarts, although there are places smaller than 1,000 people not listed here, so keep that in mind as we take a look at the top ten.
Now on to numbers 11-100 Biggest in Oregon
We hope that you find the big city, or really any city, that's right for you. Below is a list of the rest of the biggest cities along with every other place in Oregon.
Have fun snacking around in the Beaver State!
For more reading on Oregon, check out:
- Best Places To Raise A Family In Oregon
- Best Places To Retire In Oregon
- Richest Cities In Oregon
- Safest Places In Oregon
- Worst Places To Live In Oregon
- Most Expensive Places To Live In Oregon
Detailed List Of The Biggest Cities In Oregon
| Rank | City | Current Population | 2010 | Growth |
|---|---|---|---|---|
| 1 | Portland | 641,165.0 | 566,686 | 13.1% |
| 2 | Eugene | 179,591.0 | 153,288 | 17.2% |
| 3 | Salem | 178,865.0 | 151,809 | 17.8% |
| 4 | Gresham | 112,378.0 | 101,450 | 10.8% |
| 5 | Hillsboro | 108,231.0 | 88,125 | 22.8% |
| 6 | Bend | 103,390.0 | 74,327 | 39.1% |
| 7 | Beaverton | 97,812.0 | 88,035 | 11.1% |
| 8 | Medford | 86,315.0 | 73,821 | 16.9% |
| 9 | Springfield | 61,499.0 | 58,409 | 5.3% |
| 10 | Corvallis | 59,960.0 | 53,435 | 12.2% |
| 11 | Albany | 56,839.0 | 48,560 | 17.0% |
| 12 | Tigard | 56,011.0 | 47,244 | 18.6% |
| 13 | Aloha | 52,389.0 | 47,574 | 10.1% |
| 14 | Lake Oswego | 40,381.0 | 36,586 | 10.4% |
| 15 | Grants Pass | 39,311.0 | 33,883 | 16.0% |
| 16 | Keizer | 39,082.0 | 35,729 | 9.4% |
| 17 | Oregon City | 37,755.0 | 30,983 | 21.9% |
| 18 | Redmond | 36,092.0 | 24,957 | 44.6% |
| 19 | Mcminnville | 34,596.0 | 31,260 | 10.7% |
| 20 | Bethany | 33,106.0 | 19,475 | 70.0% |
| 21 | Woodburn | 27,875.0 | 23,247 | 19.9% |
| 22 | Tualatin | 27,763.0 | 25,590 | 8.5% |
| 23 | Wilsonville | 26,974.0 | 18,900 | 42.7% |
| 24 | West Linn | 26,935.0 | 24,657 | 9.2% |
| 25 | Happy Valley | 26,738.0 | 12,583 | 112.5% |
| 26 | Forest Grove | 26,529.0 | 20,635 | 28.6% |
| 27 | Newberg | 26,066.0 | 21,422 | 21.7% |
| 28 | Roseburg | 23,778.0 | 21,094 | 12.7% |
| 29 | Klamath Falls | 22,115.0 | 20,869 | 6.0% |
| 30 | Milwaukie | 21,392.0 | 20,393 | 4.9% |
| 31 | Ashland | 21,259.0 | 20,103 | 5.8% |
| 32 | Hayesville | 21,246.0 | 19,711 | 7.8% |
| 33 | Sherwood | 20,307.0 | 17,117 | 18.6% |
| 34 | Altamont | 19,927.0 | 20,390 | -2.3% |
| 35 | Hermiston | 19,546.0 | 16,016 | 22.0% |
| 36 | Cedar Mill | 19,471.0 | 14,535 | 34.0% |
| 37 | Lebanon | 19,344.0 | 15,072 | 28.3% |
| 38 | Central Point | 19,216.0 | 16,458 | 16.8% |
| 39 | Canby | 18,134.0 | 15,388 | 17.8% |
| 40 | Dallas | 17,531.0 | 14,348 | 22.2% |
| 41 | Pendleton | 16,950.0 | 16,651 | 1.8% |
| 42 | Oak Grove | 16,796.0 | 16,931 | -0.8% |
| 43 | Four Corners | 16,275.0 | 15,798 | 3.0% |
| 44 | Coos Bay | 15,925.0 | 15,944 | -0.1% |
| 45 | Troutdale | 15,923.0 | 15,347 | 3.8% |
| 46 | The Dalles | 15,917.0 | 13,275 | 19.9% |
| 47 | St. Helens | 14,258.0 | 12,544 | 13.7% |
| 48 | Cornelius | 14,255.0 | 11,512 | 23.8% |
| 49 | Oatfield | 13,294.0 | 13,619 | -2.4% |
| 50 | La Grande | 13,058.0 | 12,882 | 1.4% |
| 51 | Sandy | 12,854.0 | 8,860 | 45.1% |
| 52 | Gladstone | 11,977.0 | 11,531 | 3.9% |
| 53 | Ontario | 11,842.0 | 11,308 | 4.7% |
| 54 | Prineville | 11,470.0 | 9,450 | 21.4% |
| 55 | Monmouth | 11,428.0 | 9,283 | 23.1% |
| 56 | Oak Hills | 11,131.0 | 10,884 | 2.3% |
| 57 | White City | 10,750.0 | 7,833 | 37.2% |
| 58 | Fairview | 10,735.0 | 8,504 | 26.2% |
| 59 | Cottage Grove | 10,698.0 | 9,493 | 12.7% |
| 60 | Newport | 10,583.0 | 9,941 | 6.5% |
| 61 | Silverton | 10,456.0 | 8,940 | 17.0% |
| 62 | Baker City | 10,210.0 | 9,788 | 4.3% |
| 63 | Independence | 10,199.0 | 8,215 | 24.2% |
| 64 | Molalla | 10,186.0 | 7,695 | 32.4% |
| 65 | North Bend | 10,171.0 | 9,710 | 4.7% |
| 66 | Astoria | 10,109.0 | 9,560 | 5.7% |
| 67 | Sweet Home | 10,078.0 | 8,769 | 14.9% |
| 68 | Lincoln City | 9,968.0 | 7,889 | 26.4% |
| 69 | Bull Mountain | 9,865.0 | 9,166 | 7.6% |
| 70 | Eagle Point | 9,839.0 | 7,869 | 25.0% |
| 71 | Florence | 9,482.0 | 8,264 | 14.7% |
| 72 | Rockcreek | 9,223.0 | 9,778 | -5.7% |
| 73 | Sutherlin | 8,599.0 | 7,668 | 12.1% |
| 74 | Cedar Hills | 8,388.0 | 8,323 | 0.8% |
| 75 | Hood River | 8,361.0 | 6,878 | 21.6% |
| 76 | Stayton | 8,292.0 | 7,495 | 10.6% |
| 77 | Scappoose | 8,179.0 | 6,387 | 28.1% |
| 78 | Jennings Lodge | 7,971.0 | 7,799 | 2.2% |
| 79 | Madras | 7,676.0 | 6,034 | 27.2% |
| 80 | West Haven-Sylvan | 7,674.0 | 7,016 | 9.4% |
| 81 | Green | 7,541.0 | 7,815 | -3.5% |
| 82 | Umatilla | 7,508.0 | 6,630 | 13.2% |
| 83 | Seaside | 7,192.0 | 6,385 | 12.6% |
| 84 | Milton-Freewater | 7,036.0 | 6,921 | 1.7% |
| 85 | Garden Home-Whitford | 6,979.0 | 6,029 | 15.8% |
| 86 | Junction City | 6,947.0 | 5,358 | 29.7% |
| 87 | Raleigh Hills | 6,744.0 | 6,691 | 0.8% |
| 88 | Brookings | 6,703.0 | 6,274 | 6.8% |
| 89 | West Slope | 6,582.0 | 6,305 | 4.4% |
| 90 | Sheridan | 6,339.0 | 5,930 | 6.9% |
| 91 | Warrenton | 6,327.0 | 4,844 | 30.6% |
| 92 | Talent | 6,254.0 | 6,033 | 3.7% |
| 93 | Deschutes River Woods | 5,797.0 | 6,007 | -3.5% |
| 94 | Winston | 5,690.0 | 5,311 | 7.1% |
| 95 | Philomath | 5,642.0 | 4,518 | 24.9% |
| 96 | Creswell | 5,621.0 | 4,777 | 17.7% |
| 97 | Tillamook | 5,218.0 | 4,897 | 6.6% |
| 98 | Veneta | 5,200.0 | 4,222 | 23.2% |
| 99 | Estacada | 5,152.0 | 2,670 | 93.0% |
| 100 | King City | 5,073.0 | 3,024 | 67.8% |
| 101 | Beavercreek | 4,894.0 | 4,443 | 10.2% |
| 102 | Wood Village | 4,696.0 | 3,680 | 27.6% |
| 103 | Roseburg North | 4,601.0 | 6,919 | -33.5% |
| 104 | Lafayette | 4,490.0 | 3,546 | 26.6% |
| 105 | Phoenix | 4,390.0 | 4,499 | -2.4% |
| 106 | Reedsport | 4,317.0 | 4,223 | 2.2% |
| 107 | Tri-City | 4,234.0 | 3,954 | 7.1% |
| 108 | Aumsville | 4,230.0 | 3,478 | 21.6% |
| 109 | Boardman | 4,064.0 | 3,149 | 29.1% |
| 110 | Coquille | 4,002.0 | 3,944 | 1.5% |
| 111 | Three Rivers | 3,995.0 | 2,922 | 36.7% |
| 112 | Redwood | 3,721.0 | 3,170 | 17.4% |
| 113 | Metzger | 3,714.0 | 3,479 | 6.8% |
| 114 | Harrisburg | 3,681.0 | 3,419 | 7.7% |
| 115 | Toledo | 3,546.0 | 3,457 | 2.6% |
| 116 | Myrtle Creek | 3,500.0 | 3,478 | 0.6% |
| 117 | North Plains | 3,433.0 | 1,928 | 78.1% |
| 118 | Hubbard | 3,406.0 | 3,064 | 11.2% |
| 119 | Mount Angel | 3,393.0 | 3,255 | 4.2% |
| 120 | Millersburg | 3,366.0 | 1,323 | 154.4% |
| 121 | Bandon | 3,330.0 | 3,070 | 8.5% |
| 122 | Jefferson | 3,301.0 | 2,987 | 10.5% |
| 123 | Lakeview | 3,270.0 | 2,999 | 9.0% |
| 124 | Nyssa | 3,240.0 | 3,240 | 0.0% |
| 125 | Dundee | 3,213.0 | 3,085 | 4.1% |
| 126 | Oakridge | 3,184.0 | 3,201 | -0.5% |
| 127 | Shady Cove | 3,076.0 | 2,824 | 8.9% |
| 128 | Sisters | 3,022.0 | 1,904 | 58.7% |
| 129 | Jacksonville | 2,991.0 | 2,723 | 9.8% |
| 130 | Sublimity | 2,919.0 | 2,606 | 12.0% |
| 131 | Turner | 2,792.0 | 2,052 | 36.1% |
| 132 | Vernonia | 2,786.0 | 2,413 | 15.5% |
| 133 | Carlton | 2,759.0 | 1,739 | 58.7% |
| 134 | Burns | 2,723.0 | 2,805 | -2.9% |
| 135 | Myrtle Point | 2,684.0 | 2,522 | 6.4% |
| 136 | Eagle Crest | 2,677.0 | 1,826 | 46.6% |
| 137 | Dayton | 2,675.0 | 2,476 | 8.0% |
| 138 | Gervais | 2,581.0 | 1,773 | 45.6% |
| 139 | La Pine | 2,547.0 | 1,679 | 51.7% |
| 140 | Warm Springs | 2,480.0 | 3,150 | -21.3% |
| 141 | Gold Beach | 2,466.0 | 2,035 | 21.2% |
| 142 | Harbor | 2,437.0 | 2,211 | 10.2% |
| 143 | Lincoln Beach | 2,434.0 | 2,361 | 3.1% |
| 144 | Clatskanie | 2,364.0 | 1,767 | 33.8% |
| 145 | Vale | 2,348.0 | 1,557 | 50.8% |
| 146 | Union | 2,290.0 | 2,076 | 10.3% |
| 147 | Culver | 2,254.0 | 1,512 | 49.1% |
| 148 | Rogue River | 2,238.0 | 2,034 | 10.0% |
| 149 | Mulino | 2,229.0 | 2,183 | 2.1% |
| 150 | Odell | 2,218.0 | 2,037 | 8.9% |
| 151 | Willamina | 2,193.0 | 2,139 | 2.5% |
| 152 | Waldport | 2,177.0 | 1,884 | 15.6% |
| 153 | Banks | 2,156.0 | 2,001 | 7.7% |
| 154 | Enterprise | 2,131.0 | 2,064 | 3.2% |
| 155 | Rainier | 2,130.0 | 2,113 | 0.8% |
| 156 | Irrigon | 2,120.0 | 1,923 | 10.2% |
| 157 | Amity | 2,089.0 | 1,540 | 35.6% |
| 158 | Columbia City | 2,006.0 | 1,785 | 12.4% |
| 159 | Durham | 1,983.0 | 1,339 | 48.1% |
| 160 | Gearhart | 1,978.0 | 1,269 | 55.9% |
| 161 | Canyonville | 1,920.0 | 1,238 | 55.1% |
| 162 | Mill City | 1,920.0 | 1,477 | 30.0% |
| 163 | Brownsville | 1,912.0 | 1,789 | 6.9% |
| 164 | Stanfield | 1,902.0 | 1,951 | -2.5% |
| 165 | Bay City | 1,875.0 | 1,286 | 45.8% |
| 166 | Lakeside | 1,870.0 | 1,492 | 25.3% |
| 167 | Glide | 1,823.0 | 1,708 | 6.7% |
| 168 | Depoe Bay | 1,782.0 | 1,086 | 64.1% |
| 169 | Cave Junction | 1,691.0 | 1,705 | -0.8% |
| 170 | Barview | 1,684.0 | 1,778 | -5.3% |
| 171 | Warren | 1,637.0 | 1,784 | -8.2% |
| 172 | Bunker Hill | 1,626.0 | 1,203 | 35.2% |
| 173 | Coburg | 1,626.0 | 884 | 83.9% |
| 174 | Merlin | 1,617.0 | 1,906 | -15.2% |
| 175 | John Day | 1,609.0 | 2,035 | -20.9% |
| 176 | Hines | 1,604.0 | 1,771 | -9.4% |
| 177 | Terrebonne | 1,602.0 | 1,173 | 36.6% |
| 178 | Stafford | 1,600.0 | 1,765 | -9.3% |
| 179 | Rockaway Beach | 1,562.0 | 1,112 | 40.5% |
| 180 | Grand Ronde | 1,549.0 | 1,335 | 16.0% |
| 181 | Elgin | 1,549.0 | 1,551 | -0.1% |
| 182 | Halsey | 1,491.0 | 911 | 63.7% |
| 183 | Sunriver | 1,488.0 | 804 | 85.1% |
| 184 | Chenoweth | 1,445.0 | 1,739 | -16.9% |
| 185 | Rose Lodge | 1,381.0 | 1,717 | -19.6% |
| 186 | Cascade Locks | 1,378.0 | 955 | 44.3% |
| 187 | Athena | 1,377.0 | 1,028 | 33.9% |
| 188 | Cannon Beach | 1,361.0 | 1,094 | 24.4% |
| 189 | Dunes City | 1,357.0 | 1,501 | -9.6% |
| 190 | Pacific City | 1,303.0 | 1,085 | 20.1% |
| 191 | New Hope | 1,296.0 | 1,200 | 8.0% |
| 192 | Tangent | 1,290.0 | 1,091 | 18.2% |
| 193 | Gold Hill | 1,288.0 | 1,097 | 17.4% |
| 194 | Pilot Rock | 1,283.0 | 1,537 | -16.5% |
| 195 | Heppner | 1,277.0 | 1,482 | -13.8% |
| 196 | Yamhill | 1,273.0 | 1,236 | 3.0% |
| 197 | Adair Village | 1,233.0 | 901 | 36.8% |
| 198 | Lowell | 1,228.0 | 822 | 49.4% |
| 199 | Falls City | 1,222.0 | 1,073 | 13.9% |
| 200 | Umapine | 1,215.0 | 265 | 358.5% |
| 201 | Ruch | 1,151.0 | 948 | 21.4% |
| 202 | Island City | 1,145.0 | 1,032 | 10.9% |
| 203 | Lyons | 1,139.0 | 1,042 | 9.3% |
| 204 | Metolius | 1,137.0 | 770 | 47.7% |
| 205 | Donald | 1,133.0 | 856 | 32.4% |
| 206 | Bayside Gardens | 1,128.0 | 836 | 34.9% |
| 207 | Siletz | 1,119.0 | 1,205 | -7.1% |
| 208 | Foots Creek | 1,110.0 | 851 | 30.4% |
| 209 | Monroe | 1,102.0 | 595 | 85.2% |
| 210 | Drain | 1,078.0 | 1,035 | 4.2% |
| 211 | Joseph | 1,054.0 | 896 | 17.6% |
| 212 | Oakland | 1,048.0 | 1,117 | -6.2% |
| 213 | Aurora | 1,030.0 | 702 | 46.7% |
| 214 | Netarts | 1,022.0 | 754 | 35.5% |