We all love the biggest cities that the Tar Heel State has to offer. You know the places like Charlotte and Raleigh which make all the headlines.
But there are a bunch of other great large cities in North Carolina that don't get as much love.
We're going to change that right now.
Using the most recent Census data, we can tell you about all the places in North Carolina with a focus on the biggest. We update the data each year and this is our fourth time doing this.
The Largest Cities In North Carolina For 2026:
You can click here to see a full table of the 100 biggest cities in North Carolina, along with every other place over 1,000 people big. It is sortable by clicking on the headers.
Read on below to see more on the biggest cities. Or for more reading on places to live in North Carolina, check out:
- Best Places To Live In North Carolina
- Cheapest Places To Live In North Carolina
- Most Dangerous Cities In North Carolina
The 10 Biggest Cities In North Carolina

/10
Rank Last Year: 1 (No Change)
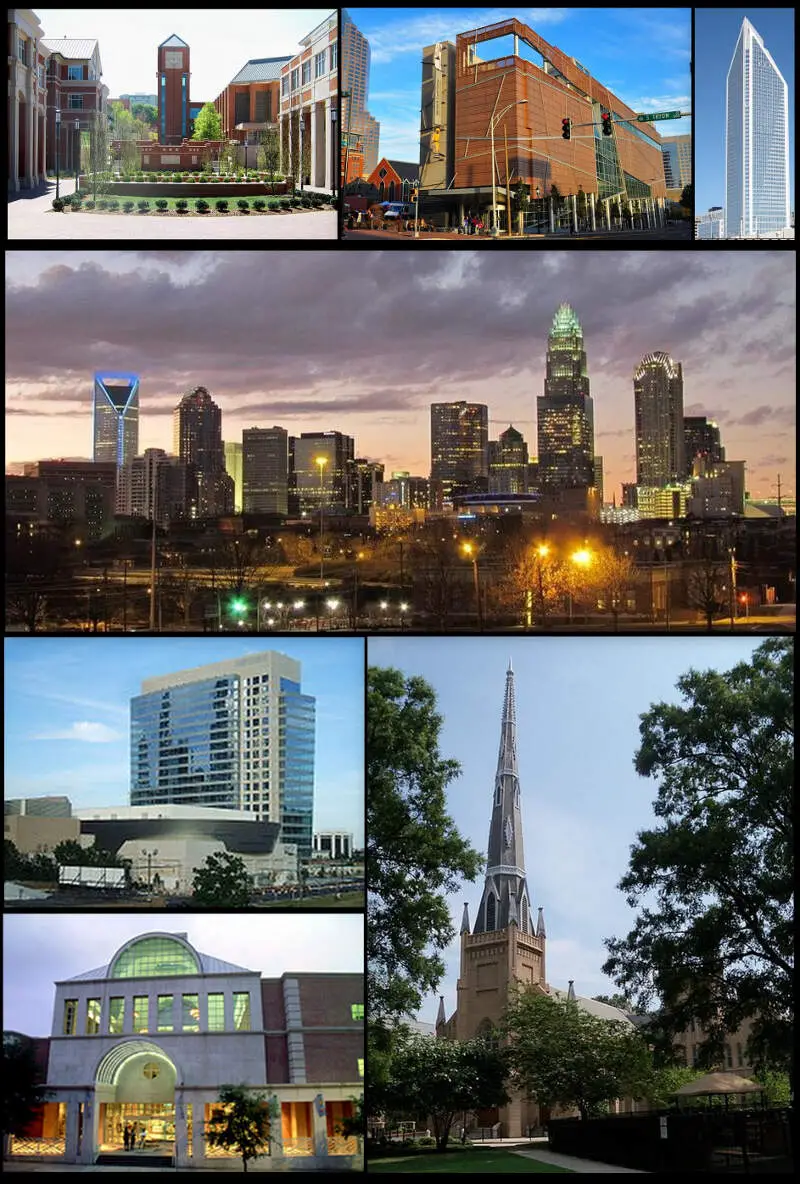
Population: 903,844.0
Population 2010: 705,896
Growth: 28.0%
More on Charlotte: Data | Cost Of Living | Real Estate

/10
Rank Last Year: 2 (No Change)
Population: 481,031.0
Population 2010: 382,729
Growth: 25.7%
More on Raleigh: Data | Crime | Cost Of Living | Real Estate

/10
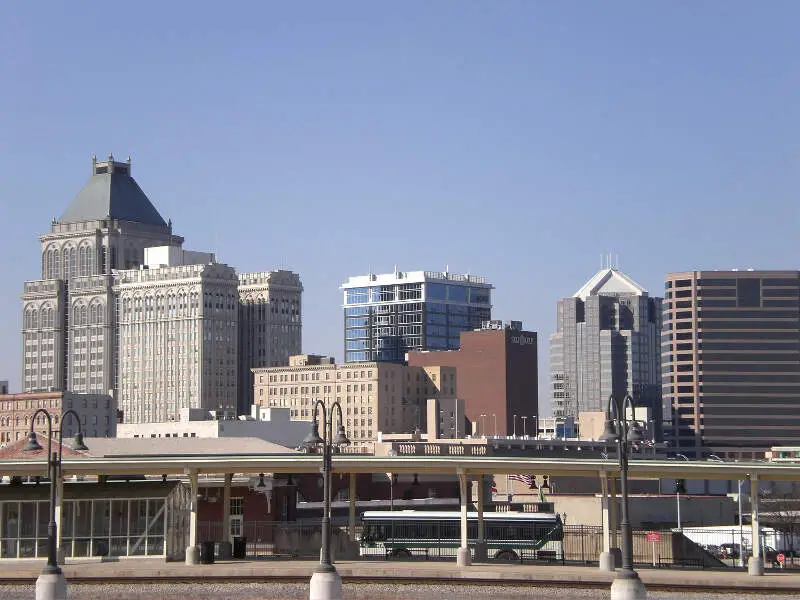
Rank Last Year: 3 (No Change)
Population: 301,198.0
Population 2010: 263,358
Growth: 14.4%
More on Greensboro: Data | Crime | Cost Of Living | Real Estate

/10
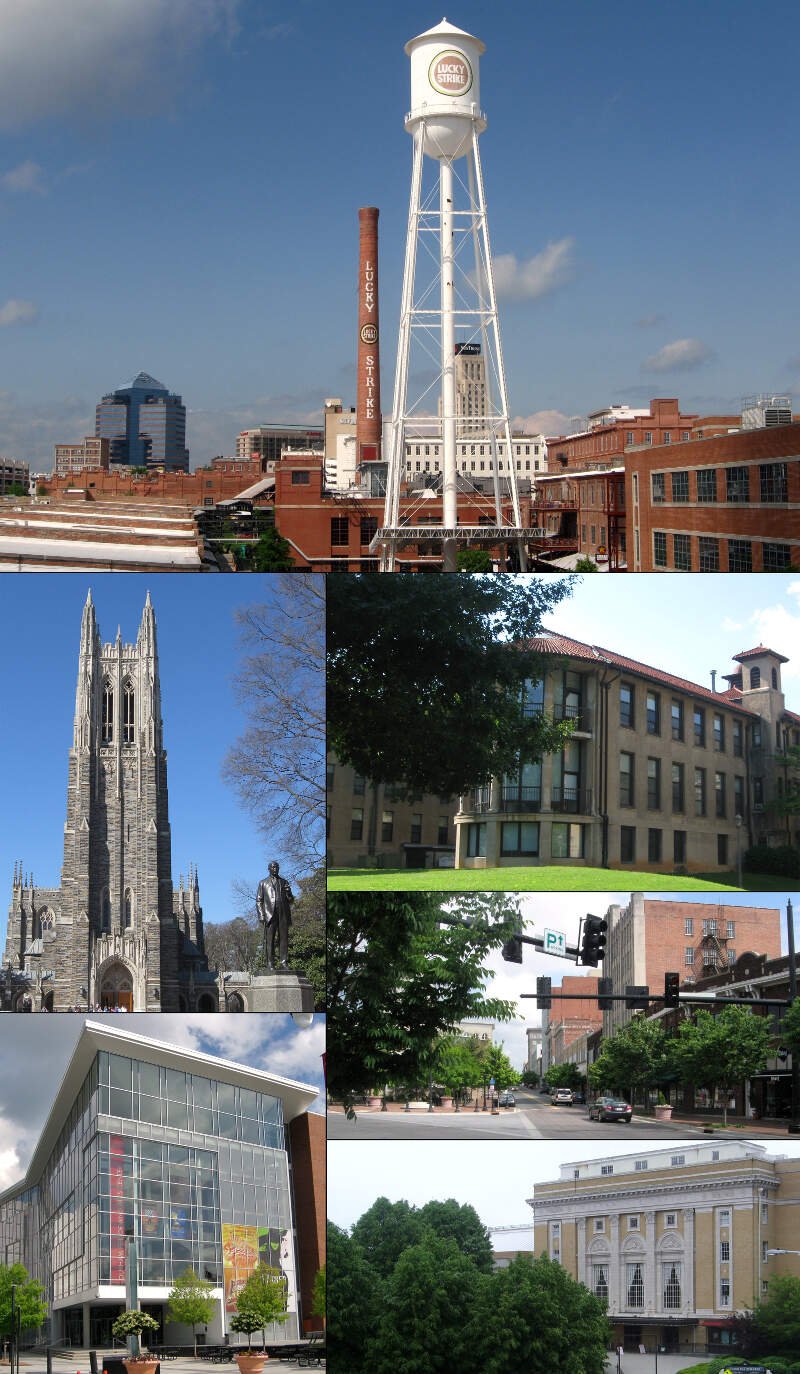
Rank Last Year: 4 (No Change)
Population: 291,467.0
Population 2010: 220,324
Growth: 32.3%
More on Durham: Data | Crime | Cost Of Living | Real Estate

/10
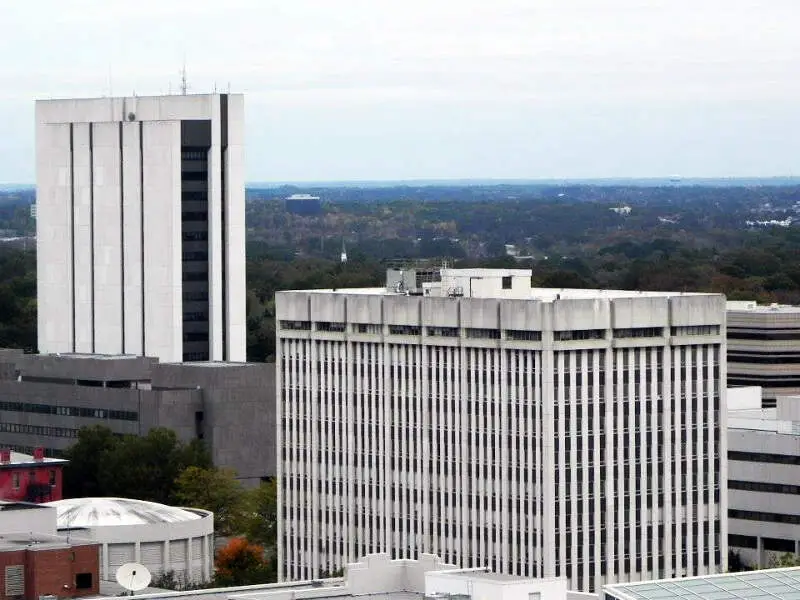
Rank Last Year: 5 (No Change)
Population: 252,037.0
Population 2010: 224,769
Growth: 12.1%
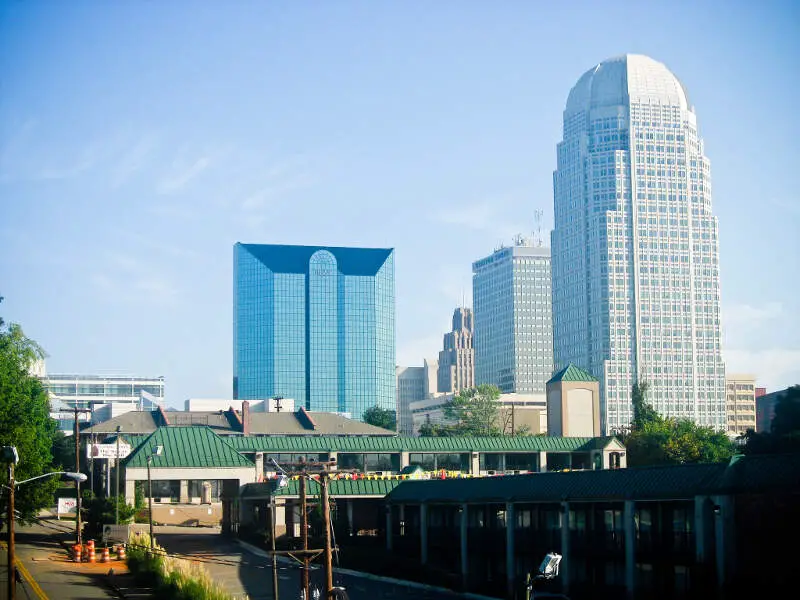
More on Winston-Salem: Data | Crime | Cost Of Living | Real Estate

/10
Rank Last Year: 6 (No Change)
Population: 210,815.0
Population 2010: 198,875
Growth: 6.0%
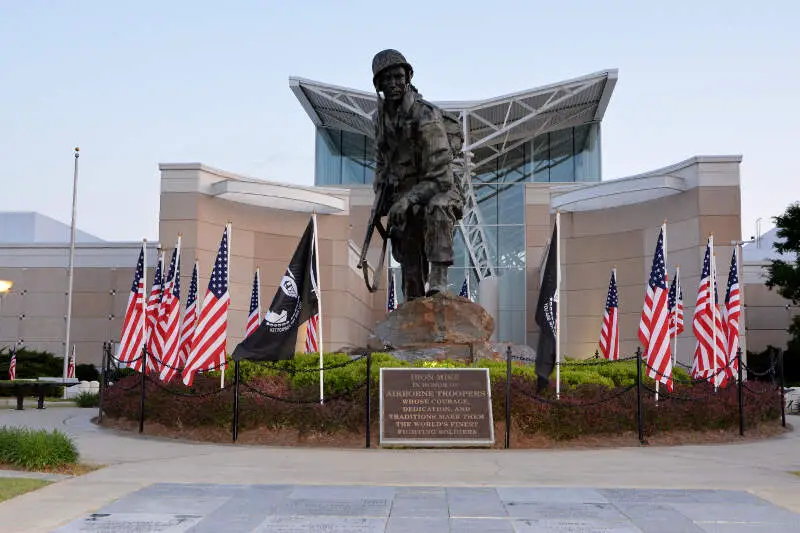
More on Fayetteville: Data | Crime | Cost Of Living | Real Estate

/10
Rank Last Year: 7 (No Change)
Population: 179,306.0
Population 2010: 127,587
Growth: 40.5%
More on Cary: Data | Crime | Cost Of Living | Real Estate

/10
Rank Last Year: 8 (No Change)
Population: 120,805.0
Population 2010: 104,730
Growth: 15.3%
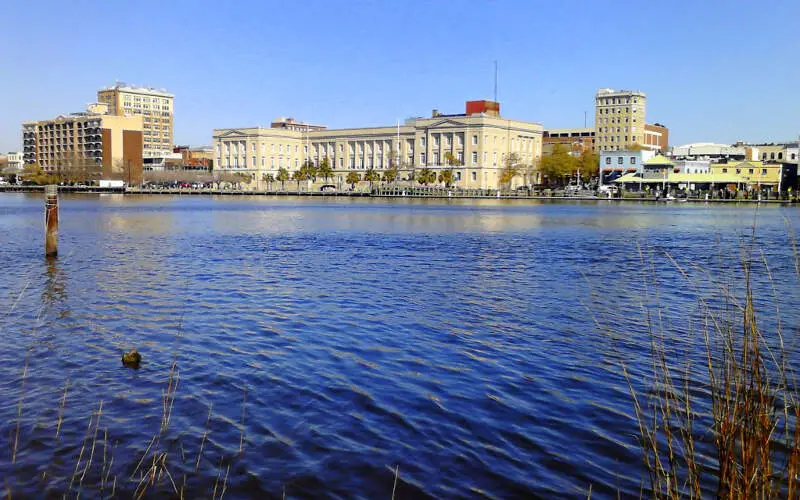
More on Wilmington: Data | Crime | Cost Of Living | Real Estate

/10
Rank Last Year: 9 (No Change)
Population: 116,245.0
Population 2010: 100,903
Growth: 15.2%
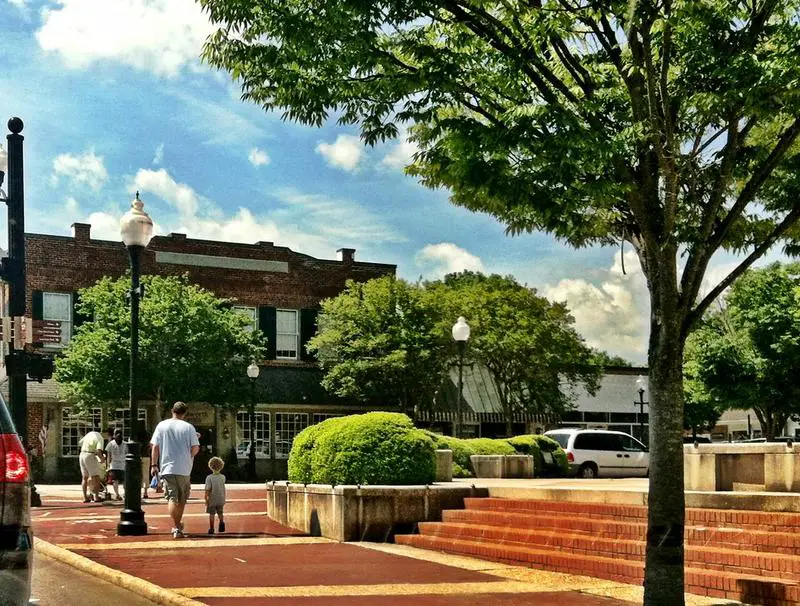
More on High Point: Data | Crime | Cost Of Living | Real Estate

/10
Rank Last Year: 10 (No Change)
Population: 108,719.0
Population 2010: 75,172
Growth: 44.6%
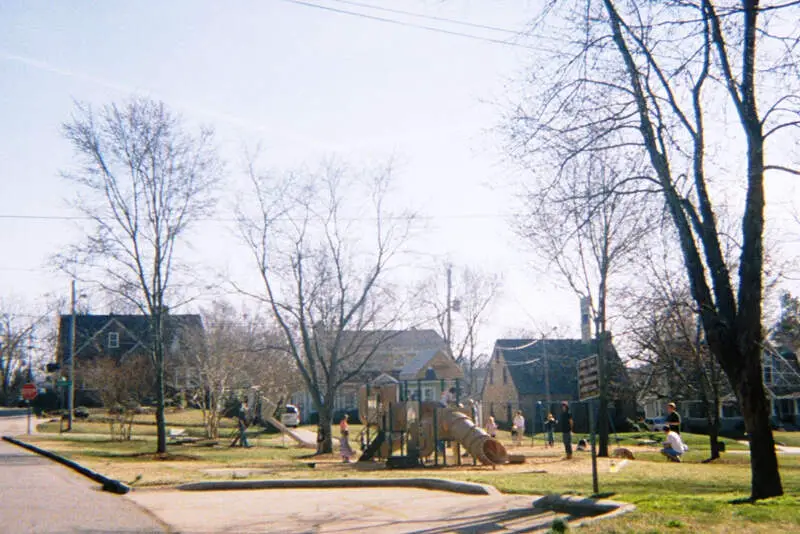
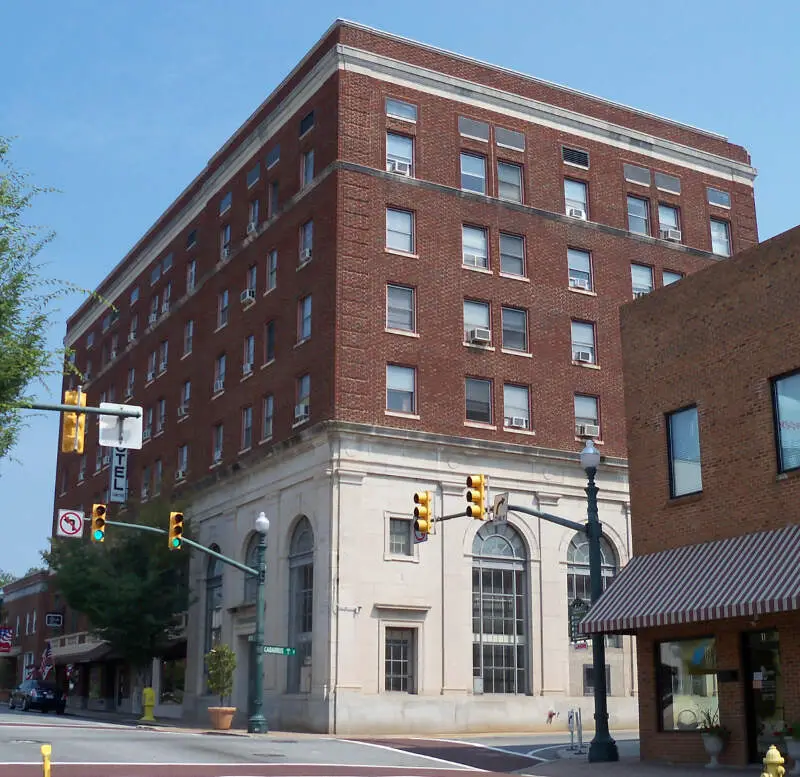
More on Concord: Data | Crime | Cost Of Living | Real Estate
How We Determined The Largest Cities In North Carolina
We've been ranking and dissecting cities in the Tar Heel State for over 4 years now -- making this actually the fourth time we've run the numbers. We always use the best data, the US Census. In this case, that means we are using the American Community Survey.
It what is probably the most simple analysis we run each year, we ranked every place in North Carolina from biggest to smallest. The biggest city this year? That would be Charlotte.
The smallest? Peletier, although there are places smaller than 1,000 people not listed here, so keep that in mind as we take a look at the top ten.
Now on to numbers 11-100 Biggest in North Carolina
We hope that you find the big city, or really any city, that's right for you. Below is a list of the rest of the biggest cities along with every other place in North Carolina.
Have fun snacking around in the Tar Heel State!
For more reading on North Carolina, check out:
- Best Places To Raise A Family In North Carolina
- Best Places To Retire In North Carolina
- Richest Cities In North Carolina
- Safest Cities in North Carolina
- Worst Places To Live In North Carolina
- Most Expensive Places To Live In North Carolina
Detailed List Of The Biggest Cities In North Carolina
| Rank | City | Current Population | 2010 | Growth |
|---|---|---|---|---|
| 1 | Charlotte | 903,844.0 | 705,896 | 28.0% |
| 2 | Raleigh | 481,031.0 | 382,729 | 25.7% |
| 3 | Greensboro | 301,198.0 | 263,358 | 14.4% |
| 4 | Durham | 291,467.0 | 220,324 | 32.3% |
| 5 | Winston-Salem | 252,037.0 | 224,769 | 12.1% |
| 6 | Fayetteville | 210,815.0 | 198,875 | 6.0% |
| 7 | Cary | 179,306.0 | 127,587 | 40.5% |
| 8 | Wilmington | 120,805.0 | 104,730 | 15.3% |
| 9 | High Point | 116,245.0 | 100,903 | 15.2% |
| 10 | Concord | 108,719.0 | 75,172 | 44.6% |
| 11 | Asheville | 94,535.0 | 81,970 | 15.3% |
| 12 | Greenville | 92,857.0 | 80,439 | 15.4% |
| 13 | Gastonia | 82,884.0 | 70,709 | 17.2% |
| 14 | Jacksonville | 71,279.0 | 68,989 | 3.3% |
| 15 | Apex | 70,630.0 | 34,427 | 105.2% |
| 16 | Huntersville | 63,969.0 | 43,106 | 48.4% |
| 17 | Chapel Hill | 61,607.0 | 55,180 | 11.6% |
| 18 | Burlington | 59,610.0 | 48,736 | 22.3% |
| 19 | Kannapolis | 57,890.0 | 41,663 | 38.9% |
| 20 | Rocky Mount | 54,297.0 | 57,776 | -6.0% |
| 21 | Wake Forest | 52,844.0 | 26,790 | 97.3% |
| 22 | Mooresville | 52,381.0 | 30,582 | 71.3% |
| 23 | Wilson | 48,370.0 | 48,219 | 0.3% |
| 24 | Holly Springs | 45,248.0 | 21,968 | 106.0% |
| 25 | Hickory | 44,258.0 | 39,932 | 10.8% |
| 26 | Indian Trail | 42,036.0 | 30,362 | 38.4% |
| 27 | Fuquay-Varina | 40,485.0 | 16,152 | 150.7% |
| 28 | Monroe | 36,759.0 | 32,297 | 13.8% |
| 29 | Salisbury | 35,825.0 | 33,018 | 8.5% |
| 30 | Garner | 34,473.0 | 24,417 | 41.2% |
| 31 | Goldsboro | 34,383.0 | 36,816 | -6.6% |
| 32 | Cornelius | 32,783.0 | 22,970 | 42.7% |
| 33 | New Bern | 32,734.0 | 28,073 | 16.6% |
| 34 | Sanford | 31,478.0 | 26,897 | 17.0% |
| 35 | Morrisville | 31,422.0 | 16,147 | 94.6% |
| 36 | Matthews | 30,577.0 | 26,556 | 15.1% |
| 37 | Statesville | 29,894.0 | 24,619 | 21.4% |
| 38 | Leland | 29,607.0 | 11,925 | 148.3% |
| 39 | Clayton | 29,320.0 | 14,714 | 99.3% |
| 40 | Kernersville | 27,830.0 | 22,337 | 24.6% |
| 41 | Asheboro | 27,580.0 | 24,478 | 12.7% |
| 42 | Mint Hill | 27,556.0 | 21,940 | 25.6% |
| 43 | Thomasville | 27,321.0 | 26,319 | 3.8% |
| 44 | Waxhaw | 22,275.0 | 8,754 | 154.5% |
| 45 | Shelby | 22,100.0 | 20,417 | 8.2% |
| 46 | Clemmons | 21,871.0 | 18,145 | 20.5% |
| 47 | Carrboro | 21,204.0 | 19,074 | 11.2% |
| 48 | Knightdale | 20,214.0 | 10,477 | 92.9% |
| 49 | Boone | 20,032.0 | 16,566 | 20.9% |
| 50 | Lexington | 19,690.0 | 19,155 | 2.8% |
| 51 | Harrisburg | 19,633.0 | 10,328 | 90.1% |
| 52 | Mebane | 19,538.0 | 10,401 | 87.8% |
| 53 | Kinston | 19,505.0 | 21,998 | -11.3% |
| 54 | Elizabeth City | 18,871.0 | 18,647 | 1.2% |
| 55 | Lumberton | 18,859.0 | 21,448 | -12.1% |
| 56 | Lenoir | 18,299.0 | 18,225 | 0.4% |
| 57 | Pinehurst | 18,256.0 | 12,521 | 45.8% |
| 58 | Mount Holly | 18,208.0 | 12,914 | 41.0% |
| 59 | Graham | 18,048.0 | 13,921 | 29.6% |
| 60 | Hope Mills | 17,939.0 | 14,416 | 24.4% |
| 61 | Havelock | 17,691.0 | 20,624 | -14.2% |
| 62 | Morganton | 17,646.0 | 16,972 | 4.0% |
| 63 | Stallings | 16,886.0 | 12,682 | 33.1% |
| 64 | Albemarle | 16,762.0 | 15,912 | 5.3% |
| 65 | Southern Pines | 16,420.0 | 12,116 | 35.5% |
| 66 | Murraysville | 16,339.0 | 13,293 | 22.9% |
| 67 | Davidson | 15,660.0 | 10,320 | 51.7% |
| 68 | Belmont | 15,546.0 | 9,829 | 58.2% |
| 69 | Hendersonville | 15,408.0 | 12,900 | 19.4% |
| 70 | Eden | 15,356.0 | 15,602 | -1.6% |
| 71 | Laurinburg | 15,087.0 | 16,067 | -6.1% |
| 72 | Henderson | 14,885.0 | 15,540 | -4.2% |
| 73 | Roanoke Rapids | 14,856.0 | 15,865 | -6.4% |
| 74 | Reidsville | 14,585.0 | 14,511 | 0.5% |
| 75 | Piney Green | 14,078.0 | 13,848 | 1.7% |
| 76 | Lewisville | 13,828.0 | 12,518 | 10.5% |
| 77 | Weddington | 13,805.0 | 9,207 | 49.9% |
| 78 | Newton | 13,333.0 | 12,967 | 2.8% |
| 79 | Wendell | 13,064.0 | 5,563 | 134.8% |
| 80 | Myrtle Grove | 12,637.0 | 8,628 | 46.5% |
| 81 | Smithfield | 12,116.0 | 10,972 | 10.4% |
| 82 | Archdale | 12,087.0 | 10,964 | 10.2% |
| 83 | Kings Mountain | 12,039.0 | 10,631 | 13.2% |
| 84 | Lincolnton | 11,783.0 | 10,440 | 12.9% |
| 85 | Spring Lake | 11,573.0 | 11,829 | -2.2% |
| 86 | Summerfield | 11,116.0 | 9,615 | 15.6% |
| 87 | Pineville | 11,055.0 | 7,251 | 52.5% |
| 88 | Elon | 11,032.0 | 8,933 | 23.5% |
| 89 | Tarboro | 10,770.0 | 11,424 | -5.7% |
| 90 | Rolesville | 10,766.0 | 3,289 | 227.3% |
| 91 | Winterville | 10,725.0 | 8,462 | 26.7% |
| 92 | Mount Airy | 10,633.0 | 10,520 | 1.1% |
| 93 | Waynesville | 10,502.0 | 9,934 | 5.7% |
| 94 | Lake Norman Of Catawba | 9,906.0 | 6,931 | 42.9% |
| 95 | Morehead City | 9,806.0 | 8,523 | 15.1% |
| 96 | Washington | 9,726.0 | 9,708 | 0.2% |
| 97 | Hillsborough | 9,724.0 | 5,972 | 62.8% |
| 98 | Gibsonville | 9,467.0 | 6,063 | 56.1% |
| 99 | St. Stephens | 9,457.0 | 9,344 | 1.2% |
| 100 | Hampstead | 9,292.0 | 3,707 | 150.7% |
| 101 | Aberdeen | 9,228.0 | 5,884 | 56.8% |
| 102 | Wesley Chapel | 9,090.0 | 6,702 | 35.6% |
| 103 | Oak Island | 9,030.0 | 6,818 | 32.4% |
| 104 | Kings Grant | 9,003.0 | 8,348 | 7.8% |
| 105 | Rockingham | 8,967.0 | 9,524 | -5.8% |
| 106 | Oxford | 8,914.0 | 8,490 | 5.0% |
| 107 | Zebulon | 8,711.0 | 4,368 | 99.4% |
| 108 | Conover | 8,580.0 | 7,928 | 8.2% |
| 109 | Dunn | 8,559.0 | 9,123 | -6.2% |
| 110 | Black Mountain | 8,513.0 | 7,809 | 9.0% |
| 111 | Clinton | 8,304.0 | 8,584 | -3.3% |
| 112 | Ogden | 8,249.0 | 6,652 | 24.0% |
| 113 | Roxboro | 8,182.0 | 8,490 | -3.6% |
| 114 | Fletcher | 8,098.0 | 6,688 | 21.1% |
| 115 | Butner | 8,065.0 | 7,414 | 8.8% |
| 116 | Woodfin | 8,048.0 | 5,913 | 36.1% |
| 117 | Siler City | 7,995.0 | 7,801 | 2.5% |
| 118 | Cullowhee | 7,973.0 | 4,748 | 67.9% |
| 119 | Etowah | 7,968.0 | 6,479 | 23.0% |
| 120 | Brevard | 7,897.0 | 7,489 | 5.4% |
| 121 | Kill Devil Hills | 7,761.0 | 6,630 | 17.1% |
| 122 | Oak Ridge | 7,744.0 | 5,805 | 33.4% |
| 123 | Porters Neck | 7,654.0 | 4,988 | 53.4% |
| 124 | Marion | 7,579.0 | 8,062 | -6.0% |
| 125 | King | 7,408.0 | 6,660 | 11.2% |
| 126 | Half Moon | 7,378.0 | 8,162 | -9.6% |
| 127 | Forest City | 7,363.0 | 7,487 | -1.7% |
| 128 | Mills River | 7,281.0 | 6,633 | 9.8% |
| 129 | Trinity | 7,111.0 | 6,628 | 7.3% |
| 130 | St. James | 7,072.0 | 2,790 | 153.5% |
| 131 | Unionville | 6,954.0 | 5,853 | 18.8% |
| 132 | Swannanoa | 6,901.0 | 4,200 | 64.3% |
| 133 | Selma | 6,817.0 | 6,072 | 12.3% |
| 134 | Carolina Beach | 6,745.0 | 5,665 | 19.1% |
| 135 | Marvin | 6,692.0 | 4,889 | 36.9% |
| 136 | Silver Lake | 6,563.0 | 5,426 | 21.0% |
| 137 | Boiling Spring Lakes | 6,347.0 | 4,982 | 27.4% |
| 138 | East Flat Rock | 6,323.0 | 5,753 | 9.9% |
| 139 | Wrightsboro | 6,287.0 | 5,332 | 17.9% |
| 140 | Angier | 6,241.0 | 4,140 | 50.7% |
| 141 | Cherryville | 6,226.0 | 5,697 | 9.3% |
| 142 | Dallas | 6,104.0 | 4,352 | 40.3% |
| 143 | Mocksville | 6,068.0 | 4,952 | 22.5% |
| 144 | Stokesdale | 6,004.0 | 4,732 | 26.9% |
| 145 | Hamlet | 5,961.0 | 6,420 | -7.1% |
| 146 | Westport | 5,915.0 | 3,306 | 78.9% |
| 147 | Northchase | 5,896.0 | 2,938 | 100.7% |
| 148 | Walke | 5,873.0 | 4,581 | 28.2% |
| 149 | Locust | 5,840.0 | 2,959 | 97.4% |
| 150 | Nashville | 5,729.0 | 5,210 | 10.0% |
| 151 | Moyock | 5,684.0 | 3,987 | 42.6% |
| 152 | Bessemer City | 5,580.0 | 5,333 | 4.6% |
| 153 | Cramerton | 5,450.0 | 3,945 | 38.1% |
| 154 | Whispering Pines | 5,211.0 | 2,772 | 88.0% |
| 155 | Archer Lodge | 5,186.0 | 4,049 | 28.1% |
| 156 | Ayden | 5,150.0 | 4,862 | 5.9% |
| 157 | Williamston | 5,112.0 | 5,514 | -7.3% |
| 158 | Pleasant Garden | 5,060.0 | 4,531 | 11.7% |
| 159 | Sawmills | 5,042.0 | 5,193 | -2.9% |
| 160 | Carolina Shores | 5,017.0 | 2,863 | 75.2% |
| 161 | Long View | 5,011.0 | 4,772 | 5.0% |
| 162 | Creedmoor | 4,997.0 | 3,820 | 30.8% |
| 163 | Wadesboro | 4,972.0 | 5,882 | -15.5% |
| 164 | Granite Falls | 4,929.0 | 4,721 | 4.4% |
| 165 | Holly Ridge | 4,904.0 | 667 | 635.2% |
| 166 | Midway | 4,897.0 | 4,666 | 5.0% |
| 167 | Midland | 4,860.0 | 2,978 | 63.2% |
| 168 | James City | 4,789.0 | 6,236 | -23.2% |
| 169 | Ahoskie | 4,764.0 | 5,109 | -6.8% |
| 170 | Boiling Springs | 4,757.0 | 4,497 | 5.8% |
| 171 | Pittsboro | 4,752.0 | 3,555 | 33.7% |
| 172 | Lillington | 4,709.0 | 3,178 | 48.2% |
| 173 | Valdese | 4,704.0 | 4,534 | 3.7% |
| 174 | Whiteville | 4,696.0 | 5,255 | -10.6% |
| 175 | Beaufort | 4,689.0 | 3,997 | 17.3% |
| 176 | Weaverville | 4,687.0 | 3,106 | 50.9% |
| 177 | Erwin | 4,687.0 | 4,347 | 7.8% |
| 178 | Randleman | 4,644.0 | 4,005 | 16.0% |
| 179 | Shallotte | 4,639.0 | 3,361 | 38.0% |
| 180 | Ranlo | 4,617.0 | 3,221 | 43.3% |
| 181 | Raeford | 4,552.0 | 4,442 | 2.5% |
| 182 | Seven Lakes | 4,535.0 | 4,660 | -2.7% |
| 183 | China Grove | 4,530.0 | 3,586 | 26.3% |
| 184 | Farmville | 4,514.0 | 4,614 | -2.2% |
| 185 | Edenton | 4,494.0 | 5,111 | -12.1% |
| 186 | Mount Olive | 4,453.0 | 4,588 | -2.9% |
| 187 | Newport | 4,441.0 | 3,981 | 11.6% |
| 188 | Wingate | 4,425.0 | 3,398 | 30.2% |
| 189 | North Wilkesboro | 4,421.0 | 4,300 | 2.8% |
| 190 | Canton | 4,419.0 | 4,243 | 4.1% |
| 191 | Surf City | 4,396.0 | 1,727 | 154.5% |
| 192 | Sunset Beach | 4,351.0 | 3,333 | 30.5% |
| 193 | Royal Pines | 4,325.0 | 4,204 | 2.9% |
| 194 | Forest Oaks | 4,293.0 | 3,398 | 26.3% |
| 195 | Benson | 4,282.0 | 3,250 | 31.8% |
| 196 | Franklin | 4,268.0 | 3,848 | 10.9% |
| 197 | Southport | 4,205.0 | 2,778 | 51.4% |
| 198 | Dana | 4,147.0 | 3,884 | 6.8% |
| 199 | Spindale | 4,131.0 | 4,268 | -3.2% |
| 200 | Bethlehem | 4,101.0 | 4,249 | -3.5% |
| 201 | Stanley | 4,069.0 | 3,470 | 17.3% |
| 202 | Elkin | 4,043.0 | 4,193 | -3.6% |
| 203 | Trent Woods | 4,032.0 | 4,118 | -2.1% |
| 204 | Swansboro | 3,997.0 | 2,410 | 65.9% |
| 205 | Troutman | 3,995.0 | 2,392 | 67.0% |
| 206 | Mountain View | 3,982.0 | 3,489 | 14.1% |
| 207 | Emerald Isle | 3,934.0 | 3,620 | 8.7% |
| 208 | Lowesville | 3,874.0 | 2,630 | 47.3% |
| 209 | Burgaw | 3,850.0 | 3,831 | 0.5% |
| 210 | Tyro | 3,833.0 | 3,925 | -2.3% |
| 211 | Skippers Corner | 3,792.0 | 2,295 | 65.2% |
| 212 | Maiden | 3,788.0 | 3,325 | 13.9% |
| 213 | Tabor City | 3,777.0 | 2,512 | 50.4% |
| 214 | Hudson | 3,772.0 | 3,664 | 2.9% |
| 215 | Lowell | 3,768.0 | 3,368 | 11.9% |
| 216 | Landis | 3,765.0 | 3,104 | 21.3% |
| 217 | Buies Creek | 3,746.0 | 3,723 | 0.6% |
| 218 | Kitty Hawk | 3,724.0 | 3,265 | 14.1% |
| 219 | Jame | 3,708.0 | 3,303 | 12.3% |
| 220 | Gamewell | 3,689.0 | 4,025 | -8.3% |
| 221 | Rutherfordton | 3,680.0 | 4,202 | -12.4% |
| 222 | Eastover | 3,666.0 | 3,598 | 1.9% |
| 223 | Wilkesboro | 3,646.0 | 3,405 | 7.1% |
| 224 | Fairview | 3,619.0 | 3,323 | 8.9% |
| 225 | Rockfish | 3,574.0 | 3,270 | 9.3% |
| 226 | Flat Rock | 3,530.0 | 3,049 | 15.8% |
| 227 | Welcome | 3,521.0 | 4,484 | -21.5% |
| 228 | Glen Raven | 3,506.0 | 2,663 | 31.7% |
| 229 | Rural Hall | 3,466.0 | 2,853 | 21.5% |
| 230 | Wallace | 3,457.0 | 3,777 | -8.5% |
| 231 | Mountain Home | 3,437.0 | 3,203 | 7.3% |
| 232 | Lake Park | 3,431.0 | 3,243 | 5.8% |
| 233 | Brices Creek | 3,415.0 | 2,767 | 23.4% |
| 234 | Red Oak | 3,405.0 | 3,295 | 3.3% |
| 235 | River Road | 3,366.0 | 4,762 | -29.3% |
| 236 | Spencer | 3,349.0 | 3,288 | 1.9% |
| 237 | Enochville | 3,321.0 | 2,579 | 28.8% |
| 238 | Mineral Springs | 3,314.0 | 2,553 | 29.8% |
| 239 | Elizabet | 3,277.0 | 3,636 | -9.9% |
| 240 | Windsor | 3,269.0 | 3,328 | -1.8% |
| 241 | Louisburg | 3,263.0 | 3,328 | -2.0% |
| 242 | Elroy | 3,251.0 | 3,890 | -16.4% |
| 243 | Plymouth | 3,250.0 | 3,912 | -16.9% |
| 244 | Green Level | 3,230.0 | 2,022 | 59.7% |
| 245 | Bermuda Run | 3,211.0 | 1,667 | 92.6% |
| 246 | Lake Junaluska | 3,175.0 | 2,717 | 16.9% |
| 247 | Murfreesboro | 3,170.0 | 2,770 | 14.4% |
| 248 | Lake Royale | 3,168.0 | 2,492 | 27.1% |
| 249 | Nags Head | 3,160.0 | 2,785 | 13.5% |
| 250 | Wallburg | 3,150.0 | 3,017 | 4.4% |
| 251 | Southern Shores | 3,139.0 | 2,656 | 18.2% |
| 252 | Red Springs | 3,125.0 | 3,439 | -9.1% |
| 253 | Granite Quarry | 3,043.0 | 2,787 | 9.2% |
| 254 | Mars Hill | 3,025.0 | 2,726 | 11.0% |
| 255 | Youngsville | 3,011.0 | 1,108 | 171.8% |
| 256 | Yadkinville | 3,004.0 | 2,945 | 2.0% |
| 257 | Bayshore | 2,949.0 | 4,230 | -30.3% |
| 258 | Fairfield Harbour | 2,948.0 | 2,764 | 6.7% |
| 259 | Troy | 2,926.0 | 3,219 | -9.1% |
| 260 | Carthage | 2,896.0 | 1,402 | 106.6% |
| 261 | Avery Creek | 2,887.0 | 2,267 | 27.3% |
| 262 | Mar-Mac | 2,877.0 | 3,401 | -15.4% |
| 263 | River Bend | 2,874.0 | 3,041 | -5.5% |
| 264 | Jonesville | 2,860.0 | 2,397 | 19.3% |
| 265 | Haw River | 2,824.0 | 1,848 | 52.8% |
| 266 | Pembroke | 2,822.0 | 2,931 | -3.7% |
| 267 | Rockwell | 2,782.0 | 1,716 | 62.1% |
| 268 | East Rockingham | 2,779.0 | 3,988 | -30.3% |
| 269 | La Grange | 2,756.0 | 2,860 | -3.6% |
| 270 | Wilson's Mills | 2,753.0 | 2,114 | 30.2% |
| 271 | Warsaw | 2,746.0 | 3,066 | -10.4% |
| 272 | Brogden | 2,733.0 | 2,490 | 9.8% |
| 273 | Sneads Ferry | 2,728.0 | 2,128 | 28.2% |
| 274 | Edneyville | 2,716.0 | 1,930 | 40.7% |
| 275 | Cajah's Mountain | 2,704.0 | 2,790 | -3.1% |
| 276 | Cape Carteret | 2,703.0 | 1,968 | 37.3% |
| 277 | Wentworth | 2,692.0 | 2,788 | -3.4% |
| 278 | St. Pauls | 2,688.0 | 2,051 | 31.1% |
| 279 | Oakboro | 2,683.0 | 1,912 | 40.3% |
| 280 | Liberty | 2,682.0 | 2,688 | -0.2% |
| 281 | Valley Hill | 2,675.0 | 2,626 | 1.9% |
| 282 | Neuse Forest | 2,671.0 | 1,521 | 75.6% |
| 283 | Wrightsville Beach | 2,665.0 | 2,587 | 3.0% |
| 284 | Tobaccoville | 2,664.0 | 2,346 | 13.6% |
| 285 | Sylva | 2,646.0 | 2,571 | 2.9% |
| 286 | Franklinton | 2,645.0 | 2,070 | 27.8% |
| 287 | Marshville | 2,615.0 | 2,391 | 9.4% |
| 288 | Belville | 2,573.0 | 1,884 | 36.6% |
| 289 | Polkton | 2,555.0 | 3,270 | -21.9% |
| 290 | Swepsonville | 2,517.0 | 1,209 | 108.2% |
| 291 | Grifton | 2,515.0 | 2,516 | -0.0% |
| 292 | Denver | 2,497.0 | 1,923 | 29.8% |
| 293 | South Rosemary | 2,475.0 | 3,118 | -20.6% |
| 294 | Kure Beach | 2,466.0 | 1,617 | 52.5% |
| 295 | Fairmont | 2,463.0 | 2,657 | -7.3% |
| 296 | Four Oaks | 2,459.0 | 1,866 | 31.8% |
| 297 | Snow Hill | 2,438.0 | 1,907 | 27.8% |
| 298 | Norwood | 2,433.0 | 2,122 | 14.7% |
| 299 | Connelly Springs | 2,427.0 | 1,589 | 52.7% |
| 300 | Laurel Park | 2,408.0 | 2,294 | 5.0% |
| 301 | Mayodan | 2,401.0 | 2,506 | -4.2% |
| 302 | Spruce Pine | 2,398.0 | 2,252 | 6.5% |
| 303 | Fruitland | 2,398.0 | 1,575 | 52.3% |
| 304 | Salem | 2,377.0 | 2,214 | 7.4% |
| 305 | Calabash | 2,377.0 | 1,864 | 27.5% |
| 306 | Kenly | 2,359.0 | 1,697 | 39.0% |
| 307 | Fearrington Village | 2,356.0 | 2,350 | 0.3% |
| 308 | Richlands | 2,335.0 | 1,494 | 56.3% |
| 309 | Maxton | 2,330.0 | 3,162 | -26.3% |
| 310 | Cricket | 2,317.0 | 2,131 | 8.7% |
| 311 | Bladenboro | 2,249.0 | 2,226 | 1.0% |
| 312 | Madison | 2,242.0 | 2,506 | -10.5% |
| 313 | Mount Pleasant | 2,230.0 | 1,727 | 29.1% |
| 314 | Yanceyville | 2,215.0 | 2,516 | -12.0% |
| 315 | Hildebran | 2,207.0 | 1,378 | 60.2% |
| 316 | Taylorsville | 2,201.0 | 1,902 | 15.7% |
| 317 | Badin | 2,184.0 | 1,774 | 23.1% |
| 318 | Icard | 2,153.0 | 2,716 | -20.7% |
| 319 | Enfield | 2,153.0 | 2,560 | -15.9% |
| 320 | Ramseur | 2,150.0 | 1,671 | 28.7% |
| 321 | Drexel | 2,146.0 | 1,907 | 12.5% |
| 322 | Biscoe | 2,116.0 | 2,493 | -15.1% |
| 323 | Walnut Cove | 2,115.0 | 1,383 | 52.9% |
| 324 | Maggie Valley | 2,112.0 | 1,069 | 97.6% |
| 325 | Hemby Bridge | 2,096.0 | 1,570 | 33.5% |
| 326 | Burnsville | 2,082.0 | 2,156 | -3.4% |
| 327 | Cherokee | 2,059.0 | 3,182 | -35.3% |
| 328 | Navassa | 2,039.0 | 1,809 | 12.7% |
| 329 | Mulberry | 2,037.0 | 2,152 | -5.3% |
| 330 | Pine Level | 2,031.0 | 1,531 | 32.7% |
| 331 | Manteo | 2,020.0 | 1,717 | 17.6% |
| 332 | Scotland Neck | 2,006.0 | 2,317 | -13.4% |
| 333 | Andrews | 1,998.0 | 2,117 | -5.6% |
| 334 | Glen Alpine | 1,991.0 | 1,585 | 25.6% |
| 335 | Wanchese | 1,956.0 | 1,752 | 11.6% |
| 336 | Sparta | 1,928.0 | 1,694 | 13.8% |
| 337 | Foxfire | 1,925.0 | 779 | 147.1% |
| 338 | Claremont | 1,922.0 | 1,385 | 38.8% |
| 339 | Vander | 1,922.0 | 995 | 93.2% |
| 340 | Cedar Point | 1,917.0 | 1,265 | 51.5% |
| 341 | Bryson City | 1,902.0 | 1,542 | 23.3% |
| 342 | Robbins | 1,893.0 | 1,119 | 69.2% |
| 343 | Jefferson | 1,864.0 | 1,603 | 16.3% |
| 344 | Sea Breeze | 1,849.0 | 1,947 | -5.0% |
| 345 | Broad Creek | 1,836.0 | 2,236 | -17.9% |
| 346 | Tryon | 1,810.0 | 1,777 | 1.9% |
| 347 | Pinebluff | 1,806.0 | 1,519 | 18.9% |
| 348 | Fairplains | 1,803.0 | 2,143 | -15.9% |
| 349 | Lake Waccamaw | 1,770.0 | 1,023 | 73.0% |
| 350 | Plain View | 1,741.0 | 1,895 | -8.1% |
| 351 | Atlantic Beach | 1,719.0 | 1,919 | -10.4% |
| 352 | Northlakes | 1,716.0 | 1,744 | -1.6% |
| 353 | Millers Creek | 1,689.0 | 1,595 | 5.9% |
| 354 | Hoopers Creek | 1,683.0 | 1,080 | 55.8% |
| 355 | Stedman | 1,670.0 | 1,077 | 55.1% |
| 356 | Coats | 1,664.0 | 2,118 | -21.4% |
| 357 | Princeton | 1,658.0 | 1,304 | 27.1% |
| 358 | Broadway | 1,657.0 | 1,178 | 40.7% |
| 359 | Dobson | 1,652.0 | 1,867 | -11.5% |
| 360 | Vass | 1,644.0 | 606 | 171.3% |
| 361 | Weldon | 1,642.0 | 1,716 | -4.3% |
| 362 | Pumpkin Center | 1,636.0 | 1,907 | -14.2% |
| 363 | Cove Creek | 1,629.0 | 1,482 | 9.9% |
| 364 | Princeville | 1,619.0 | 2,455 | -34.1% |
| 365 | Hertford | 1,618.0 | 1,848 | -12.4% |
| 366 | Efland | 1,611.0 | 591 | 172.6% |
| 367 | Sharpsburg | 1,605.0 | 2,156 | -25.6% |
| 368 | Murphy | 1,604.0 | 2,181 | -26.5% |
| 369 | Boonville | 1,593.0 | 1,571 | 1.4% |
| 370 | Gorman | 1,591.0 | 663 | 140.0% |
| 371 | Biltmore Forest | 1,587.0 | 1,562 | 1.6% |
| 372 | Belhaven | 1,577.0 | 1,937 | -18.6% |
| 373 | Bethel | 1,544.0 | 1,153 | 33.9% |
| 374 | Lake Lure | 1,543.0 | 1,240 | 24.4% |
| 375 | Southmont | 1,525.0 | 1,330 | 14.7% |
| 376 | Stanfield | 1,522.0 | 1,573 | -3.2% |
| 377 | Denton | 1,506.0 | 1,661 | -9.3% |
| 378 | Horse Shoe | 1,490.0 | 2,800 | -46.8% |
| 379 | Pilot Mountain | 1,483.0 | 1,690 | -12.2% |
| 380 | Banner Elk | 1,473.0 | 931 | 58.2% |
| 381 | West Jefferson | 1,436.0 | 1,435 | 0.1% |
| 382 | East Spencer | 1,434.0 | 1,717 | -16.5% |
| 383 | Pinetops | 1,426.0 | 1,263 | 12.9% |
| 384 | Walnut Creek | 1,422.0 | 950 | 49.7% |
| 385 | West Canton | 1,412.0 | 1,156 | 22.1% |
| 386 | Advance | 1,408.0 | 1,148 | 22.6% |
| 387 | Spring Hope | 1,387.0 | 1,253 | 10.7% |
| 388 | Bent Creek | 1,384.0 | 1,427 | -3.0% |
| 389 | Rutherford College | 1,374.0 | 1,184 | 16.0% |
| 390 | Stony Point | 1,372.0 | 1,441 | -4.8% |
| 391 | Cordova | 1,372.0 | 1,057 | 29.8% |
| 392 | Clyde | 1,359.0 | 1,001 | 35.8% |
| 393 | Chadbourn | 1,352.0 | 2,361 | -42.7% |
| 394 | Pine Knoll Shores | 1,351.0 | 1,501 | -10.0% |
| 395 | Maury | 1,339.0 | 499 | 168.3% |
| 396 | Rose Hill | 1,309.0 | 1,399 | -6.4% |
| 397 | Beulaville | 1,307.0 | 1,675 | -22.0% |
| 398 | Saxapahaw | 1,301.0 | 1,128 | 15.3% |
| 399 | Elm City | 1,292.0 | 1,370 | -5.7% |
| 400 | Moravian Falls | 1,285.0 | 1,633 | -21.3% |
| 401 | Star | 1,282.0 | 1,030 | 24.5% |
| 402 | Buxton | 1,267.0 | 958 | 32.3% |
| 403 | Alamance | 1,267.0 | 809 | 56.6% |
| 404 | Bayboro | 1,266.0 | 1,405 | -9.9% |
| 405 | Stem | 1,249.0 | 788 | 58.5% |
| 406 | Foscoe | 1,226.0 | 819 | 49.7% |
| 407 | Robersonville | 1,220.0 | 1,547 | -21.1% |
| 408 | Hayesville | 1,208.0 | 681 | 77.4% |
| 409 | Lucama | 1,205.0 | 961 | 25.4% |
| 410 | Mount Gilead | 1,197.0 | 1,834 | -34.7% |
| 411 | Rhodhiss | 1,166.0 | 1,272 | -8.3% |
| 412 | Candor | 1,160.0 | 863 | 34.4% |
| 413 | Dortches | 1,158.0 | 789 | 46.8% |
| 414 | Barker Ten Mile | 1,156.0 | 1,179 | -2.0% |
| 415 | Balfour | 1,134.0 | 1,082 | 4.8% |
| 416 | Franklinville | 1,131.0 | 1,168 | -3.2% |
| 417 | Roseboro | 1,123.0 | 1,555 | -27.8% |
| 418 | Camden | 1,115.0 | 534 | 108.8% |
| 419 | Stoneville | 1,094.0 | 1,038 | 5.4% |
| 420 | Kenansville | 1,090.0 | 1,082 | 0.7% |
| 421 | Norlina | 1,087.0 | 999 | 8.8% |
| 422 | Germanton | 1,087.0 | 673 | 61.5% |
| 423 | Woodlawn | 1,085.0 | 1,249 | -13.1% |
| 424 | Cleveland | 1,080.0 | 649 | 66.4% |
| 425 | Highlands | 1,074.0 | 984 | 9.1% |
| 426 | Barker Heights | 1,074.0 | 1,479 | -27.4% |
| 427 | Columbus | 1,071.0 | 1,299 | -17.6% |
| 428 | West Marion | 1,066.0 | 2,012 | -47.0% |
| 429 | Bonnetsville | 1,063.0 | 556 | 91.2% |
| 430 | Harkers Island | 1,060.0 | 1,093 | -3.0% |
| 431 | Hays | 1,053.0 | 1,601 | -34.2% |
| 432 | Moncure | 1,039.0 | 532 | 95.3% |
| 433 | Ellerbe | 1,036.0 | 914 | 13.3% |
| 434 | Vanceboro | 1,030.0 | 817 | 26.1% |
| 435 | Magnolia | 1,024.0 | 1,824 | -43.9% |
| 436 | Maysville | 1,022.0 | 1,082 | -5.5% |
| 437 | Rocky Point | 1,020.0 | 1,815 | -43.8% |
| 438 | Mcadenville | 1,010.0 | 508 | 98.8% |
| 439 | Peletier | 1,009.0 | 627 | 60.9% |